複数の指標をクロスさせたインテリジェントなトレンド取引戦略

EMA RSI MACD INTRADAY
作成日: 2025-02-21 14:37:35 最終変更日: 2025-02-27 16:54:34
コピー: 4 クリック数: 460
2
フォロー
319
フォロワー

複数の指標をクロスさせたインテリジェントなトレンド取引戦略 複数の指標をクロスさせたインテリジェントなトレンド取引戦略

概要

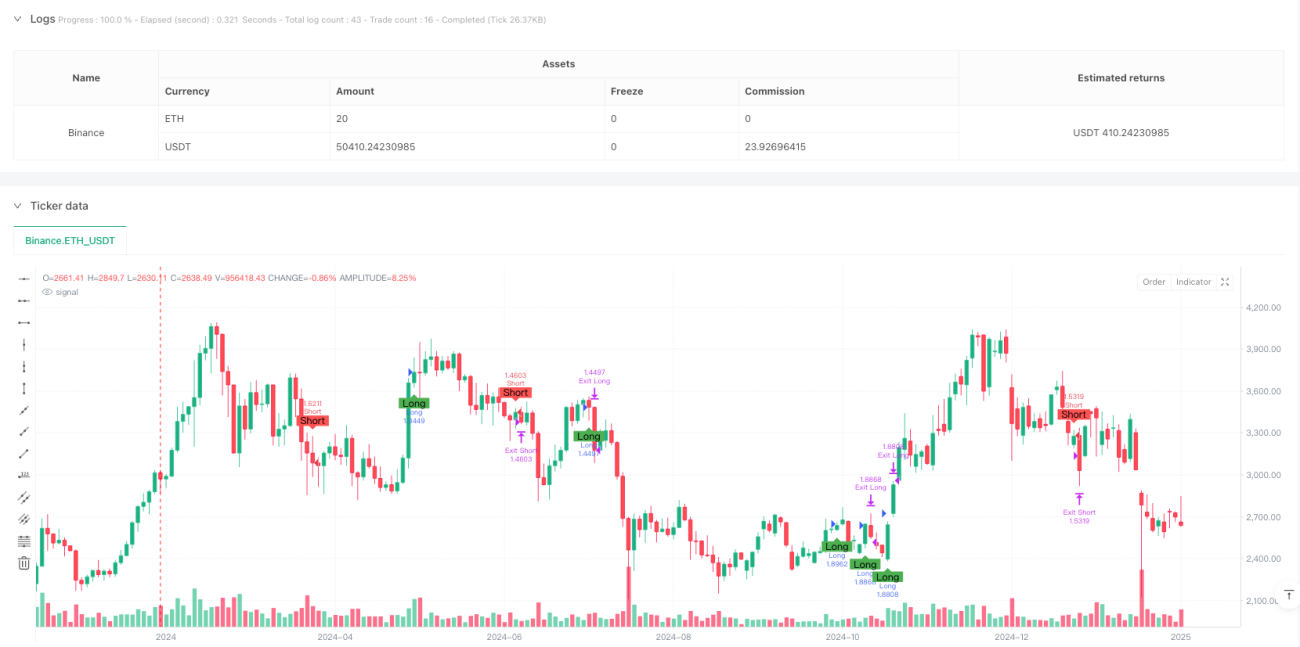
これは,複数の技術指標の交叉信号に基づくスマート型トレンド追跡戦略である. この戦略は,移動平均 ((EMA),相対的に強い指標 ((RSI) と移動平均トレンド散度 ((MACD) の3つの技術指標を統合し,多次元信号確認を使用して市場トレンドを識別し,ダイナミックなストップ・ロスを配合してリスク管理を行う. 戦略は,全自動取引方式を採用し,特に日内取引に適しています.

戦略原則

戦略の核心的な論理は,技術指標のフィルタリングの3層に基づいています.

  1. 9周期と21周期の指数移動平均 ((EMA) を交差してトレンド方向を確認する
  2. 比較的強い指標 ((RSI)) を利用して,過買過売領域をフィルタリングし,極端な市場条件で入場を避ける
  3. MACD指数によるトレンドの強さと方向のさらなる確認

入口信号の生成は,以下の条件を同時に満たす必要がある.

  • 複数条件:短期EMA上での長期EMA,RSIが70未満で,MACD線が信号線上にある
  • 空白条件:短期EMAの下から長期EMAを通り,RSIは30以上で,MACD線は信号線の下にある

戦略は,資金の百分位保有モードを採用し,取引ごとに10%の口座権益を使用し,2%のストップと1%のストップ損失を配合してリスク管理を行います.

戦略的優位性

  1. マルチメーターのクロス検証により,偽信号のリスクを大幅に低減
  2. ダイナミックストップ・ストップ設定,入場価格に応じてリスク管理レベルを自動的に調整する
  3. 資金利用の最適化配置を実現する割合ポジション管理
  4. 完全自動化,人工介入なし,感情的な影響が減る
  5. ポジション制御とストップダストの仕組みを含む完全なリスク管理システム

戦略リスク

  1. 複数の指標が信号を遅らせ,高速でチャンスを逃す
  2. 固定パーセンテージのストップ・ロスは,波動性の高い市場では過早にトリガーされる可能性があります.
  3. 横盤市場では,技術指数に依存しすぎると偽信号が多く発生する可能性があります.
  4. 戦略的利益に重要な影響を与えるのは,手数料のコストです.

リスク管理の提案:

  • 市場変動に応じて動的に調整されるストップ・ストップ比率
  • トレンド強度フィルターを増やし,横軸市場の取引頻度を減らす
  • ポジションの時間管理を最適化し,夜間リスクを回避する

戦略最適化の方向性

  1. 指標パラメータの最適化
  • EMAサイクルを最適化し,最適な短期および長期サイクル組み合わせを探します.
  • RSIの超買超売の値を調整して,異なる市場状況に対応する
  • MACDパラメータを最適化して,トレンド認識の正確性を向上させる
  1. リスク管理の最適化
  • ダイナミックなストップ・ストップ比率を実現し,市場の変動に応じて自動的に調整
  • 最大撤回制御の強化
  • 長期にわたる監禁を回避するために,タイムアウトメカニズムを導入する
  1. トランザクション実行最適化
  • 取引量フィルターを追加し,流動性の低い環境での取引を避ける
  • コスト均等化のための分批の建設と平和倉庫の仕組みを実現
  • 市場波動性指数に追加し,ポジション比率を動的に調整

要約する

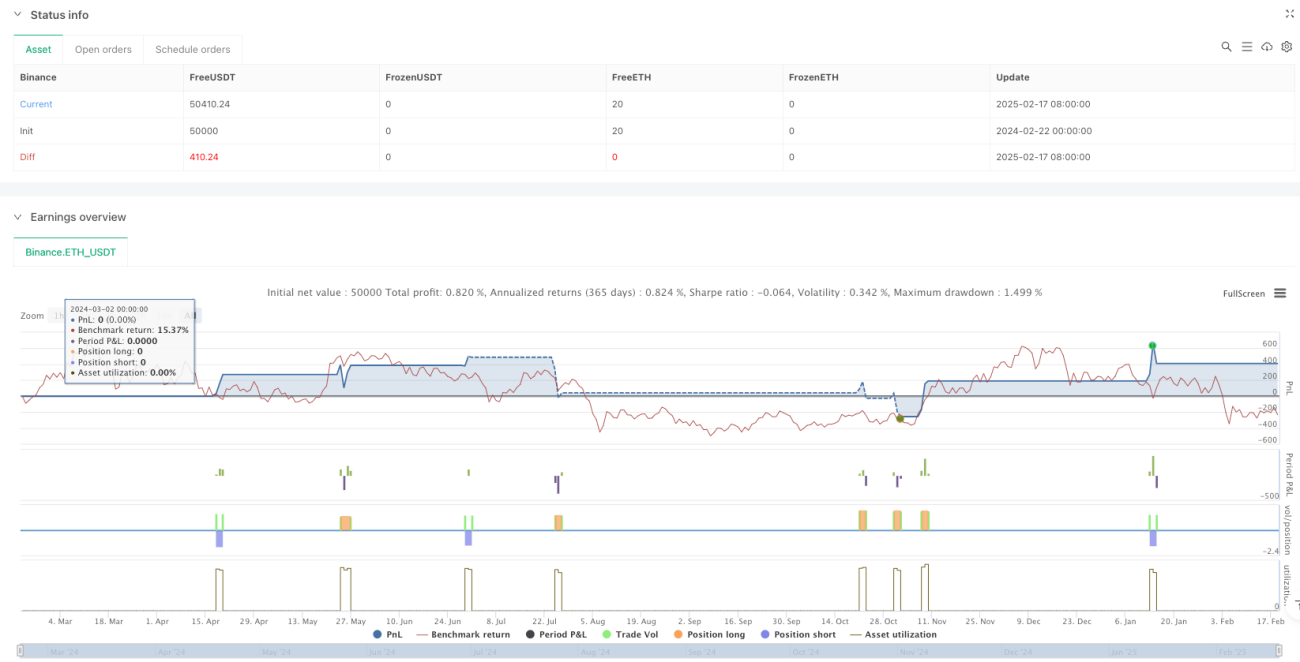
この戦略は,複数の技術指標の協同作用によって,比較的完善なトレンド追跡システムを構築している.戦略の優点は,信号の信頼性が高いこと,リスク管理の完善である,しかし,ある程度の遅れと市場環境への依存性もある.戦略の推奨された最適化方向によって,戦略は,その適応性と安定性をさらに向上させることができる.実地でのアプリケーションでは,十分な反測とパラメータの最適化が行われ,市場の実際の状況に合わせて適切な調整が行われることを推奨している.

ストラテジーソースコード
/*backtest
start: 2024-02-22 00:00:00
end: 2025-02-19 08:00:00
period: 2d
basePeriod: 2d
exchanges: [{"eid":"Binance","currency":"ETH_USDT"}]
*/

// This Pine Script™ code is subject to the terms of the Mozilla Public License 2.0 at https://mozilla.org/MPL/2.0/
// © egidiopalmieri

//@version=5
strategy("BTCUSD Intraday - AI-like Strategy", overlay=true, initial_capital=10000, default_qty_type=strategy.percent_of_equity, default_qty_value=10, commission_type=strategy.commission.percent, commission_value=0.1)

// ==========================
// Risk and Strategy Parameters
// ==========================
takeProfitPerc = input.float(2.0, "Take Profit (%)", step=0.1) / 100.0  // Target profit: 2%
stopLossPerc   = input.float(1.0, "Stop Loss (%)", step=0.1)   / 100.0  // Stop loss: 1%

// ==========================
// Technical Indicators
// ==========================
emaShortPeriod = input.int(9, "Short EMA (period)", minval=1)
emaLongPeriod  = input.int(21, "Long EMA (period)", minval=1)
emaShort = ta.ema(close, emaShortPeriod)
emaLong  = ta.ema(close, emaLongPeriod)

// RSI Indicator
rsiPeriod = input.int(14, "RSI (period)", minval=1)
rsiValue  = ta.rsi(close, rsiPeriod)

// MACD Indicator
[macdLine, signalLine, _] = ta.macd(close, 12, 26, 9)

// ==========================
// Entry Conditions
// ==========================
// LONG entry: short EMA crosses above long EMA, RSI not in overbought zone, MACD in bullish trend
longCondition = ta.crossover(emaShort, emaLong) and (rsiValue < 70) and (macdLine > signalLine)
// SHORT entry: short EMA crosses below long EMA, RSI not in oversold zone, MACD in bearish trend
shortCondition = ta.crossunder(emaShort, emaLong) and (rsiValue > 30) and (macdLine < signalLine)

// ==========================
// Signal Visualization
// ==========================
plotshape(longCondition, title="Long Signal", location=location.belowbar, color=color.green, style=shape.labelup, text="Long")
plotshape(shortCondition, title="Short Signal", location=location.abovebar, color=color.red, style=shape.labeldown, text="Short")

// ==========================
// Entry Logic
// ==========================
if (longCondition)
    strategy.entry("Long", strategy.long)

if (shortCondition)
    strategy.entry("Short", strategy.short)

// ==========================
// Stop Loss and Take Profit Management
// The levels are calculated dynamically based on the average entry price
// ==========================
if strategy.position_size > 0
    // For long positions
    longSL = strategy.position_avg_price * (1 - stopLossPerc)
    longTP = strategy.position_avg_price * (1 + takeProfitPerc)
    strategy.exit("Exit Long", from_entry="Long", stop=longSL, limit=longTP)

if strategy.position_size < 0
    // For short positions
    shortSL = strategy.position_avg_price * (1 + stopLossPerc)
    shortTP = strategy.position_avg_price * (1 - takeProfitPerc)
    strategy.exit("Exit Short", from_entry="Short", stop=shortSL, limit=shortTP)

// ==========================
// Final Notes
// ==========================
// This script uses rules based on technical indicators to generate signals
// "AI-like". The integration of actual AI algorithms is not natively supported in PineScript.
// It is recommended to customize, test, and validate the strategy before using it in live trading.