RSIとストキャスティクスRSIに基づくデュアルモメンタムトレンド反転戦略

RSI SRSI MA SMA
作成日: 2025-02-21 14:46:44 最終変更日: 2025-02-27 16:53:04
コピー: 3 クリック数: 370
2
フォロー
319
フォロワー

RSIとストキャスティクスRSIに基づくデュアルモメンタムトレンド反転戦略 RSIとストキャスティクスRSIに基づくデュアルモメンタムトレンド反転戦略

概要

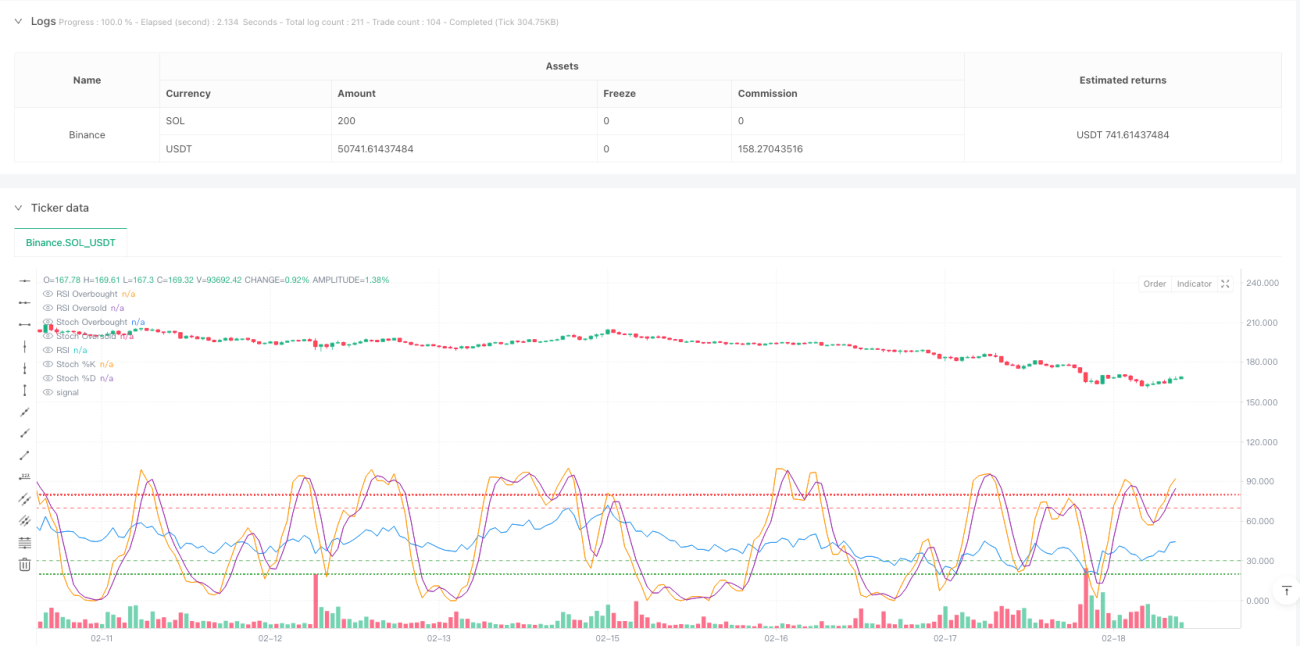
これは,相対的に弱い指標 ((RSI) とランダムに相対的に強い指標 ((Stochastic RSI) を組み合わせたトレンド反転取引戦略である. この戦略は,市場の超買い超売り状態と動力の変化を識別して潜在的な反転点を捕捉して取引する. この戦略の核心は,RSIを基礎動力の指標として使用し,その基礎でStochastic RSIを計算して,価格動力の変化の方向をさらに確認する.

戦略原則

戦略の主な論理には以下の重要なステップが含まれています.

  1. まず,全体的な超買超売状態を判断するために,閉店価格のRSI値を計算します.
  2. RSI値を基に計算する ストキャスティック RSIの%K線と%D線
  3. RSIが超売り領域 (デフォルトは30以下) にあり,ストキャスティックRSIの%Kラインが%Dラインを上から下から横切るとき,多信号をトリガーします.
  4. RSIが超買い領域 (デフォルトは70以上) にあり,ストキャスティックRSIの%Kラインが%Dラインを上から下へと横切ったとき,空白信号を触発します.
  5. 逆のRSI条件またはストキャスティックRSIが逆交したとき,平仓を退出します.

戦略的優位性

  1. 二重確認メカニズム - RSIとストキャスティックRSIの組み合わせにより,偽の突破のリスクを効果的に軽減できます.
  2. カスタマイズ可能なパラメータ - RSI周期,超買い超売り値などの戦略の重要なパラメータは,異なる市場状況に応じて調整することができます.
  3. ダイナミックビジュアル化 - 戦略は,トレーダーが監視できるように,RSIとストキャスティックRSIのリアルタイムチャート表示を提供します.
  4. リスク管理の統合 - 完全なストップ・ロスとリターン・クローズメント
  5. 適応性 - 異なる時間周期と市場環境に適用できる

戦略リスク

  1. 振動市場のリスク - 横盤振動市場では頻繁に偽信号が生じる可能性がある
  2. 遅滞リスク - 複数の平均線平滑を使用しているため,信号が一定程度遅滞する可能性があります.
  3. パラメータの感受性 - パラメータの異なる設定により,取引結果が大きく異なる可能性があります.
  4. 市場環境依存性 - 強いトレンドの市場では,一部の動きが逃れることがあります.
  5. 資金管理のリスク - リスクをコントロールするために合理的なポジション比率を設定する必要があります.

戦略最適化の方向性

  1. トレンドフィルターを追加 - 長期移動平均をトレンドフィルターとして追加し,トレンドの方向のみでポジションを開きます
  2. オプティマイズされたストップメカニズム - 追跡ストップまたはATRストップのようなダイナミックストップを導入できる
  3. 交差量指標の導入 - 交差量分析を組み合わせて信号の信頼性を向上させる
  4. タイムフィルターを追加 - 重要なニュースリリースや流動性の低い時間帯を回避する
  5. 適応パラメータの開発 - 市場の変動に応じて戦略パラメータを自動的に調整する

要約する

これは,動力とトレンド反転を組み合わせた総合的な戦略であり,RSIとストキャスティックRSIの協同作用によって潜在的な取引機会を識別する.戦略は合理的に設計され,優れた調整性と適応性を持っています.しかし,実際のアプリケーションでは,市場環境の選択とリスク管理に注意する必要があります.

ストラテジーソースコード
/*backtest
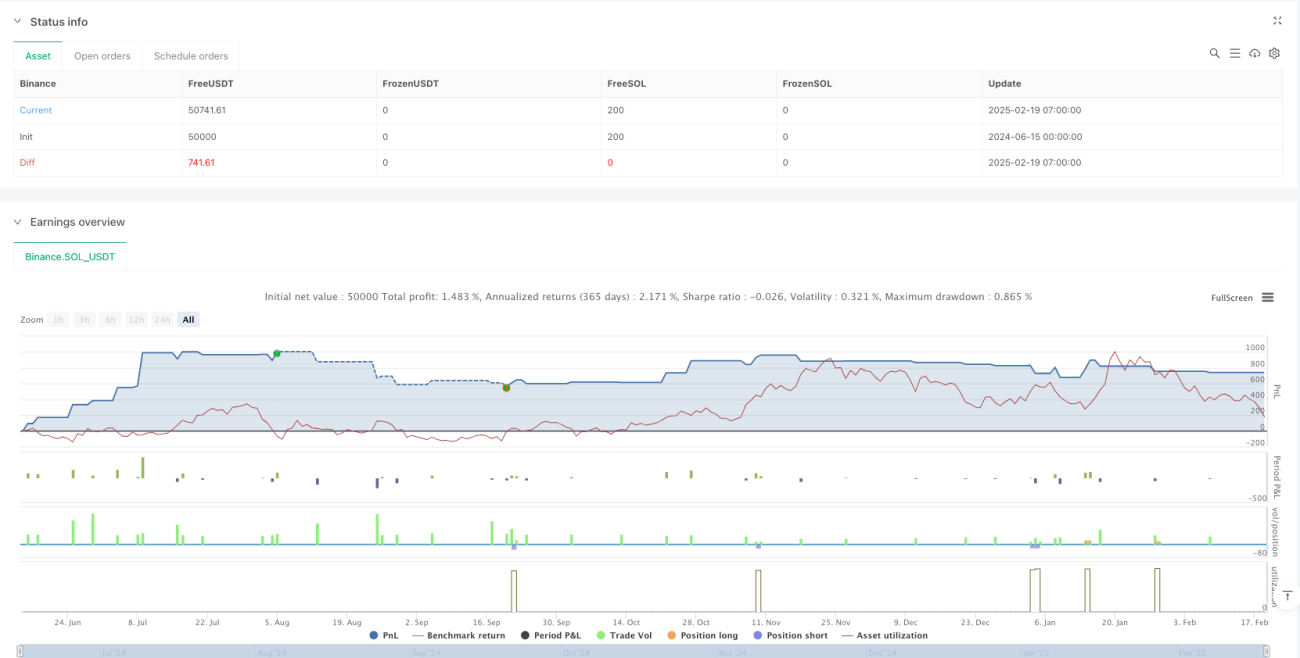
start: 2024-06-15 00:00:00
end: 2025-02-19 08:00:00
period: 1h
basePeriod: 1h
exchanges: [{"eid":"Binance","currency":"SOL_USDT"}]
*/

//@version=5
strategy("RSI + Stochastic RSI Strategy", overlay=true, initial_capital=100000, default_qty_type=strategy.percent_of_equity, default_qty_value=10)

// INPUTS
// RSI settings
rsiLength      = input.int(14, "RSI Length", minval=1)
rsiOverbought  = input.int(70, "RSI Overbought Level")
rsiOversold    = input.int(30, "RSI Oversold Level")

// Stochastic RSI settings
stochLength      = input.int(14, "Stoch RSI Length", minval=1)
smoothK          = input.int(3, "Stoch %K Smoothing", minval=1)
smoothD          = input.int(3, "Stoch %D Smoothing", minval=1)
stochOverbought  = input.int(80, "Stoch Overbought Level")
stochOversold    = input.int(20, "Stoch Oversold Level")

// CALCULATIONS
// Compute RSI value on the closing price
rsiValue = ta.rsi(close, rsiLength)

// Calculate Stochastic RSI using the RSI value as source
rsiStoch = ta.stoch(rsiValue, rsiValue, rsiValue, stochLength)
kValue   = ta.sma(rsiStoch, smoothK)
dValue   = ta.sma(kValue, smoothD)

// PLOTTING
// Plot RSI and reference lines
plot(rsiValue, title="RSI", color=color.blue)
hline(rsiOverbought, "RSI Overbought", color=color.red)
hline(rsiOversold, "RSI Oversold", color=color.green)

// Plot Stochastic RSI %K and %D along with overbought/oversold levels
plot(kValue, title="Stoch %K", color=color.orange)
plot(dValue, title="Stoch %D", color=color.purple)
hline(stochOverbought, "Stoch Overbought", color=color.red, linestyle=hline.style_dotted)
hline(stochOversold, "Stoch Oversold", color=color.green, linestyle=hline.style_dotted)

// STRATEGY CONDITIONS
// Long Condition: RSI below oversold and Stoch RSI crosses upward while in oversold territory
longCondition  = (rsiValue < rsiOversold) and (kValue < stochOversold) and ta.crossover(kValue, dValue)
// Long Exit: When RSI goes above overbought or a downward cross occurs on the Stoch RSI
longExit       = (rsiValue > rsiOverbought) or ta.crossunder(kValue, dValue)

// Short Condition: RSI above overbought and Stoch RSI crosses downward while in overbought territory
shortCondition = (rsiValue > rsiOverbought) and (kValue > stochOverbought) and ta.crossunder(kValue, dValue)
// Short Exit: When RSI goes below oversold or an upward cross occurs on the Stoch RSI
shortExit      = (rsiValue < rsiOversold) or ta.crossover(kValue, dValue)

// EXECUTE TRADES
if (longCondition)
    strategy.entry("Long", strategy.long)
if (longExit)
    strategy.close("Long")

if (shortCondition)
    strategy.entry("Short", strategy.short)
if (shortExit)
    strategy.close("Short")