
2
Follow
478
Followers
概要
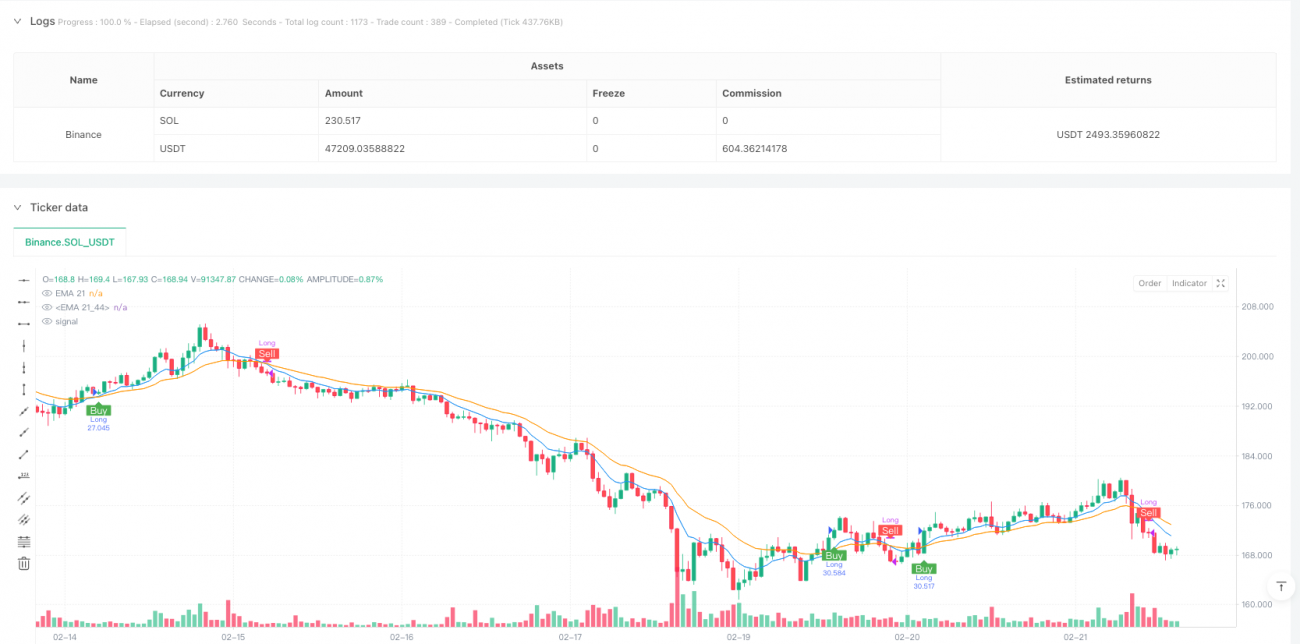
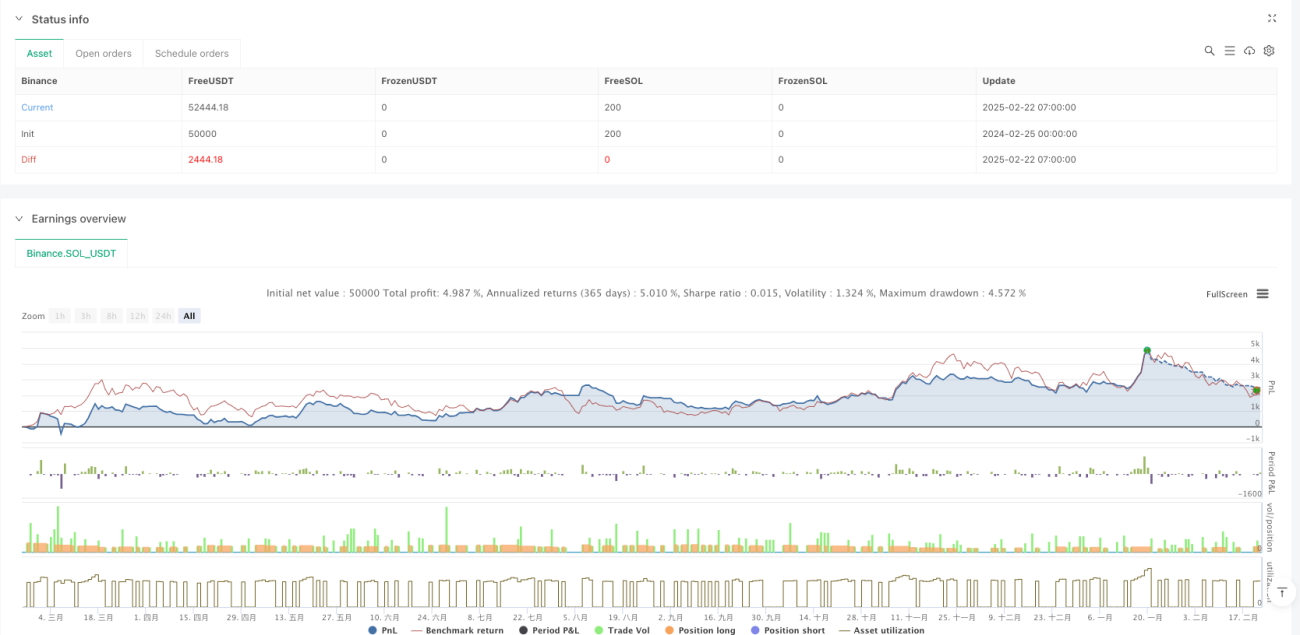
この戦略は,双均線交差に基づく取引システムで,9周期と21周期インデックス移動平均 ((EMA)) の交差を監視して取引を行う.戦略は,10分間の時間枠で動作し,ポジションを保持する際にポジションを繰り返し開設しない単一取引モードを採用する.システムは,初期資金10万を使用し,取引ごとに口座利権の10%を使用する.
戦略原則
戦略の核心原則は,長期EMAよりも市場価格の変化に対する短期のEMAの感受性が高いという特性を利用することである.短期のEMA ((9期) が長期のEMA ((21期) を横断すると,短期的な上位<unk>動力が強化され,システムが複数の信号を発信する.短期のEMAが短期のEMAを横断すると,短期的な下位<unk>動力が強化され,システムが平仓信号を発信する.戦略は,position_sizeパラメータを使用して,同時に1つの取引しか持たないことを保証し,リスクを効果的に制御する.
戦略的優位性
- 信号明晰度:取引信号としてEMA交差を使用し,基準を客観的に明確に判断し,主観的な干渉を避ける.
- リスク管理: 単一取引モデルを採用し,重複のポジションによるリスクの重複を避ける.
- 資金管理:口座の利回りパーセントを使用してポジション管理を行い,口座の利益損失に合わせて取引規模を動的に調整する.
- ビジュアルサポート:システムは取引シグナルラベルと均線走行グラフを提供し,トレーダーが直感的に判断できるようにする.
- リアルタイムリマインダー: 取引シグナルのリマインダー機能が組み込まれ,取引者が重要な取引機会を逃さないようにします.
戦略リスク
- 振動市場リスク:横盤振動市場では,頻繁な均線交差が複数の偽突破を引き起こす可能性がある.
- 遅滞のリスク:EMAは本質的に遅滞の指標であり,急速な状況で最適な入場点を逃す可能性があります.
- 単一次元: 均線交差のみに依存すると,他の重要な市場情報が無視される可能性があります.
- 固定サイクルリスク:10分間の時間枠は,すべての市場環境に適用されない可能性があります.
戦略最適化の方向性
- 多次元検証:交差量,波動率などの補助指標を増やして信号の信頼性を向上させる.
- ダイナミックパラメータ:EMAサイクルをダイナミックパラメータとして設定し,市場の変動に応じて自律的に調整できます.
- ポジション管理:変動率に基づく動的調整など,より複雑なポジション管理システムを導入することができる.
- 市場環境認識:市場環境認識モジュールを追加し,異なる市場条件で異なる取引パラメータを採用する.
- ストップ・損失最適化: ダイナミック・ストップ・損失メカニズムを導入し,リスク管理の柔軟性を高めます.
要約する
これは,合理的で論理的に明確な均線交差戦略である. EMA交差は,市場動向を捉え,単一取引モデルとパーセンテージポジション管理を組み合わせて,リスクと利益のバランスを達成している. いくつかの固有の限界があるにもかかわらず,推奨された方向の最適化によって,戦略の安定性と適応性がさらに向上することができます. 実用的には,特定の市場特性と個人のリスク好みに応じてトレーダーに相応した調整を行うことが推奨されています.
Source
Pine
/*backtest
start: 2024-02-25 00:00:00
end: 2025-02-22 08:00:00
period: 1h
basePeriod: 1h
exchanges: [{"eid":"Binance","currency":"SOL_USDT"}]
*/

//@version=6
strategy("EMA Crossover Labels (One Trade at a Time)", overlay=true, initial_capital=100000, default_qty_type=strategy.percent_of_equity, default_qty_value=10)

// ==== User Inputs ====Strategy parameters
Related strategies
Comment
All comments (0)
No data
- 1