複数移動平均トレンドモメンタムクロスオーバー取引システム

概要
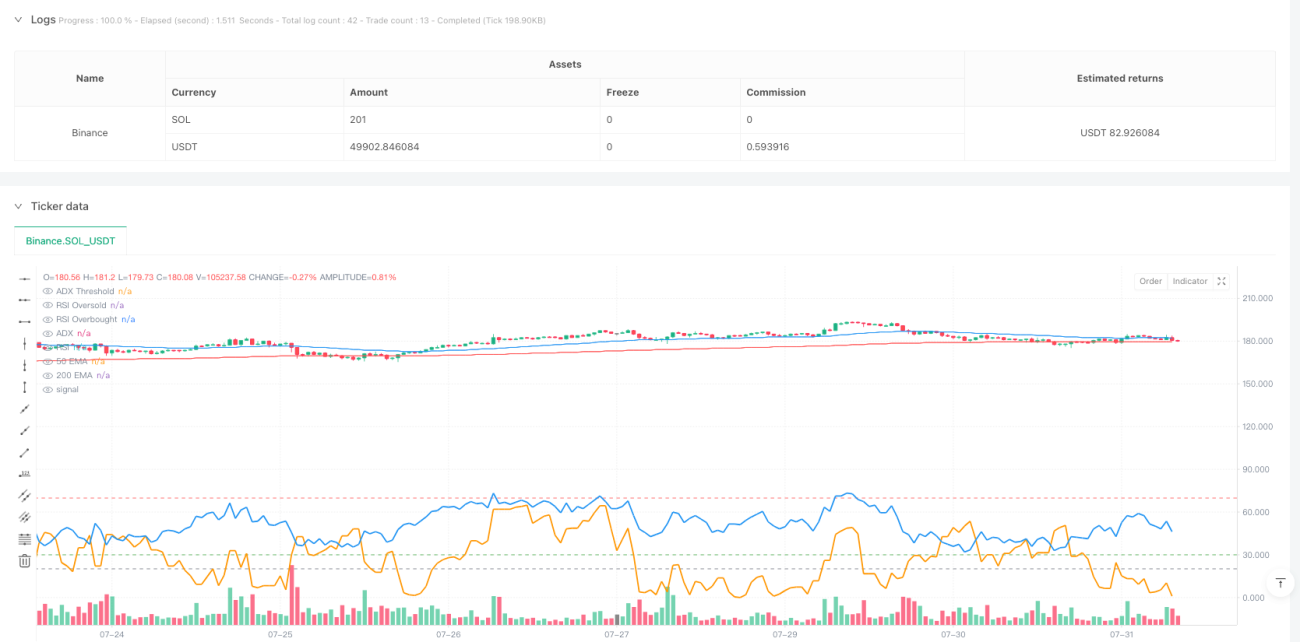
この戦略は,複数の技術指標に基づいたトレンド追跡システムで,移動平均 ((EMA),平均トレンド指標 ((ADX) と相対的に強い指標 ((RSI) の優位性を組み合わせている.50日目と200日目の指数移動平均の交差によって市場のトレンドを識別し,ADXのフィルタリングの弱いトレンドを活用し,RSIを使用して,過剰に購入または過剰に販売された地域を避けるように取引する.この戦略は,実際の波幅 ((ATR) に基づくダイナミックな止損と利益の目標を採用し,リスク制御と利益の最大化の両方を保証する.
戦略原則
戦略の中核となるロジックは、次の主要要素に基づいています。
- トレンド判断:急速EMA ((50日) とゆっくりEMA ((200日) を交差して市場トレンドの方向を決定する.50日EMAの上を200日EMAを突破すると,上昇傾向に入ることを示す.50日EMA下を200日EMAを突破すると,下降傾向に入ることを示す.
- トレンド強度確認: トレンド強さを測定するためにADX指標を使用し,ADX値が20以上である場合にのみ入場を検討し,強いトレンドでのみ取引することを保証します.
- 動力フィルタリング:RSI指数で動力フィルタリングを行い,RSIが30-70の範囲にあるときにのみポジションを開き,過剰に買いすぎたり,過剰に売りすぎたりする区域取引を避ける.
- リスク管理:ATRベースのダイナミックな止損と利益の目標を使用し,止損は2倍ATRに設定され,利益の目標は4倍ATRに設定されます.
戦略的優位性
- 多次元トレンド確認:均線交差,ADXとRSIのトリプルフィルタリングを組み合わせて,取引信号の信頼性を大幅に向上させる.
- ダイナミックなリスク管理:ATRに基づくダイナミックな止損と利益設定,市場の変動に応じて自律的に調整することができる.
- フィルタリングの弱さ:ADX指標の導入は横軸市場での頻繁な取引を効果的に回避した.
- RSIフィルタリングにより,極限地域での取引を回避できます.
戦略リスク
- トレンド反転リスク:急速な反転の状況では,均線システムの遅滞が大きな引き下がりに繋がる可能性がある.
- 市場が区間振動しているときに,頻繁に偽のブレイクシグナルが生じることがあります.
- パラメータ感性:複数の指標のパラメータ設定は,異なる市場環境で最適化する必要があります.
- スリップポイントリスク:流動性の低い市場では,実際の取引価格とシグナル価格の大きな偏差がある可能性があります.
戦略最適化の方向性
- 取引量指標の導入:取引量確認メカニズムの追加を検討し,取引量突破時にのみ取引を行う.
- オプティマイズ・ストップ・メカニズム:トレンドの進行中に既に有利な<unk>を保護するために,追跡ストップを使用することを検討することができます.
- タイムフィルターを追加: 取引時間フィルターを追加して,波動性の高い時間帯での取引を避ける.
- 市場環境の分類:異なる市場環境 ((トレンド,揺れ) に応じて動的に調整する戦略パラメータ。
要約する
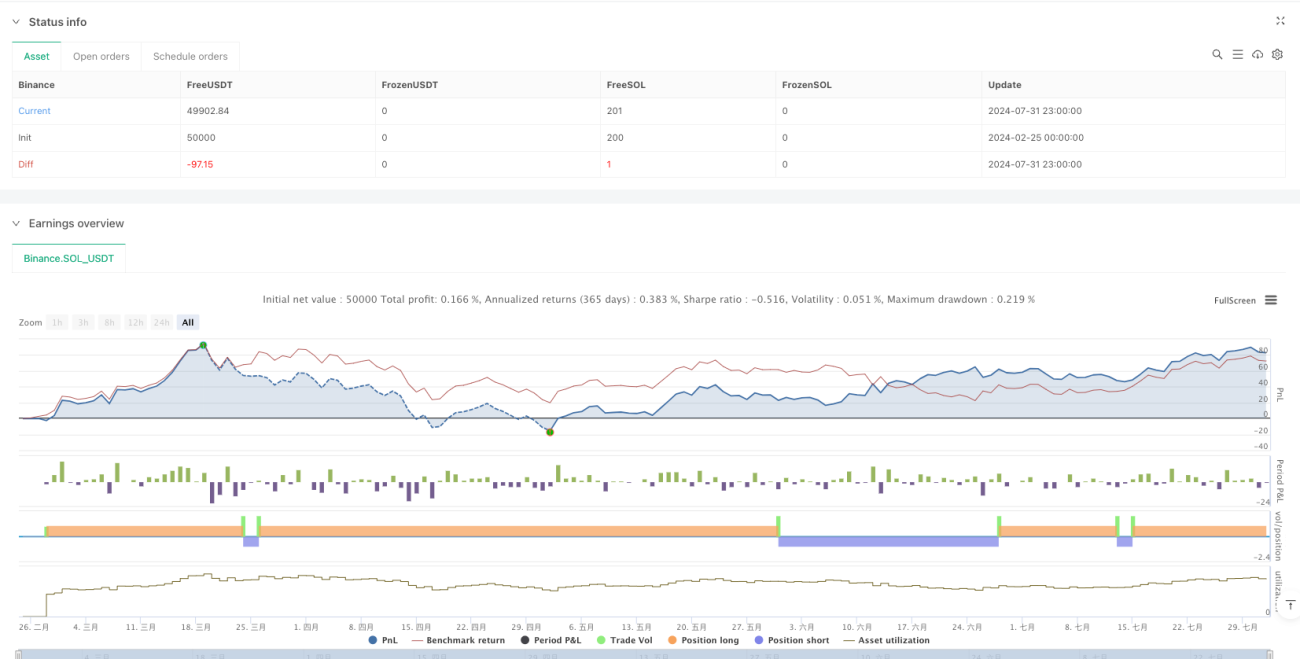
この戦略は,複数の技術指標を総合的に使用することで,トレンド追跡取引システムの完全な構築を行う.戦略の優点は,多次元的な信号確認機構とダイナミックなリスク管理システムにあるが,同時に,トレンドの逆転と揺れ動いている市場のリスクにも注意する必要がある.継続的な最適化と改善により,この戦略は,異なる市場環境で安定したパフォーマンスを維持する見込みである.
Overview
This strategy is a trend-following system based on multiple technical indicators, combining the advantages of Exponential Moving Averages (EMA), Average Directional Index (ADX), and Relative Strength Index (RSI). It identifies market trends through the crossover of 50-day and 200-day EMAs, filters weak trends using ADX, and avoids trading in overbought or oversold areas using RSI. The strategy employs dynamic stop-loss and take-profit targets based on Average True Range (ATR), ensuring both risk control and profit maximization.
Strategy Principles
The core logic of the strategy is built on the following key elements:
- Trend Identification: Uses the crossover of fast EMA (50-day) and slow EMA (200-day) to determine market trend direction. A bullish trend is signaled when the 50-day EMA crosses above the 200-day EMA, and a bearish trend when it crosses below.
- Trend Strength Confirmation: Utilizes the ADX indicator to measure trend strength, only considering entry when ADX is above 20, ensuring trades only in strong trends.
- Momentum Filtering: Applies RSI indicator for momentum filtering, only entering positions when RSI is between 30-70, avoiding trades in overbought or oversold areas.
- Risk Management: Uses ATR-based dynamic stop-loss and take-profit levels, with stop-loss set at 2x ATR and take-profit at 4x ATR.
Strategy Advantages
- Multi-dimensional Trend Confirmation: Combines EMA crossover, ADX, and RSI triple filtering to significantly improve signal reliability.
- Dynamic Risk Management: ATR-based dynamic stop-loss and take-profit settings adapt to market volatility.
- Weak Trend Filtering: Introduction of ADX effectively avoids frequent trading in ranging markets.
- Prevention of Extreme Entries: RSI filtering mechanism prevents trading in extreme areas.
Strategy Risks
- Trend Reversal Risk: The lag in moving average systems may lead to significant drawdowns in quick reversal scenarios.
- Range-bound Market Risk: May generate frequent false breakout signals during sideways markets.
- Parameter Sensitivity: Multiple indicator parameters need optimization across different market conditions.
- Slippage Risk: Actual execution prices may significantly deviate from signal prices in less liquid markets.
Strategy Optimization Directions
- Volume Indicator Integration: Consider adding volume confirmation, only trading on volume breakouts.
- Stop-loss Mechanism Enhancement: Consider implementing trailing stops to protect profits during trend development.
- Time Filter Addition: Add trading time filters to avoid high-volatility periods.
- Market Environment Classification: Dynamically adjust strategy parameters based on different market conditions (trending, ranging).
Summary
The strategy constructs a comprehensive trend-following trading system through the integrated use of multiple technical indicators. Its strengths lie in multi-dimensional signal confirmation and dynamic risk management systems, while attention must be paid to risks from trend reversals and ranging markets. Through continuous optimization and refinement, the strategy has the potential to maintain stable performance across different market environments.
- 1