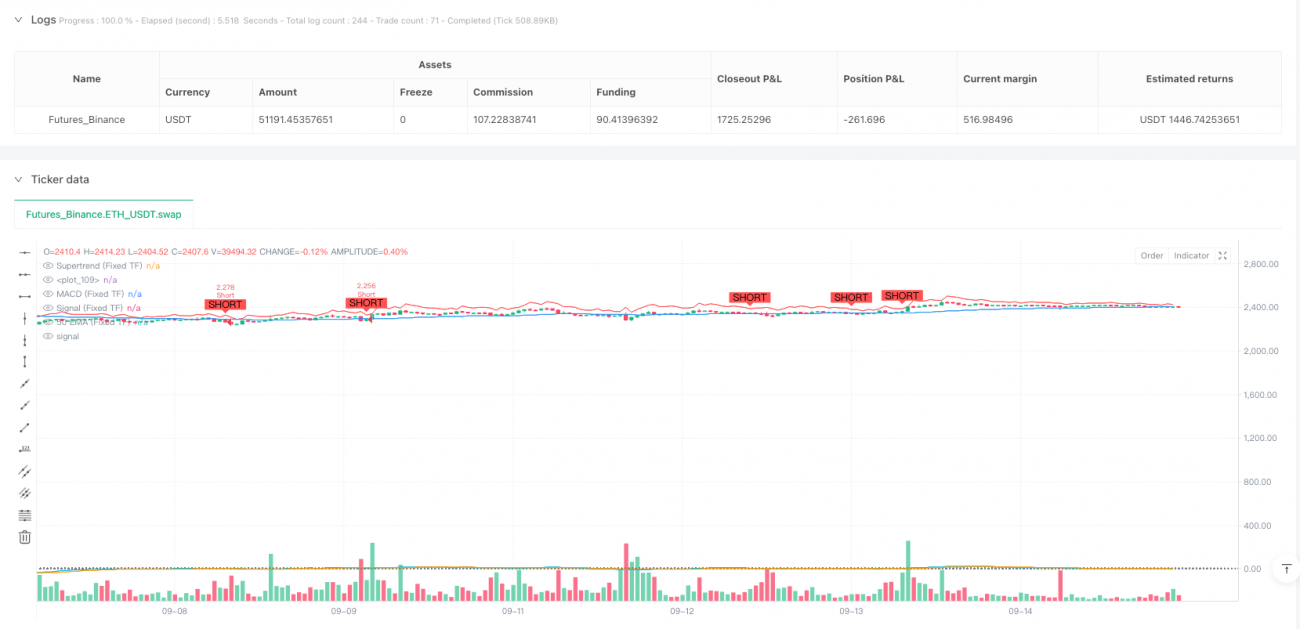
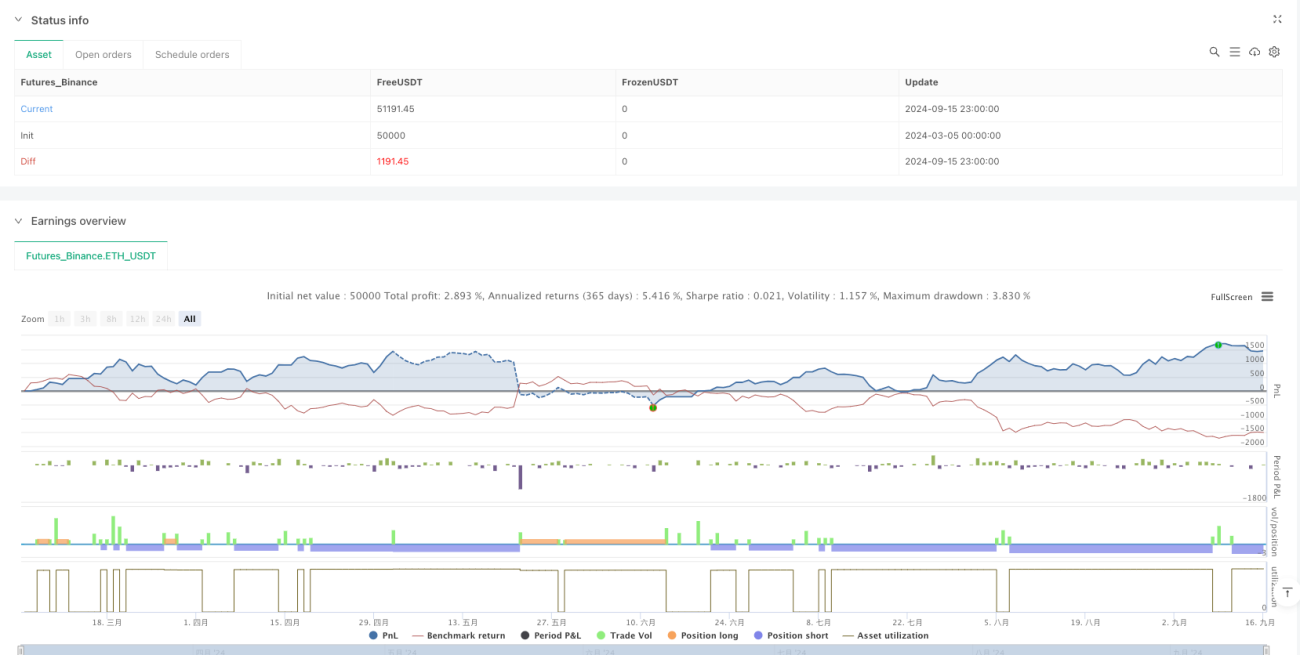
ダイナミック・ボリュレッティ・トレード法とは,高度にボリュレッティのある市場のために設計された期貨取引量化戦略であり,特に仮想通貨などの波動的な品種に適しています.この戦略は,複数の技術指標を巧みに組み合わせて,固定時間枠内で一致した取引シグナルを生成し,同時にダイナミックなリスク管理システムを持っています.この戦略の核心は,固定時間枠 (デフォルト15分) を通してEMA,MAC,DRSI,ATR,カスタム Supertrendを含むすべての重要な指標の数値を計算することであり,任意のグラフ解像度でシグナル生成の一致性を確保し,市場が急激に波動するときにリスクを低減するために極限状態モニタリングの仕組みを備えています.
ダイナミック・ボラティカル・トレーディング・メソッドは,複数の技術指標の協同効果に基づいて,TradingViewのrequest.security () 関数を使用して,固定された時間枠で重要な指標を計算します.その核心ロジックは次のとおりです.
固定時間枠の計算: すべての指標は,選択された固定時間枠 ((デフォルト15分) で計算され,取引シグナルがグラフの解像度から影響を受けないことを保証します.
多指標システム:
入学条件:
出場メカニズム:
リスク管理策略的な制限: 一方向のポジションのみを同時に保有し,資金管理の一貫性と簡潔性を確保する.
ダイナミック・ボラティブル・トレード法には以下の顕著な利点があります.
一致信号生成固定時間枠ですべての指標を計算することで,取引シグナルの安定性と一致性を確保し,異なる時間枠の切り替えによる混乱を回避します.
複数の認証メカニズム:複数の技術指標 ((EMA,MACD,RSI,Supertrend) を組み合わせて入場信号を形成し,偽信号のリスクを大幅に低減し,信号品質を向上させる.
ダイナミックなリスク管理ATRベースのストップとトラッキングストップは,市場の波動性に応じて自動的に調整され,資金を保護しながら利益の充分な成長を可能にします. このダイナミックな方法は,波動性の高い市場に特に適しています.
極端な行動保護: 価格の顕著な変動 (上昇または暴落) を監視し,極端な市場条件で自動的に平衡し,潜在的な損失を効果的に軽減することで,従来の戦略がしばしば無視する重要な安全メカニズムである.
適応性が高い戦略は,複数の時間枠で使用できます (例えば,1分,5分,15分など),信号生成の一貫性を保ち,トレーダーにより大きな柔軟性を与えます.
ダイナミック・ボラティブル・トレード法には多くの利点がありますが,以下の潜在的なリスクがあります.
過剰取引のリスク解決方法: 追加のフィルタリング条件を追加するか,信号確認時間を延長することを検討することができます.
市場における騒音感受性策略は,特に低い時間枠で,市場のノイズに敏感になり,不必要な取引を誘発する可能性があります. 解決策: 指標のパラメータをノイズの影響を減らすために調整できます. 例えば,EMAの長さを増加させたり,RSIの境界を調整したりします.
パラメータ最適化依存戦略の性能は,複数のパラメータ (EMA長さ,MACDパラメータ,ATR倍数など) の最適化に高度に依存し,異なる市場条件によって異なるパラメータ設定が必要になる可能性がある. 解決策:定期的にパラメータをリターンして調整するか,自主パラメータシステムを導入することを検討する.
極端な波動反応の遅延解決策:価格変動率に基づくより敏感なトリガーメカニズムを追加することを検討する.
単一の時間枠の限界策略は,一定時間枠で指標を計算し,一貫性を保つが,これは,より高いまたは低い時間枠で提供される重要な市場情報を無視する可能性がある. 解決策:複数の時間枠の分析コンポーネントを追加することを検討する.
戦略の深層分析から,いくつかの改善の方向が示されています.
多時間枠協同システム:現在の固定時間枠に加えて,より高い時間枠 (例えば60分または4時間) のトレンドフィルターを追加し,取引の方向がより大きなトレンドと一致することを確認します.これは,より高い時間枠が通常より安定した市場トレンドを表示し,逆転取引の可能性を減らすためです.
動態参数調整:市場の変動や他の市場指標に基づいて戦略パラメータを自動的に調整するメカニズムを実現する.この最適化は,人為の介入なしに,変化する市場条件に戦略をより良く適応させることができる.
高度なリスク管理:現在のATRに基づいて,多層のトラッキングストップまたはサポート/レジスタンスに基づくスマートストップシステムを導入する.これは,より精密にリスクを管理し,利益を保護しながら取引の完全な発展を可能にします.
感情分析の統合: 市場情緒指標の追加を検討する (取引量分析,価格変動パターンの識別など) が,入場と出場の決定に追加の次元を提供する.市場情緒はしばしば価格動向の先導的な指標であり,信号生成のタイミングを向上させることができる.
機械学習の最適化:機械学習アルゴリズムを用いてパラメータ選択とシグナルフィルタリングを最適化し,大量の歴史データ訓練モデルによって戦略性能を向上させる.機械学習は,従来の技術分析では捉えにくい複雑な市場パターンを識別することができる.
資金管理の強化: より複雑なリスク管理システムを導入し,撤回制御に基づくダイナミックなポジションサイズ調整や勝率に基づくケリー准則の最適化など. 科学的な資金管理は,戦略の長期的な収益性にとって不可欠である.
ダイナミック・ボリュレッティ・トレード法 (DVT) は,技術分析とダイナミック・リスク・マネジメントを総合的に利用する高級期貨取引戦略で,特に波動性の高い市場に適しています.この戦略は,固定された時間枠で複数の技術指標 (EMA,MACD,RSI,Supertrend) を計算することによって,一貫した,堅牢な取引信号を生成します.ダイナミック・ストップ・ローズ・システムと極端な動きのモニタリング・メカニズムは,資金の安全のために多層の保証を提供します.
戦略にはパラメータ依存性や市場ノイズ感受性などの潜在的リスクがあるが,多時間枠分析,ダイナミックパラメータ調整,高度なストップ・ロスの管理などの推奨された最適化方向によってこれらのリスクは効果的に緩和できる. 機械学習と市場情緒分析をさらに統合することで,戦略の適応性と収益性をさらに高めることができる.
ダイナミック・ボラティビリティ・トレード法は,体系的な取引方法を求めるトレーダー,特に波動的な市場に焦点を当てているトレーダーにとって,技術指標とリスク管理をバランスとした総合的なソリューションを提供し,異なる市場条件下で安定したパフォーマンスを維持する可能性を秘めています.
/*backtest
start: 2024-03-05 00:00:00
end: 2024-09-16 00:00:00
period: 1h
basePeriod: 1h
exchanges: [{"eid":"Futures_Binance","currency":"ETH_USDT"}]
*/
//@version=6
strategy("Futures Trading Expert Strategy with Extreme Move Check (Fixed TF)",
overlay=true,
initial_capital=10000,
default_qty_type=strategy.percent_of_equity,
default_qty_value=10,
calc_on_every_tick=true)
// ========== INPUTS ==========
fixedTF = input.timeframe("15", title="Fixed Timeframe for Signals")
emaLength = input.int(50, title="EMA Length", minval=1)
atrLength = input.int(14, title="ATR Length", minval=1)
atrMultiplier = input.float(3.0, title="ATR Multiplier for TP", step=0.1)
macdFast = input.int(12, title="MACD Fast Length")
macdSlow = input.int(26, title="MACD Slow Length")
macdSignal = input.int(9, title="MACD Signal Smoothing")
stATRPeriod = input.int(10, title="Supertrend ATR Period", minval=1)
stFactor = input.float(3.0, title="Supertrend Factor", step=0.1)
rsiLength = input.int(14, title="RSI Length")
rsiOverbought = input.int(70, title="RSI Overbought Level")
rsiOversold = input.int(30, title="RSI Oversold Level")
trailStopMultiplier = input.float(2.0, title="Trailing Stop ATR Multiplier", step=0.1)
extremePct = input.float(2.0, title="Extreme % Threshold", step=0.1) // e.g., 2%
// ========== FIXED TIMEFRAME INDICATOR VALUES ==========
// Fetch fixed timeframe OHLC values
ft_close = request.security(syminfo.tickerid, fixedTF, close)
ft_high = request.security(syminfo.tickerid, fixedTF, high)
ft_low = request.security(syminfo.tickerid, fixedTF, low)
// EMA calculated on fixed timeframe
emaValue = request.security(syminfo.tickerid, fixedTF, ta.ema(close, emaLength))
// MACD calculated on fixed timeframe
[macdLine, signalLine, _] = request.security(syminfo.tickerid, fixedTF, ta.macd(close, macdFast, macdSlow, macdSignal))
// RSI calculated on fixed timeframe
rsiValue = request.security(syminfo.tickerid, fixedTF, ta.rsi(close, rsiLength))
// ATR calculated on fixed timeframe
atrValue = request.security(syminfo.tickerid, fixedTF, ta.atr(atrLength))
// Supertrend Calculation Function
f_supertrend(_atrPeriod, _factor) =>
_atr = ta.atr(_atrPeriod)
_up = (high + low) / 2 - _factor * _atr
_down = (high + low) / 2 + _factor * _atr
var float _st = na
_st := na(_st) ? ((high + low) / 2) : (close[1] > _st ? math.max(_up, _st) : math.min(_down, _st))
_st
// Compute supertrend on fixed timeframe
supertrend = request.security(syminfo.tickerid, fixedTF, f_supertrend(stATRPeriod, stFactor))
trend = ft_close > supertrend ? 1 : -1
// ========== EXTREME MOVE CHECK (using fixed timeframe values) ==========
prev_ft_close = request.security(syminfo.tickerid, fixedTF, close[1])
btcMovePct = (ft_close - prev_ft_close) / prev_ft_close * 100
pump = btcMovePct > extremePct // Pump: price increased more than extremePct%
dump = btcMovePct < -extremePct // Dump: price dropped more than extremePct%
// ========== ENTRY CONDITIONS ==========
// Pre-calculate MACD crossovers on fixed timeframe values
macdLongCrossover = ta.crossover(macdLine, signalLine)
macdShortCrossunder = ta.crossunder(macdLine, signalLine)
// Long entry: fixed close > EMA, MACD cross upward, supertrend is up, RSI is not overbought
longCondition = (ft_close > emaValue) and macdLongCrossover and (trend == 1) and (rsiValue < rsiOverbought)
// Short entry: fixed close < EMA, MACD cross downward, supertrend is down, RSI is not oversold
shortCondition = (ft_close < emaValue) and macdShortCrossunder and (trend == -1) and (rsiValue > rsiOversold)
// ========== TRADE EXECUTION ==========
// Long Trades
if (longCondition and strategy.position_size <= 0)
if strategy.position_size < 0
strategy.close("Short", comment="Close Short for Long")
longTP = ft_close + atrMultiplier * atrValue
strategy.entry("Long", strategy.long, comment="Long Entry")
strategy.exit("Long Exit", from_entry="Long", limit=longTP,
trail_price=na, trail_offset=atrValue * trailStopMultiplier,
comment="Long TP & Trailing Stop")
// Short Trades
if (shortCondition and strategy.position_size >= 0)
if strategy.position_size > 0
strategy.close("Long", comment="Close Long for Short")
shortTP = ft_close - atrMultiplier * atrValue
strategy.entry("Short", strategy.short, comment="Short Entry")
strategy.exit("Short Exit", from_entry="Short", limit=shortTP,
trail_price=na, trail_offset=atrValue * trailStopMultiplier,
comment="Short TP & Trailing Stop")
// ========== EXTRA EXIT CONDITIONS BASED ON EXTREME MOVES ==========
// If BTC is pumping really hard and you're short, exit the short.
// If BTC is dumping really hard and you're long, exit the long.
if pump and strategy.position_size < 0
strategy.close("Short", comment="Close Short on BTC Pump")
if dump and strategy.position_size > 0
strategy.close("Long", comment="Close Long on BTC Dump")
// ========== PLOTTING ==========
// Plot fixed timeframe values for visual reference
plot(emaValue, color=color.blue, title="50 EMA (Fixed TF)")
plot(supertrend, color=(trend == 1 ? color.green : color.red), title="Supertrend (Fixed TF)")
plot(macdLine, title="MACD (Fixed TF)", color=color.aqua)
plot(signalLine, title="Signal (Fixed TF)", color=color.orange)
hline(0, color=color.gray, linestyle=hline.style_dotted)
// Plot entry signals
plotshape(longCondition, title="Long Signal", location=location.belowbar, color=color.green, style=shape.labelup, text="LONG")
plotshape(shortCondition, title="Short Signal", location=location.abovebar, color=color.red, style=shape.labeldown, text="SHORT")