概要
これは,複数の指標の確認に基づいた定量取引戦略であり,その核心指標は超トレンドラインである. 200日指数移動平均 (EMA) がトレンド確認として,相対的に強い指数 (RSI) が動量確認として,平均真波幅 (ATR) によるストップとストップのレベルが動的に設定されている. この戦略は,取引信号の信頼性を確保する多層のフィルタリング機構を採用し,同時に,柔軟なリスク管理システムによって資金の安全を保護する.
戦略原則
この戦略の核心となる原則は,多層の指標の協同確認によって,低品質の取引信号をフィルターし,同時にリスクを動的に管理することです.
スーパートレンドライン (SuperTrend) 信号識別:
- SuperTrend (ATRベースのトレンド追跡指標) を用いて価格突破を識別する
- 価格がスーパートレンドラインを上方突破すると,買取シグナルベースが作られます.
- 価格がスーパートレンドラインを下回る時に, 売り込みシグナルベースが作られる
トレンド確認メカニズム:
- 200日EMAで中長期トレンドの方向を確認する
- 購入条件は,価格がEMA上位で,上昇傾向に沿っていることを保証する
- 販売条件は,価格がEMA以下で下落傾向に順応することを保証するものである.
動力確認フィルター:
- RSI指標で市場の動きを検証する
- RSIが50以上で,上昇の勢いを確認する
- RSIが50未満のセールシグナルで,下落の勢いを確認する
- RSI フィルタリングを有効にする
ダイナミックなリスク管理:
- ATRの動的な設定によるストップポジション,市場の変動に自主的に適応する
- 買い取り取引のストップロスは,現在の価格 - (ATRの倍数 × ATR値) に設定されます.
- 販売のストップロスは,現在の価格+ (ATRの倍数 × ATR値)
リスク・リターン・比率の制御:
- 固定乗数関数で停止目標を設定する
- ストップレベル ストップ距離から自動的に計算され,デフォルトのリスク・リターン比は1:2
戦略的取引の論理は明確である:SuperTrendがシグナルを与え,同時にトレンド方向 ((EMA) と市場動力 ((RSIオプション) の条件を満たす場合にのみ取引を実行する. 入場後,システムは,現在の市場の変動に応じて自動的にストップ・ロズとストップ・ストップのレベルを設定し,リスク管理の有効性を保証する.
戦略的優位性
多重確認フィルタリング:
- SuperTrend,EMA,RSIの3つの指標によって確認され,偽の信号を効果的に軽減します.
- 多層のフィルタリングにより,高確率のトレンド環境でのみ取引を確実にする
- 変動する市場での損失を大幅に減らすことができる
市場変動に適応する:
- ATR ベースのストップ・ロスの設定は,異なる市場条件の変動に自動的に適応します.
- 高波動の間,自動でストップ距離を拡大し,低波動の間,自動でストップ距離を縮める
- 固定ストップによる早期出場や過度のリスクの問題を回避する
リスク管理の改善:
- 取引ごとに自動でストップとストップを設定し,手動で監視する必要はありません.
- 比例制御 (デフォルト1:2) により,良質なリスク・リターン比率を確保
- リスク管理のシステム化により 感情の干渉が減る
ポリシーのパラメータは柔軟に調整できます.:
- すべてのキーパラメータは,異なる市場と個人のリスクの好みに合わせてカスタマイズできます.
- 選択的にRSIフィルタを有効または無効にすることで,戦略の厳格性を調整できます.
- ATRの倍数と停止比率は,異なる市場特性に合わせて最適化できます.
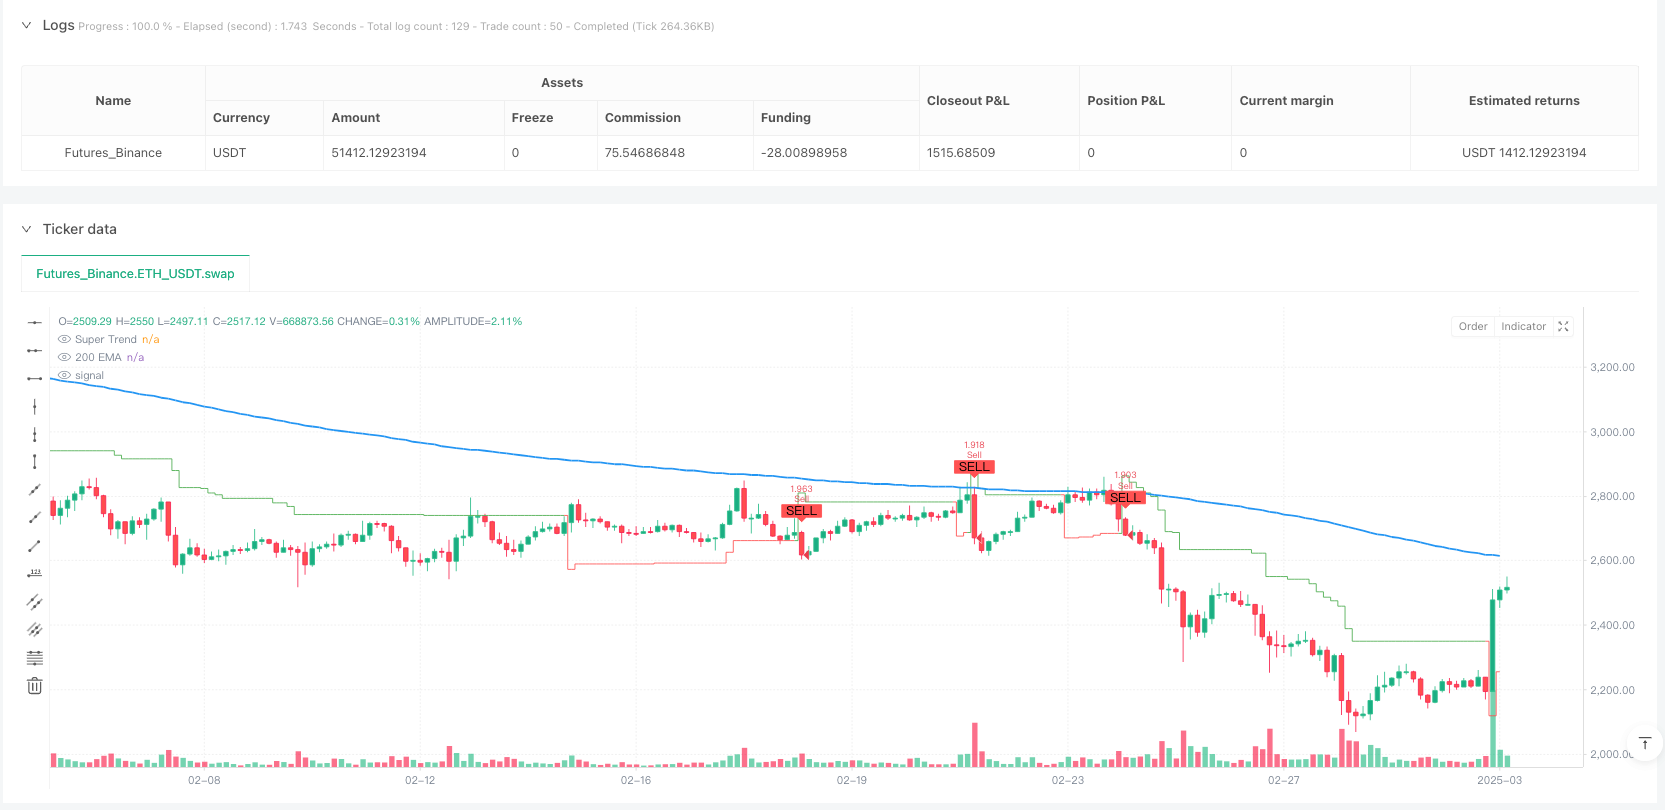
視覚的な取引信号:
- 策略は,明確なグラフィカル指標と取引シグナルマークを提供
- スーパートレンドラインの色の変化は,市場トレンドの状態を直感的に示す
- 買出信号は矢印で明確に表示され,追跡分析が容易になります.
資金管理の合理性:
- 固定契約数ではなく,デフォルトでは,取引ごとに使用口座総額の固定割合 (%)
- アカウントのサイズが変化するにつれて,ポジションのサイズを自動的に調整し,リターン効果を実現します.
- 固定電話取引による資金管理の問題を回避
戦略リスク
トレンド・ターニング・ポイントの反応遅れ:
- スーパートレンドとEMAは,トレンドの転換点に遅刻し,後退する指標です.
- 市場が急激に逆転する中で,大きな引き下げに直面する可能性がある.
- 緩和方法:短期的な動量指標または波動率の突破検出メカニズムを追加することを考慮する
横盤の振動は不良:
- 策略はトレンドフォローの理念に基づいて設計されており,明確なトレンドがない横軸市場では頻繁に出入りすることがあります.
- 市場が揺れ動いてしまうと 連続して損なわれる可能性があります.
- 緩和策:トレンドの強さを増やしてフィルターするか,揺れのある市場を認識すると取引を一時停止する.
固定RSIの限界値:
- 固定RSIの値を使用する ((50) は,すべての市場環境に適用されない場合があります.
- RSIは長期にわたり,特定の偏向市場では高値または低値で維持されます.
- 緩和策: 絶対値ではなく,自律的なRSI値またはRSI変動率を使用することを検討する
リスクの設定:
- ATRベースのダイナミック・ストップは優れているものの,極端な波動的な市場では過度に幅広く設定される可能性があります.
- ブラック・スウィーン事件は,停止値を直ぐに突破する可能性がある.
- 緩和方法:最大止損制限を増やしたり,波動率異常検出メカニズムを設定したり
リスクの過剰最適化:
- 策略には複数の可調パラメータがあり,過去データに過度に適合するリスクがあります.
- 最適化されたパラメータの組み合わせは,将来の市場には適さない可能性があります.
- 緩和方法:ステップ・フォワード・テストまたはパラメータの安定性を分段的に検証する
資金管理に関する考察:
- デフォルトのアカウントの10%の割合は,場合によってはリスクが高い可能性があります.
- 継続的な損失は資金に大きな影響を与える可能性があります
- 緩和策: 戦略的な評価と個人のリスク承受能力によるポジション比率の調整
戦略最適化の方向性
市場環境への適応力を高めること:
- 市場タイプ識別機能を開発し,トレンド市場と震動市場を区別する
- 異なる市場環境における取引パラメータの動的調整
- 理由: 多様な市場条件における戦略の適応性を向上させ,波動的な市場における偽信号を減少させる
動態参数調整を導入する:
- 市場変動に応じて自動調整されるSuperTrend因子
- 高波動市場での増加因数,低波動市場の減少因数
- 理由:パラメータ固定による制限を回避し,市場の変化に対する戦略の反応力を向上させる
RSIの最適化方法について:
- RSIの固定値を動的値またはトレンドラインの突破値に置き換える
- RSIから離れるシグナルを補助指標として考慮する
- 理由:RSI指標の有効性を高め,戦略の安定性を高める
リスク管理システムの改善:
- 最大受容回帰制御を増加させる
- ポジションの動的調整を波動率に基づいて実現する
- 複合のストップ戦略 ((追跡ストップ+固定ストップ) を導入
- 理由: 多層のリスク管理により,資金の保護と長期的な生存能力の向上
タイムフィルタリングの追加:
- 低流動性の時期を避けるために取引時間ウィンドウの制限を追加する
- 日中の波動パターンの分析
- 理由:不利な取引時にシグナルを発生させないようにし,実行の質を向上させ,滑り点を減らす
信号品質の評価を強化する:
- 複数の指標を統合した信号強度評価システムの開発
- 信号の質に基づいてポジションサイズを動的に調整する
- 理由:高品質と低品質の信号を区別し,資金配置の効率性を向上させる
機械学習機能を追加する:
- 機械学習によるパラメータ群の最適化
- ニューラルネットワークによる予測信号の信頼性
- 理由:現代のアルゴリズムは,従来の技術指標では捉えられない市場の法則を掘り下げることができます.
要約する
多指数トレンド確認ダイナミックストップ・ストップ・ローズ取引戦略は,構造が整っていて,論理が明確である量化取引システムである.それはSuperTrend,EMA,RSIの三重指数によって確認され,信頼性の高い取引信号を形成し,ATRベースのダイナミックリスク管理機構を使用して,各取引のリスクを制御する.
この戦略の核心的な利点は,偽信号を減らすための多層のフィルタリング機構,異なる市場の変動状況に対応する自己適応の止損設定,資金の安全を保証する完善したリスク管理システムである.戦略のパラメータは柔軟に設計され,使用者は異なる市場特性と個人リスクの好みに合わせてカスタマイズすることができます.
しかし,戦略にはトレンド転換点反応遅延,横軸振動市場の不良なパフォーマンスなどの固有のリスクもあります.将来の最適化方向は,市場環境識別機能を追加し,パラメータの動態調整を実現し,RSIの適用方法を完善し,リスク管理システムを強化し,信号品質評価機構を増加させることを考慮することができます.
全体として,これは,信号の質とリスクのコントロールをバランスとした総合的な戦略システムであり,傾向を追跡するトレーダーに適しています.継続的な最適化と改善により,この戦略は,長期的に安定して収益性の高い取引システムになる可能性があります.
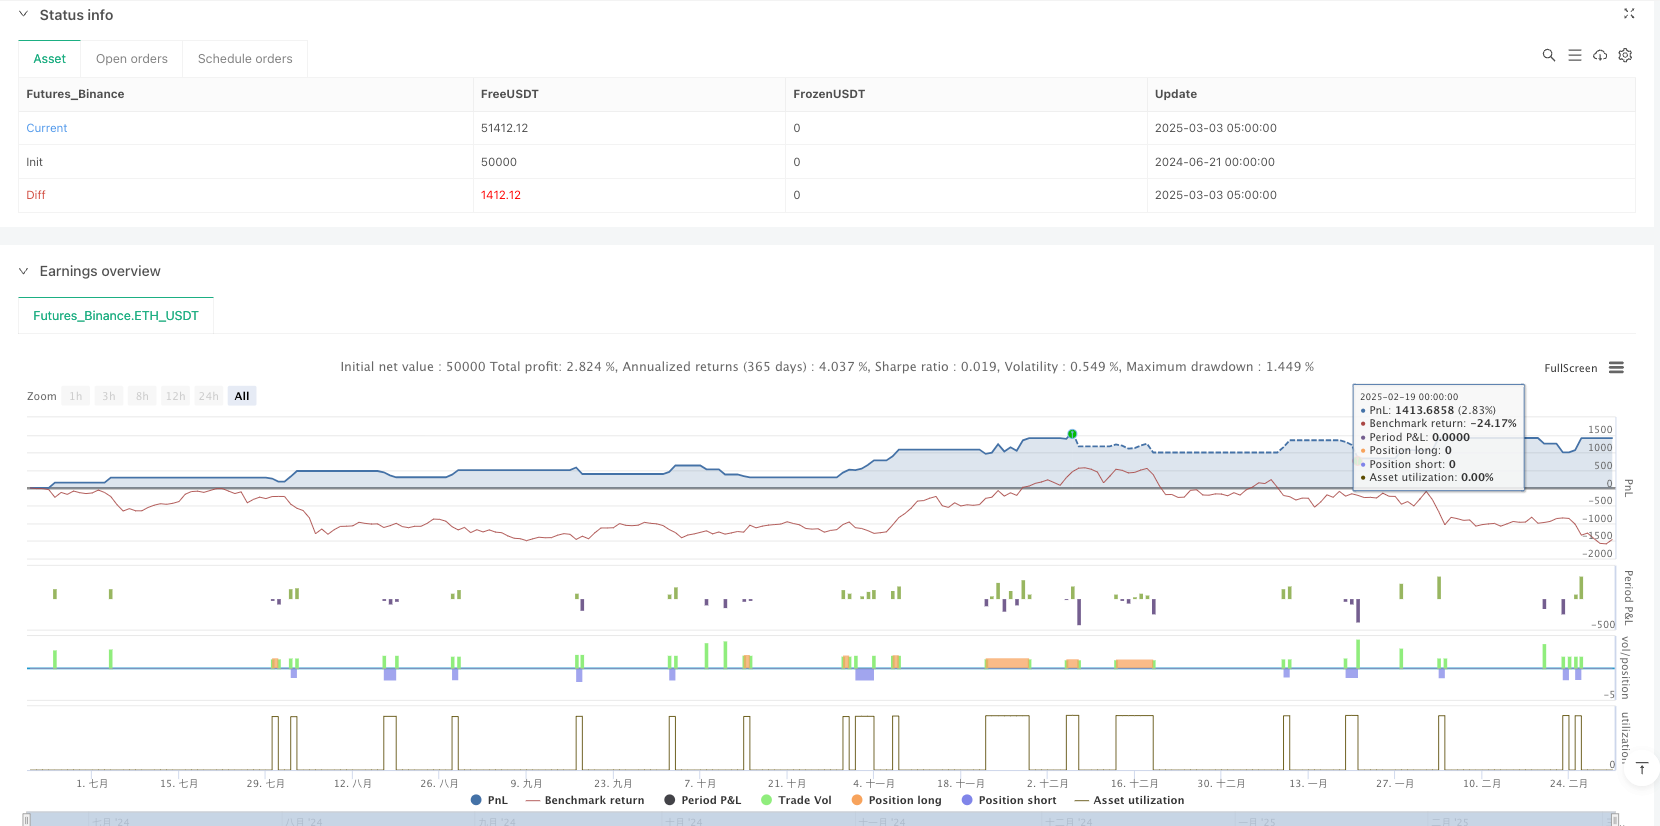
/*backtest
start: 2024-06-21 00:00:00
end: 2025-03-03 08:00:00
period: 3h
basePeriod: 3h
exchanges: [{"eid":"Futures_Binance","currency":"ETH_USDT"}]
*/

//@version=6
strategy("Super Trend with EMA, RSI & Signals", overlay=true, default_qty_type=strategy.percent_of_equity, default_qty_value=10)

// Super Trend Indicator
atrLength = input.int(10, title="ATR Length")
factor = input.float(3.0, title="Super Trend Multiplier")
[st, direction] = ta.supertrend(factor, atrLength)

// 200 EMA for Trend Confirmation
emaLength = input.int(200, title="EMA Length")
ema200 = ta.ema(close, emaLength)

// RSI for Momentum Confirmation
rsiLength = input.int(14, title="RSI Length")
rsi = ta.rsi(close, rsiLength)
useRSIFilter = input.bool(true, title="Use RSI Filter?")
rsiThreshold = 50

// Buy & Sell Conditions
buyCondition = ta.crossover(close, st) and close > ema200 and (not useRSIFilter or rsi > rsiThreshold)
sellCondition = ta.crossunder(close, st) and close < ema200 and (not useRSIFilter or rsi < rsiThreshold)

// Stop Loss & Take Profit (Based on ATR)
atrMultiplier = input.float(1.5, title="ATR Stop Loss Multiplier")
atrValue = ta.atr(atrLength)
stopLossBuy = close - (atrMultiplier * atrValue)
stopLossSell = close + (atrMultiplier * atrValue)
takeProfitMultiplier = input.float(2.0, title="Take Profit Multiplier")
takeProfitBuy = close + (takeProfitMultiplier * (close - stopLossBuy))
takeProfitSell = close - (takeProfitMultiplier * (stopLossSell - close))

// Execute Trades
if buyCondition
    strategy.entry("Buy", strategy.long)
    strategy.exit("Take Profit Buy", from_entry="Buy", limit=takeProfitBuy, stop=stopLossBuy)

if sellCondition
    strategy.entry("Sell", strategy.short)
    strategy.exit("Take Profit Sell", from_entry="Sell", limit=takeProfitSell, stop=stopLossSell)

// Plot Indicators
plot(ema200, title="200 EMA", color=color.blue, linewidth=2)
plot(st, title="Super Trend", color=(direction == 1 ? color.green : color.red), style=plot.style_stepline)

// Plot Buy & Sell Signals as Arrows
plotshape(series=buyCondition, location=location.belowbar, color=color.green, style=shape.labelup, title="Buy Signal", text="BUY")
plotshape(series=sellCondition, location=location.abovebar, color=color.red, style=shape.labeldown, title="Sell Signal", text="SELL")