
戦略概要
この量化取引戦略は,比較的強い指数 (RSI) と指数移動平均 (EMA) の優位性を巧妙に組み合わせ,フィルタリング機構として複数の時間枠分析を導入している.この戦略の核心設計は,日線と周りのRSI指標の協同確認を中心に設計されており,EMAを通じてトレンドの転換点を横断して,継続的な動力を持つ量取引機会を特定することを目的としている.この戦略は,自主的な出入場論理を採用し,複数の技術指標の交差検証を利用し,取引信号の信頼性を効果的に向上させる.
戦略原則
戦略は以下のコア原則に基づいています.
-
多時間枠 RSI フィルター:
- 日線RSIが主要な信号生成源として
- 周回RSIは,トレンド確認フィルターとして,取引方向がより大きな周期的なトレンドと一致することを保証します.
- 購入条件は,周線RSI>55と,日線RSI>55を要求します.
- 販売条件は,周線RSI<45と,日線RSI<45を要求します.
-
EMAクロスシステム:
- 13周期と21周期のEMA交差を主要入場信号として使用
- サイクル34とサイクル55のEMAは,サポート/レジスタンス位と出場参照を提供します.
- 急速EMA ((13サイクル) 上を通過 遅いEMA ((21サイクル) に買い信号を触発
- 速速EMAの下を通過し,遅速EMAをトリガーし,信号を売り出す
-
信号確認メカニズム:
- EMAクロスシグナルが2つの時間フレームのRSI方向に一致している場合にのみ取引を行う
- request.security関数で異なる時間枠のデータ統合を実現する
- 複数の条件の<unk>りにより,偽信号や揺動の状況下での頻繁な取引を減らす
-
精密な出場戦略:
- 多頭出場条件は,EMA1を下回ってEMA3を突破するか,価格がEMA4を下回る.
- 空頭出場条件は,EMA1でEMA3を着用するか,価格がEMA4を突破する
- 平仓の論理は,開設条件とは独立し,リスク管理に重点を置く.
戦略的優位性
この戦略は,コードを深く分析することで,以下の顕著な利点があることが明らかになった.
-
多層の信号フィルタリングシステム:
- 短期と長期のRSIを統合し,偽突破のリスクを軽減します.
- 複数のEMAを組み合わせて,ダイナミックなサポート抵抗領域を形成し,信号の質を向上させる
- 多重認証メカニズムにより"揺れ動いている市場"での無効取引が大幅に減少
-
適応力のあるトレンドを認識する:
- トレンドが成熟した後に介入するよりも トレンドの初期に介入する能力
- 主なトレンドの方向に反する取引を回避するために,周回RSIの高度なフィルタリング
- EMAクロスシステムは,市場のノイズを自然にフィルタリングする
-
優れたリスク管理システム:
- 感情的なポジションを避けるために,明快な出場条件を設計する
- 逆転信号の発生時に自動平仓,撤回を効果的に制御する
- 資金効率を向上させるため,平仓後の逆転ポジションの設計
-
高度なカスタマイズ性:
- すべてのキーパラメータは,input関数によって調整できます.
- RSIの<unk>値とEMAの長さを個別的に調整し,異なる市場状況に対応します.
- 異なる品種の特性により,シグナルセンシビリティをカスタマイズできます
戦略リスク
この戦略は合理的に設計されていますが,以下の潜在的なリスクと限界があります.
-
パラメータ感度:
- RSIとEMAのパラメータの選択は,戦略のパフォーマンスに顕著な影響を及ぼします.
- 過剰な敏感なパラメータが過剰な取引につながる可能性があります.
- 解決方法: 過去データに基づくパラメータの最適化と再測量を行い,過度に適合しないようにする.
-
区間震動の市場での不況:
- 横軸市場では,明らかにトレンドがない場合,頻繁に偽信号が生じることがあります.
- EMAの交差策は,揺れ動いている市場における自然な弱さ
- 解決方法:波動率フィルターまたはトレンド強度指標を追加し,トレンド強度が低い環境で自動的に保有比率を下げる
-
遅滞の問題:
- EMAとRSIは遅れている指標で,急激な波動のある市場では反応が遅れる可能性があります.
- 信号確認の過程で最適なエントリーポイントを逃した可能性がある
- 解決策: 取引量や価格の形状の認識のような先見性指標を導入することを検討する
-
信号が少ない:
- 複数の条件のフィルタリングにより,取引信号が少なくなる可能性があります.
- 低波動率の環境では長期にわたって取引の機会がない可能性
- 解決策:補助取引信号の追加または適切な条件の緩和を考慮する
戦略最適化の方向性
コード解析を基に,この戦略の最適化方向は以下の通りです.
-
適応パラメータシステム:
- RSIの<unk>値とEMA周期の動的調整を実現し,市場の変動率に基づいて自動最適化
- ATR (平均リアル波幅) を加え,市場の変動に応じてストップポジションを調整します.
- 市場状態の分類を導入し,トレンド市場と振動市場で異なるパラメータ設定を使用
-
信号の質を向上させる:
- 交付量確認の仕組みを統合し,信号が出た時に交付量を増やすように要求する
- 閉盤価格の安定状態のEMAを要求するなど,偽の突破に対する価格行動のフィルターに追加
- ADXのようなトレンド強度指標を導入し,強度のトレンド環境でのみ完全なポジション取引を行う
-
資金管理の改善:
- 波動率に基づくダイナミックなポジション管理を実現し,波動性の高い環境で自動的にポジションを減退します.
- ピラミッド式加仓策を導入し,トレンドが確認された後に順次加仓
- リスク・リターン・比率に基づくインテリジェント・ストップ・ストップ・システムの設計
-
多市場適応性:
- 商品特性の分析を追加し,異なるカテゴリーの品種に対して自動調整する戦略パラメータ
- 市場関連性分析を実現し,過度のリスク集中を避ける
- 日間および長期周期のシグナル協同機構を追加し,多層の取引システムを形成
要約する
多時間枠RSIとEMAの交差量動力の策略は,異なる時間周期のRSI指標と多重EMAを統合することによって三次元信号生成およびフィルタリング機構を構築する巧妙に設計された量化取引システムである.この策略の核心的な優位性は,多層の確認システムであり,トレンドの転換点を効果的に捕捉し,また,揺れ動いている市場で頻繁に取引を避ける.
戦略のリスクは,パラメータの感受性や波動的な市場のパフォーマンスに主に集中しているが,適応パラメータシステムと強化された市場状態識別メカニズムを導入することにより,これらのリスクを効果的に緩和することができる.将来の最適化の方向は,信号品質の向上,ダイナミックパラメータの調整,スマートキャピタルマネジメントの周りに展開され,異なる市場環境下での戦略の強<unk>性と安定性を向上させるべきである.
全体的に見ると,この戦略は論理的に明確であり,合理的に設計されており,実用的な価値を持つ量化取引システムである.細かい調整と継続的な最適化により,適応性があり,リスクが制御可能な長期取引プログラムに発展することができる.
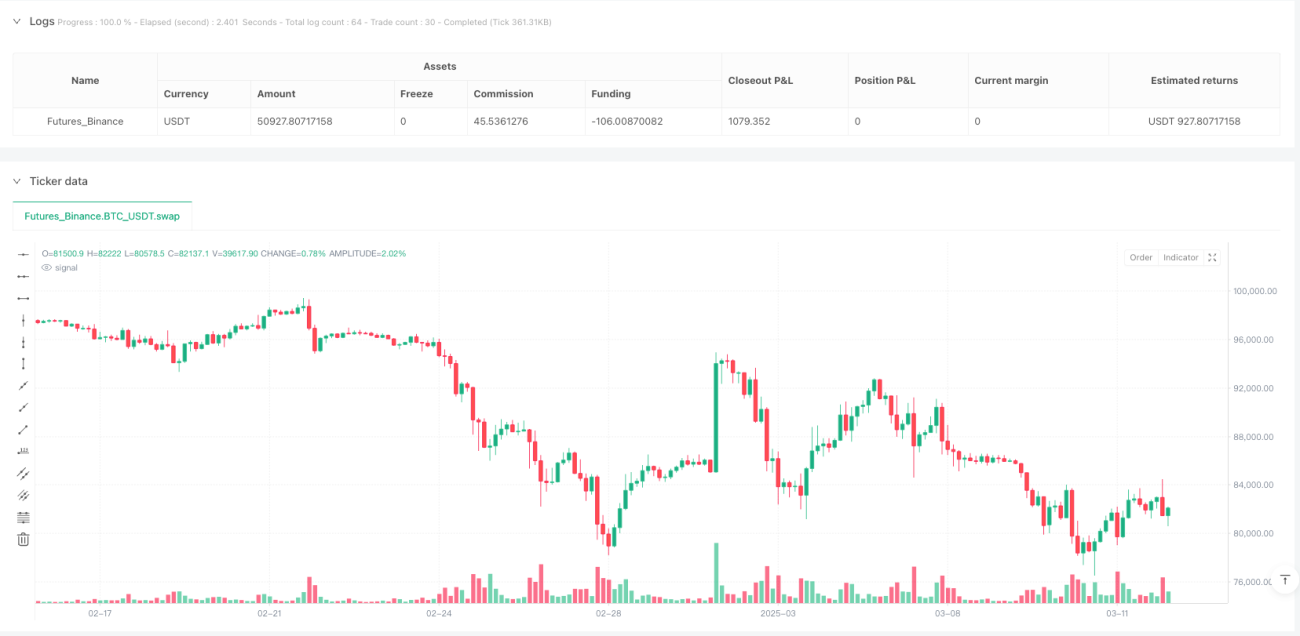
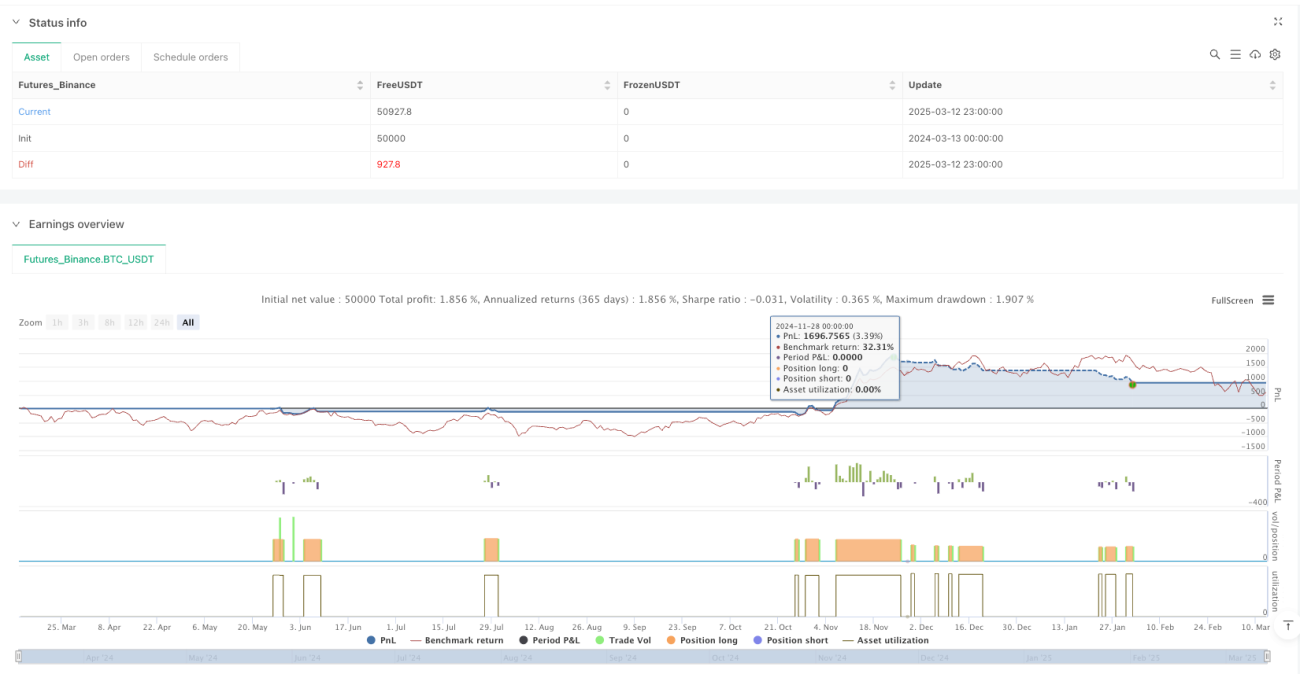
/*backtest
start: 2024-03-13 00:00:00
end: 2025-03-13 00:00:00
period: 3h
basePeriod: 3h
exchanges: [{"eid":"Futures_Binance","currency":"BTC_USDT"}]
*/

//@version=6
strategy("RSI & EMA Crossover Strategy with Daily & Weekly RSI Filter", overlay=true, default_qty_type=strategy.percent_of_equity, default_qty_value=10)

// === INPUTS ===- 1