
概要
相似矩形高さパターン戦略は、価格変動の特徴に基づく取引システムです。この戦略は、市場において類似した高さを持つ矩形パターンを識別することで、潜在的な取引機会を捉えます。戦略の核心は、価格変動幅が似通ったパターンを発見し、RSI指標、出来高確認、および動的に調整されるストップロス・テイクプロフィットラインを組み合わせてリスク管理と取引結果の最適化を図ることです。本戦略は様々な取引銘柄に適用可能で、価格の高さ比率を正確に計算することで、トレンド反転や継続の可能性があるシグナルを体系的に識別する手法をトレーダーに提供します。
戦略の原理
本戦略の核心原理は、価格形状の幾何学的特性分析に基づいており、主に以下のポイントで展開されます。
-
高さパターンの識別:主に2種類の高さパターンに注目します – 主要高さ(ユーザーが定義する価格パーセンテージ)と調整高さ(同様にユーザーが定義するより小さなパーセンテージ)。システムはこれらの高さ値を動的に計算し、異なる市場状況に適応します。
-
複数パターンの検出:
- 強気パターン:底値形成後に特定の高さの上昇が発生する形状を識別
- 弱気パターン:天井形成後に特定の高さの下落が発生する形状を識別
- 強気調整:上昇トレンド中に特定の幅の調整を識別
- 弱気調整:下降トレンド中に特定の幅のリバウンドを識別
-
パラメータ最適化:
- ルックバック期間(lookbackPeriod):分析する過去データの範囲を決定
- パターン幅制限:最小および最大幅パラメータで形状の時間的幅を制御
- 高さ一致許容差:実際の高さと理想の高さの間に20%のずれを許容し、パターン認識の柔軟性を向上
-
テクニカル指標フィルター:
- RSI指標:オプションでRSIの買われすぎ/売られすぎレベルを使用して取引シグナルをフィルタリング
- 出来高確認:オプションで取引シグナルが平均以上の出来高がある場合のみ有効とする
-
エントリー・エグジット戦略:
- エントリーシグナル:強気パターンまたは強気調整を検出したら買い、弱気パターンまたは弱気調整を検出したら売り
- エグジット戦略:調整高さをストップロスに、主要高さをテイクプロフィットに使用し、リスクリワード比が明確な取引システムを構築
戦略の利点
コード実装を詳細に分析すると、本戦略は以下の顕著な利点を示します。
-
客観的なシグナル生成メカニズム:数学的計算と明確に定義された幾何学的関係に基づいており、主観的判断の影響を低減し、取引判断をより体系的かつ一貫性のあるものにします。
-
市場状況への適応力:平均価格のパーセンテージで高さパラメータを計算することで、異なる価格帯や変動性の市場環境に自動的に適応できます。
-
多次元の確認メカニズム:形状認識、RSI指標、出来高分析を組み合わせることで、多層的なシグナル確認を提供し、質の低い取引シグナルをフィルタリングするのに役立ちます。
-
明確なリスク管理フレームワーク:各取引には事前に定義されたストップロスとテイクプロフィット位置があり、トレーダーがリスクをコントロールし、一貫したリスクリワード比を維持するのに役立ちます。
-
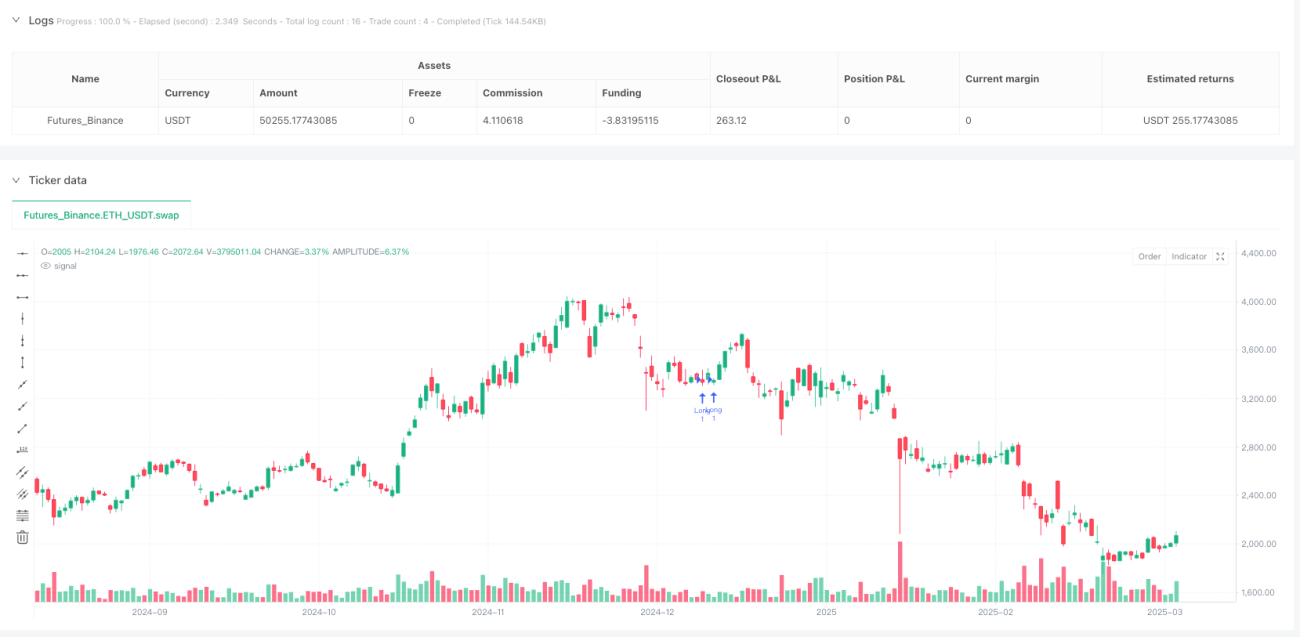
視覚的補助:チャート上に矩形やラベルを描画することで、識別された取引パターンを直感的に表示し、トレーダーがシグナルを理解・検証しやすくなります。
-
パラメータ化設計:調整可能な複数のパラメータを提供し、特定の市場状況や個人のリスク選好に応じて最適化することができます。
-
複数パターン認識:主要トレンドの形成を認識するだけでなく、トレンド中の調整機会も捉え、より多くのエントリーポイントを提供します。
戦略のリスク
本戦略には多くの利点がある一方で、以下の潜在的なリスクも存在します。
-
パラメータへの敏感さ:戦略のパフォーマンスはパラメータ設定に大きく依存し、不適切なパラメータは過剰取引や重要なシグナルの見逃しにつながる可能性があります。解決策としては、過去のバックテストを通じて最適なパラメータの組み合わせを見つけ、定期的にパラメータの有効性を再評価することです。
-
偽ブレイクアウトのリスク:市場が期待されるパターンと類似した形状を形成した後、反転して誤ったシグナルを生じる可能性があります。終値の確認を待つなど確認メカニズムを追加したり、他の指標とクロス検証することを推奨します。
-
固定パーセンテージの限界:固定パーセンテージで高さを計算する方式は、変動性が急激に変化する市場には適さない可能性があります。ATRや過去の変動性に基づく動的な高さ計算方法を導入することを検討してもよいでしょう。
-
計算負荷の高さ:本戦略は多重ループや条件判定を含み、大量のデータを処理する際にパフォーマンス問題を引き起こす可能性があります。コード構造の最適化や一部の計算ステップの簡略化により実行効率を改善できます。
-
トレンド判断の単純化:現在のトレンド判断は移動平均線の単純比較に基づいており、複雑な市場構造を正確に捉えきれない可能性があります。より高度なトレンド認識アルゴリズムを統合することで精度を高めることができます。
-
ストップロス・テイクプロフィットの静的設定:調整高さと主要高さを固定でストップロス・テイクプロフィットとして使用するのは柔軟性に欠ける場合があります。市場の変動性やサポート・レジスタンスラインに基づく動的なストップロス・テイクプロフィットメカニズムを導入することが考えられます。
戦略の最適化方向
コード分析に基づき、本戦略の最適化方向としては以下が考えられます。
-
動的パラメータ調整:適応型パラメータメカニズムを導入し、市場の変動性や取引サイクルに応じて高さパーセンテージやパターン幅パラメータを自動調整します。これにより、異なる市場フェーズの特性に適応しやすくなります。
-
トレンド確認の強化:マルチサイクルトレンド分析、ボリンジャーバンド幅の変化、方向性移動指数(DMI)など、より高度なトレンド識別手法を統合し、トレンド判断の精度を向上させます。
-
シグナルフィルターの最適化:価格と移動平均線の位置関係、マルチサイクルRSIの一致分析、出来高分布特性などの追加フィルター条件を導入し、偽シグナルを減少させます。
-
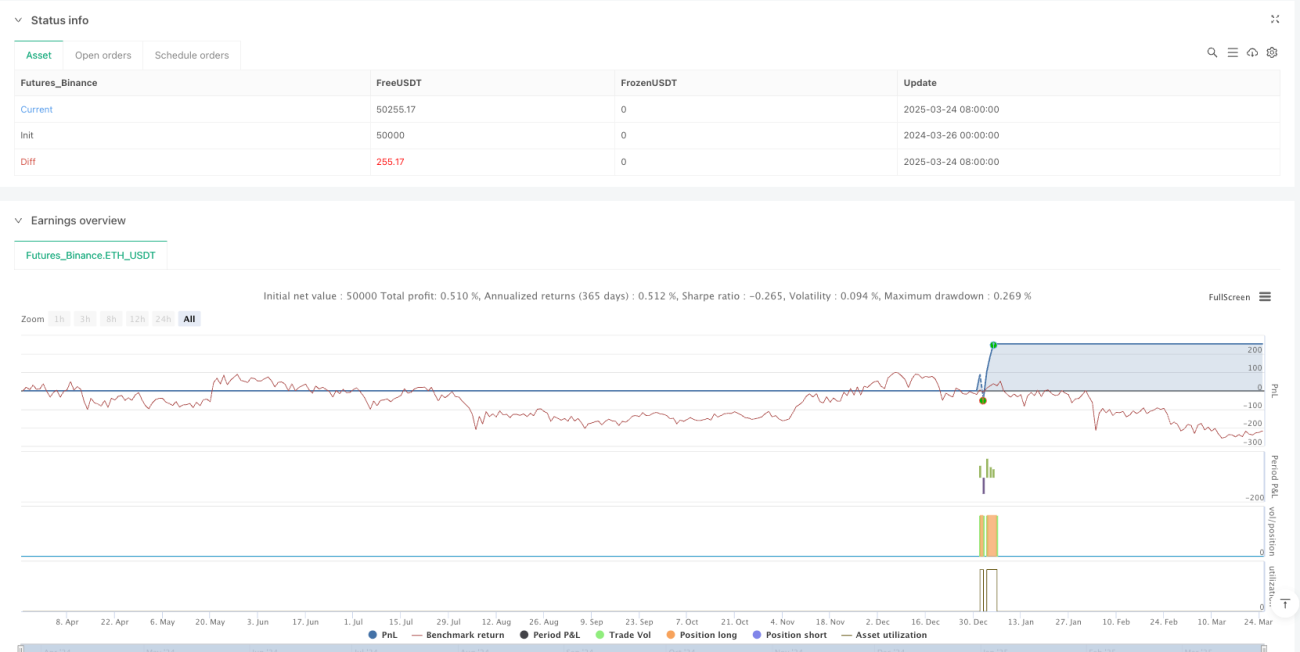
バックテスト評価の改善:最大ドローダウン、シャープレシオ、プロフィットファクターなど、より包括的な戦略評価指標を追加し、戦略パフォーマンスを総合的に評価してパラメータ最適化を導きます。
-
適応型ストップロスメカニズム:ATRや直近の変動性に基づいてストップロス水準を動的に調整し、固定の調整高さに依存するのではなく、リスク管理の有効性を高めます。
-
市場環境分析の統合:市場環境分類機能を追加し、高変動性・低変動性・強いトレンド・レンジ相場など異なる市場状態で異なるパラメータ設定や取引ロジックを採用します。
-
実行効率の最適化:パターン認識アルゴリズムを再構築し、ネストされたループや重複計算を削減することで、リアルタイム環境での実行速度を向上させます。
-
時間フィルターの追加:市場の寄付き・引けや重要なニュース発表など変動が激しい時間帯を避けるための時間ベースのフィルター条件を追加し、シグナル品質を高めます。
まとめ
相似矩形高さパターン戦略は、独自のテクニカル分析手法であり、価格変動の幾何学的特性を精密に定義・識別することで取引機会を捉えます。その核心的な革新は、抽象的なチャートパターンを定量化可能な数学的関係に変換し、テクニカル指標による多重確認と組み合わせた点にあります。本戦略は、エントリーシグナル生成、リスク管理、グラフィカル表示を含む完全な取引フレームワークを提供し、体系的な取引手法を求めるトレーダーに適しています。
この戦略は市場を分析する独自の視点を提供しますが、その効果はパラメータ最適化と市場適応性に大きく依存します。シグナルフィルタリングメカニズムの継続的改善、トレンド判断の精度向上、リスク管理手法の最適化を通じて、この戦略はトレーダーのツールボックスにおいて有効なツールとなる可能性があります。最も重要なことは、トレーダーは実際の取引に適用する前に十分な過去のバックテストとシミュレーション取引を行い、戦略が自身の取引スタイルとリスク許容度に適合していることを確認すべきです。
- 1