ヴィシャル適応型マルチインジケーター取引戦略

MACD SAR ST EMA ATR TF
作成日: 2025-03-28 17:17:56 最終変更日: 2025-03-28 17:17:56
コピー: 0 クリック数: 407
2
フォロー
319
フォロワー

ヴィシャル適応型マルチインジケーター取引戦略 ヴィシャル適応型マルチインジケーター取引戦略

概要

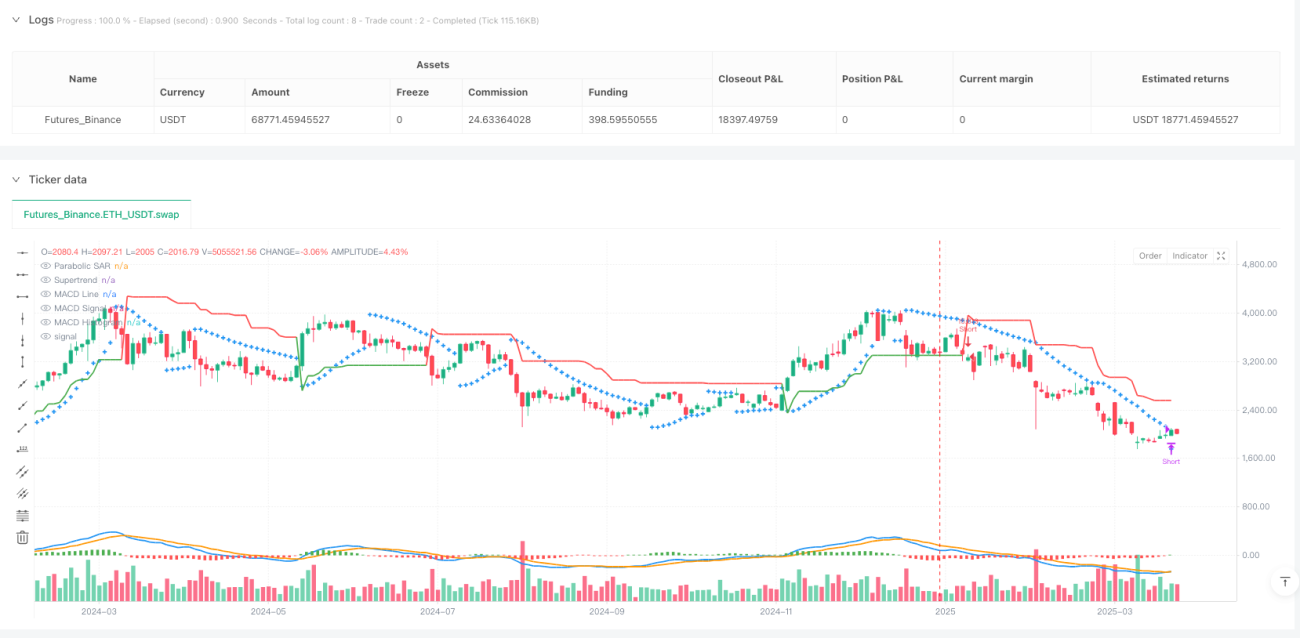
この戦略は,複数の技術指標 (MACD,Supertrend,Parabolic SAR) を統合して市場動向と取引信号を識別する総合的な量化取引方法である.この戦略は,異なる市場環境に対応できる柔軟で厳格な取引意思決定の枠組みを提供することを目的としている.

戦略原則

戦略は3つの重要な技術指標の動的組み合わせに基づいています.

  1. MACD指数:価格の動きとトレンドの方向を評価する
  2. スーパートレンド指数:市場の支配的なトレンドを判断する
  3. パラボリックSAR:正確な出入り信号を提供する

戦略は,次の論理で取引決定を行います.

  • 長期投資への入場条件:
    • MACD線は信号線よりも高い
    • スーパートレンドは緑色で表示される (多頭)
    • パラボリックSARより高い閉店価格
  • 空き倉庫への入場条件:
    • MACD線は信号線より低い
    • スーパートレンドは赤で表示される (空白)
    • パラボリックSARより低い閉店価格

戦略的優位性

  1. 多指標総合検証:偽信号のリスクを低減する
  2. フレキシブルなシグナルトリガ:指数トリガの順序を厳格に要求しない
  3. 全ストック取引戦略:取引ごとに潜在的利益を最大化する
  4. 対称的な取引論理:多頭と空頭市場で一致する
  5. ダイナミックな出場メカニズム:連続した2つのKラインで確認し,早退を避ける

戦略リスク

  1. 遅滞の危険性:技術指標は過去データに基づいているため,遅延の可能性
  2. 全ポジション取引のリスク:未設定のストップ・ロスは大きな資金波動を引き起こす可能性があります.
  3. 市場変動の危険性:複雑な市場環境が戦略のパフォーマンスを影響する可能性がある
  4. パラメータ感性:指標パラメータの選択は,戦略の効果に直接影響する

戦略最適化の方向性

  1. ダイナミックなポジション管理の導入:市場の変動に応じてポジションのサイズを調整する
  2. ストップ・ローズを増やす: 単一取引の最大損失を減らす
  3. オプティマイズ指標パラメータ:反測により最適なパラメータの組み合わせを見つける
  4. 取引量,変動率指標などの追加フィルター条件を導入する
  5. 複数のタイムフレームの検証: 信号の信頼性向上

要約する

Vishalの自己適応型多指数取引戦略は,MACD,Supertrend,Parabolic SARの協同作用により,包括的で柔軟な取引意思決定の枠組みを提供する革新的な量化取引方法である.リスクがあるにもかかわらず,その多指数検証と対称取引ロジックは,投資家に深入調査に値する取引モデルを提供します.

ストラテジーソースコード
/*backtest
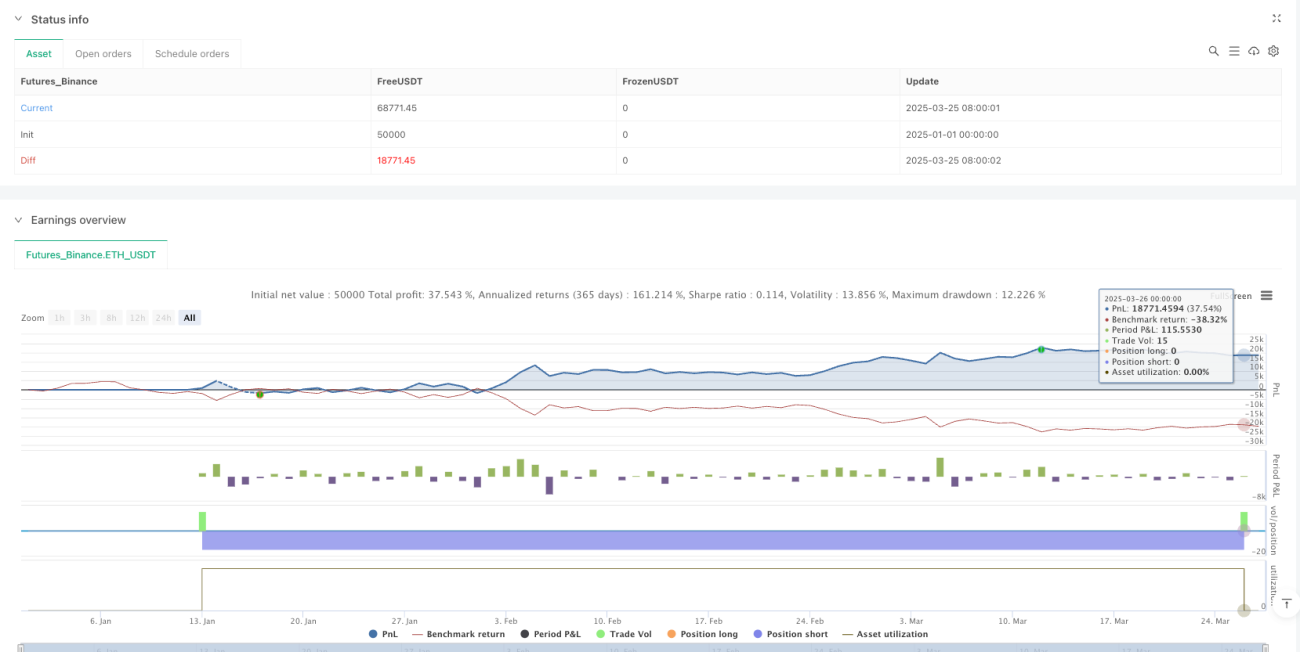
start: 2025-01-01 00:00:00
end: 2025-03-27 00:00:00
period: 2d
basePeriod: 2d
exchanges: [{"eid":"Futures_Binance","currency":"ETH_USDT"}]
*/

//@version=6
strategy("Vishal Strategy", overlay=true, margin_long=100, margin_short=100, initial_capital=100000, default_qty_type=strategy.percent_of_equity, default_qty_value=100)

// **MACD Inputs & Calculation**
fast_length  = input.int(13, title="MACD Fast Length")
slow_length  = input.int(27, title="MACD Slow Length")
signal_length = input.int(9, title="MACD Signal Smoothing")

fast_ma  = ta.ema(close, fast_length)
slow_ma  = ta.ema(close, slow_length)
macd     = fast_ma - slow_ma
signal   = ta.ema(macd, signal_length)
hist     = macd - signal

// **Supertrend Inputs & Calculation**
atrPeriod = input.int(11,    "ATR Length", minval = 1)
factor    = input.float(3.0, "Factor",     minval = 0.01, step = 0.01)
[supertrend, direction] = ta.supertrend(factor, atrPeriod)
bullTrend  = direction < 0   // Uptrend Condition
bearTrend  = direction > 0   // Downtrend Condition

// **Parabolic SAR Inputs & Calculation**
sarStep = input.float(0.02, "Parabolic SAR Step")
sarMax  = input.float(0.2, "Parabolic SAR Max")
sar = ta.sar(sarStep, sarStep, sarMax)

// **Trade Entry Conditions**
macdBullish = macd > signal // MACD in Bullish Mode
macdBearish = macd < signal // MACD in Bearish Mode
priceAboveSAR = close > sar // Price above SAR (Bullish)
priceBelowSAR = close < sar // Price below SAR (Bearish)

// **Boolean Flags to Track Conditions Being Met**
var bool macdConditionMet = false
var bool sarConditionMet = false
var bool trendConditionMet = false

// **Track if Each Condition is Met in Any Order**
if (macdBullish)
    macdConditionMet := true
if (macdBearish)
    macdConditionMet := false

if (priceAboveSAR)
    sarConditionMet := true
if (priceBelowSAR)
    sarConditionMet := false

if (bullTrend)
    trendConditionMet := true
if (bearTrend)
    trendConditionMet := false

// **Final Long Entry Signal (Triggers When All Three Flags Are True)**
longSignal = macdConditionMet and sarConditionMet and trendConditionMet

// **Final Short Entry Signal (Triggers When All Three Flags Are False)**
shortSignal = not macdConditionMet and not sarConditionMet and not trendConditionMet

// **Execute Full Equity Trades**
if (longSignal)
    strategy.entry("Long", strategy.long)

if (shortSignal)
    strategy.entry("Short", strategy.short)

// **Exit Logic - Requires 2 Consecutive Candle Closes Below/Above SAR**
var int belowSARCount = 0
var int aboveSARCount = 0

if (strategy.position_size > 0)  // Long position is active
    belowSARCount := close < sar ? belowSARCount + 1 : 0
    if (belowSARCount >= 1)
        strategy.close("Long")

if (strategy.position_size < 0)  // Short position is active
    aboveSARCount := close > sar ? aboveSARCount + 1 : 0
    if (aboveSARCount >= 1)
        strategy.close("Short")

// **Plot Indicators**
plot(supertrend, title="Supertrend", color=bullTrend ? color.green : color.red, linewidth=2, style=plot.style_linebr)
plot(sar, title="Parabolic SAR", color=color.blue, style=plot.style_cross, linewidth=2)
plot(macd, title="MACD Line", color=color.blue, linewidth=2)
plot(signal, title="MACD Signal", color=color.orange, linewidth=2)
plot(hist, title="MACD Histogram", style=plot.style_columns, color=hist >= 0 ? color.green : color.red)