多次元テクニカル指標複合トレンド追跡定量取引戦略

EMA RSI ATR VWAP ST
作成日: 2025-03-28 17:22:09 最終変更日: 2025-03-28 17:22:09
コピー: 0 クリック数: 357
2
フォロー
319
フォロワー

多次元テクニカル指標複合トレンド追跡定量取引戦略 多次元テクニカル指標複合トレンド追跡定量取引戦略

概要

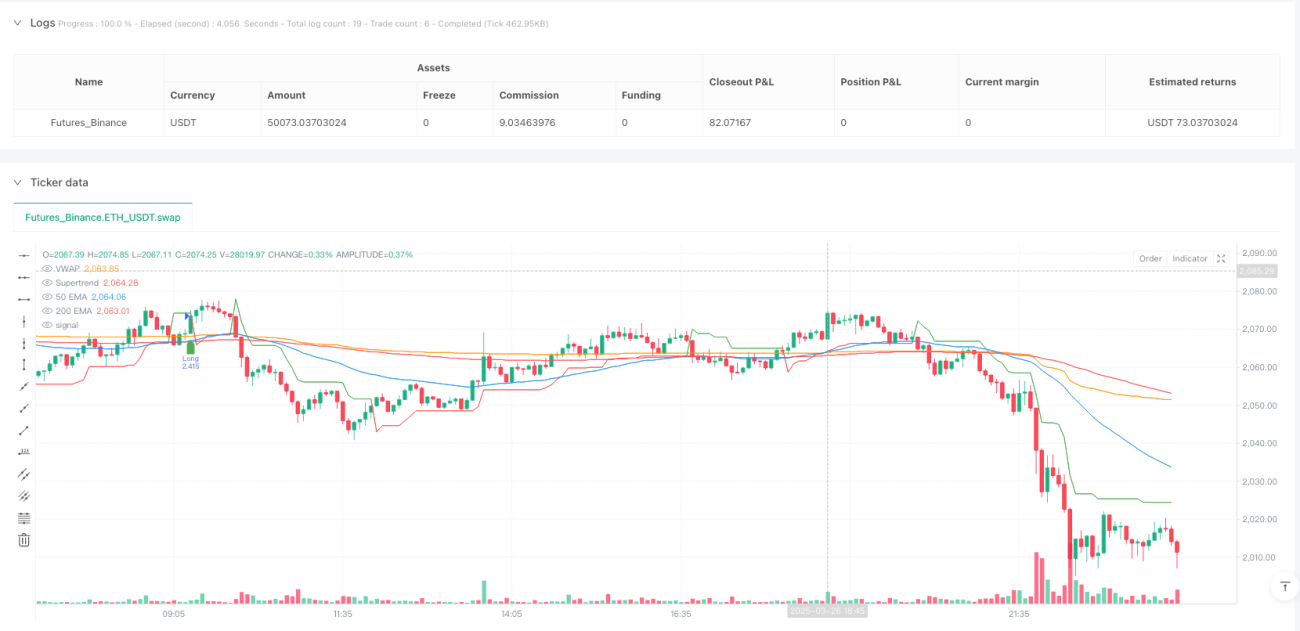
この戦略は,複数の技術指標を統合した量化取引方法であり,指数移動平均 (EMA),相対的に強い指数 (RSI),平均実際の変動幅 (ATR),取引量重量平均価格 (VWAP) およびスーパートレンド (Supertrend) などの指標を組み合わせることで,市場の傾向を正確に捉え,リスクを制御できる取引を実現します.

戦略原則

戦略の核心となる原則は,多次元技術指標の協同作用に基づいています.

  1. 50日および200日指数移動平均 ((EMA) を用いてトレンドの方向と可能なトレンドの逆転点を判断する
  2. 比較的強い指数 (RSI) を使ってトレンドの動力を確認し,過剰に上昇または低下を避ける
  3. 動的ストップとストップ距離を平均真波動範囲 ((ATR) を使用して計算する
  4. 価格動向を検証するサポートとプレッシャーの位置を組み合わせた交差重量平均価格 ((VWAP))
  5. スーパートレンド (Supertrend) の指標を用いてトレンドの方向と取引シグナルを確認する

戦略的優位性

  1. 複数の技術指標を統合することで,信号の正確性と信頼性を大幅に向上させる
  2. リスク管理: 動的なATRのストップ損失と固定リスクリターン比率,単一取引のリスクを効果的に制御
  3. 柔軟性:市場の変化に応じてパラメータを調整し,異なる市場環境に対応できます.
  4. シグナルフィルタリング:RSIやVWAPなどの指標を介して不確実性信号をフィルタリングし,誤った取引を減らす
  5. リアルタイム: リアルタイムの取引シグナルとアラームを生成し,市場の変化に迅速に反応するトレーダーを便利にする

戦略リスク

  1. パラメータの感受性:指標のパラメータを正しく設定しないことが,取引信号の頻度や信号の欠落を引き起こす
  2. 市場突発:ブラック・スウェン事件と市場の激波を完全に回避できない
  3. 過剰適合リスク:戦略パラメータの十分な反省と検証が必要
  4. 取引コスト:取引頻度が手数料やスライドポイントコストを増加させる
  5. 指数の失効:特定の市場段階では,一部の技術指標は予測力を失う可能性があります.

戦略最適化の方向性

  1. 機械学習アルゴリズムの導入:AI技術を使用して指標パラメータを動的に調整する
  2. フィルタリング条件の追加: 変動率,取引量などの追加指標
  3. 多周期分析モジュール開発:異なる時間尺度で取引シグナルを検証
  4. リスク管理の最適化:より複雑なポジション管理と資金管理戦略の導入
  5. 適応パラメータを増やす:市場の変動に応じて,ストップ・ロズとストップ・ストップ戦略を自動的に調整する

要約する

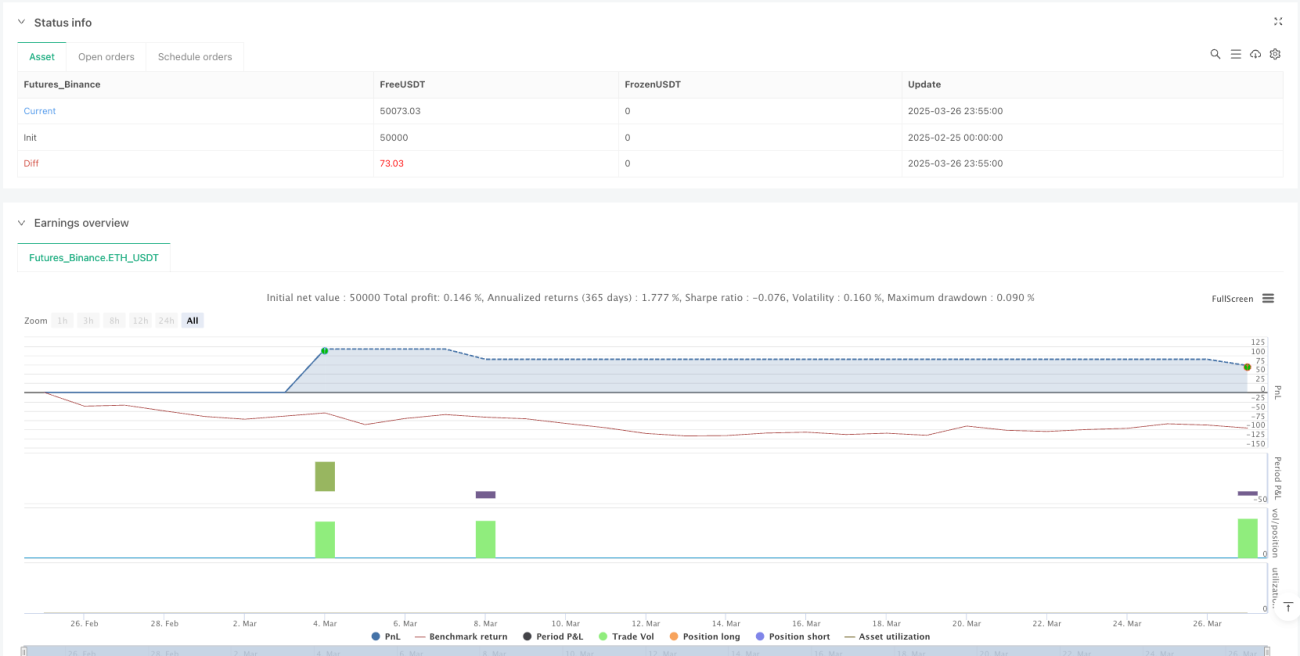
これは,多次元技術指標に基づく量化取引戦略で,体系的な指標の組み合わせと厳格なリスク管理により,市場動向を捉え,取引リスクを制御することを目的としています.この戦略の核心は,指標の協同作用と動的パラメータの最適化であり,量化取引のための柔軟で比較的安定した方法を提供します.

ストラテジーソースコード
/*backtest
start: 2025-02-25 00:00:00
end: 2025-03-27 00:00:00
period: 5m
basePeriod: 5m
exchanges: [{"eid":"Futures_Binance","currency":"ETH_USDT"}]
*/

//@version=6
strategy("Advanced BTC/USDT Strategy", overlay=true, default_qty_type=strategy.percent_of_equity, default_qty_value=10)

// ==== INPUT PARAMETERS ====
emaShortLength = input.int(50, title="Short EMA Length")
emaLongLength = input.int(200, title="Long EMA Length")
rsiLength = input.int(14, title="RSI Length")
atrLength = input.int(14, title="ATR Length")
supertrendFactor = input.float(2.0, title="Supertrend Factor")
supertrendATRLength = input.int(10, title="Supertrend ATR Length")
riskRewardRatio = input.float(2.0, title="Risk-Reward Ratio")

// ==== TECHNICAL INDICATORS ====
// Exponential Moving Averages (EMA)
emaShort = ta.ema(close, emaShortLength)
emaLong = ta.ema(close, emaLongLength)

// Relative Strength Index (RSI)
rsi = ta.rsi(close, rsiLength)

// Supertrend Indicator
[supertrend, supertrendDirection] = ta.supertrend(supertrendFactor, supertrendATRLength)

// Average True Range (ATR) for Stop Loss Calculation
atr = ta.atr(atrLength)
stopLossDistance = atr * 1.5  // ATR-based stop-loss
takeProfitDistance = stopLossDistance * riskRewardRatio

// Volume Weighted Average Price (VWAP)
vwap = ta.vwap(close)

// ==== ENTRY CONDITIONS ====
// Long Entry: Golden Cross + RSI Confirmation + VWAP Support + Supertrend Uptrend
longCondition = ta.crossover(emaShort, emaLong) and rsi > 40 and rsi < 65 and close > vwap and supertrendDirection == 1

// Short Entry: Death Cross + RSI Confirmation + VWAP Resistance + Supertrend Downtrend
shortCondition = ta.crossunder(emaShort, emaLong) and rsi > 60 and rsi < 80 and close < vwap and supertrendDirection == -1

// ==== EXIT CONDITIONS ====
// Stop-Loss and Take-Profit Levels for Long Positions
longStopLoss = close - stopLossDistance
longTakeProfit = close + takeProfitDistance

// Stop-Loss and Take-Profit Levels for Short Positions
shortStopLoss = close + stopLossDistance
shortTakeProfit = close - takeProfitDistance

// ==== TRADE EXECUTION ====
// Open Long Trade
if (longCondition)
    strategy.entry("Long", strategy.long)
    strategy.exit("Long Exit", from_entry="Long", limit=longTakeProfit, stop=longStopLoss)

// Open Short Trade
if (shortCondition)
    strategy.entry("Short", strategy.short)
    strategy.exit("Short Exit", from_entry="Short", limit=shortTakeProfit, stop=shortStopLoss)

// ==== ALERT SYSTEM (OPTIONAL) ====
// Send real-time alerts for buy/sell signals
alertcondition(longCondition, title="BUY Alert 🚀", message="BTC Buy Signal! 📈")
alertcondition(shortCondition, title="SELL Alert 🔻", message="BTC Sell Signal! 📉")

// ==== PLOTTING ====
// Plot Moving Averages
plot(emaShort, color=color.blue, title="50 EMA")
plot(emaLong, color=color.red, title="200 EMA")

// Plot Supertrend
plot(supertrend, color=supertrendDirection == 1 ? color.green : color.red, title="Supertrend")

// Plot VWAP
plot(vwap, color=color.orange, title="VWAP")

// Plot Buy/Sell Signals
plotshape(series=longCondition, location=location.belowbar, color=color.green, style=shape.labelup, title="Buy Signal")
plotshape(series=shortCondition, location=location.abovebar, color=color.red, style=shape.labeldown, title="Sell Signal")