
2
Follow
478
Followers
概要
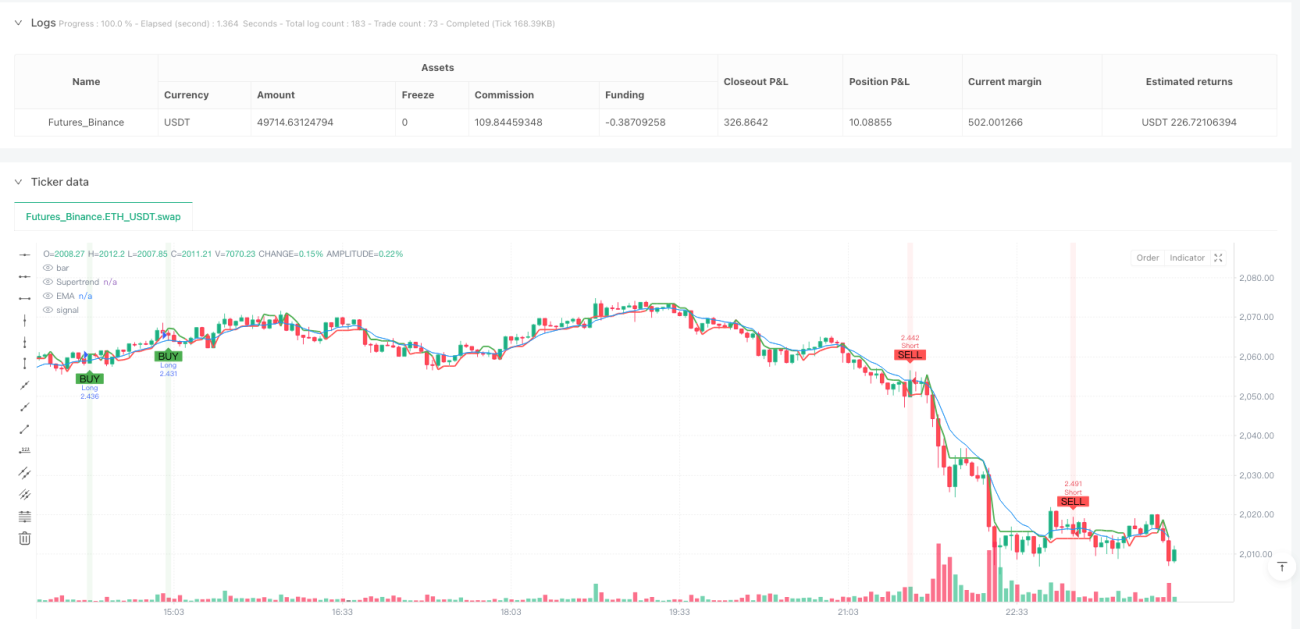
この戦略は,スーパートレンド,指数移動平均,指数移動平均,相対的に強い指数,RSIを組み合わせて,正確な取引信号のキャプチャとリスク管理に焦点を当てた革新的な量化取引方法である.この戦略は,トレーダーにダイナミックで多次元的な市場トレンド追跡機構を提供し,1分,5分および15分チャートに柔軟に適用できるようにすることを目指しています.
戦略原則
戦略の核心は,以下の3つの重要な技術指標の協同作用に基づいています.
- スーパートレンド (Supertrend): 平均実際の波動範囲 (ATR) と価格変化の方向を計算することで,市場傾向の判断を提供する.
- 指数移動平均 ((EMA): 動的なサポート/レジスタンスラインとして,価格の相対平均の位置を決定するのに役立ちます.
- 比較的強い指数 ((RSI):市場の動きを評価し,過買と過売を識別する.
この戦略は,以下の3つの指標を総合的に分析して取引シグナルを生成します.
- 超トレンドは多頭 + 価格がEMAより高い + RSIが40より高い
- 空気信号:超トレンドは空気 + 価格はEMAより低い + RSIは60より低い
戦略的優位性
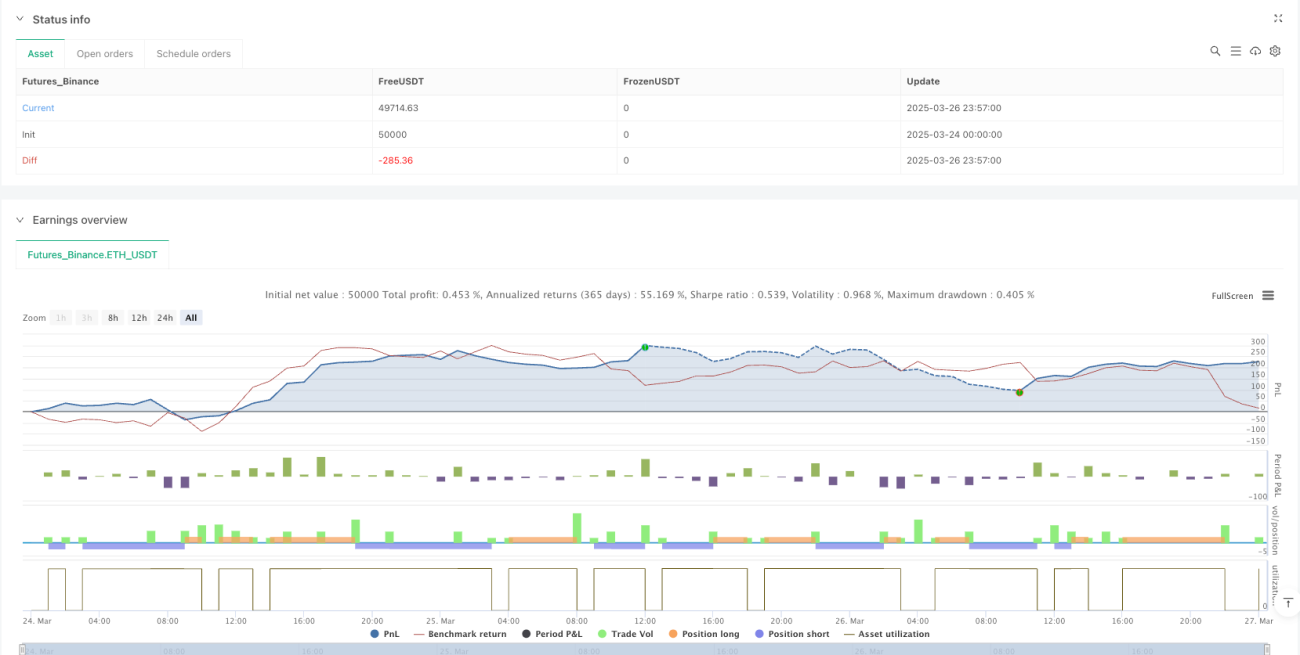
- 多次元信号検証:三指標のクロス検証により,信号の信頼性が著しく向上する.
- ダイナミックなリスク管理:ATRベースのストップ・アンド・ストップ・メカニズムを使用し,市場の変動に自律的に適応します.
- 柔軟性:複数の時間周期で柔軟に適用できます (一分,5分,15分).
- 単一ポジションコントロール:一度に1つのポジションのみを許可し,取引リスクを効果的に制御する.
- ビジュアル・アシスト: 明確な買入シグナル・マーカーとキー指標の表を用意する.
戦略リスク
- 指標の遅延:技術指標には一定の歴史データ依存があり,信号の遅延を引き起こす可能性があります.
- 波動率の影響: 波動性の高い市場では,ストップ・ロスは頻繁にトリガーされる可能性があります.
- 参数感性:ATRの長さ,EMA周期,RSIの<unk>値が戦略のパフォーマンスに顕著な影響を与える.
- 取引コスト: 頻繁に取引すると手数料が高くなります.
戦略最適化の方向性
- 適応パラメータ:機械学習アルゴリズムを導入し,市場条件に応じてパラメータを動的に調整する.
- 多空組合せ:トレンド追跡と逆転戦略を組み合わせ,戦略の安定性をバランスする.
- リスク配分:ポジション管理を最適化し,動的なポジションサイズ制御を導入する.
- 多周期検証:より多くの時間周期の信号検証メカニズムを追加する.
- 取引コストの最適化: 取引頻度を下げ,不要な取引を減らす.
要約する
これは,超トレンド,EMA,RSIの協同作用により,トレーダーにダイナミックで柔軟な取引意思決定の枠組みを提供する,多次元技術分析を融合した量的取引戦略である.戦略の核心的な優位性は,複数のシグナル検証と自主的なリスク管理機構にあるが,同時に,トレーダーが継続的に最適化と調整を必要とする.
Source
Pine
/*backtest
start: 2025-03-24 00:00:00
end: 2025-03-27 00:00:00
period: 3m
basePeriod: 3m
exchanges: [{"eid":"Futures_Binance","currency":"ETH_USDT"}]
*/

//@version=6
strategy("SOL Scalper - Supertrend + EMA + RSI (One Position at a Time)", overlay=true, initial_capital=1000, default_qty_type=strategy.percent_of_equity, default_qty_value=10, commission_type=strategy.commission.percent, commission_value=0.075)

// InputsStrategy parameters
Related strategies
Comment
All comments (0)
No data
- 1