市場構造スイングトレード戦略

CHoCH BOS IDM ATR RSI SL TP
作成日: 2025-03-28 17:38:30 最終変更日: 2025-03-28 17:38:45
コピー: 7 クリック数: 387
2
フォロー
319
フォロワー

市場構造スイングトレード戦略 市場構造スイングトレード戦略

概要

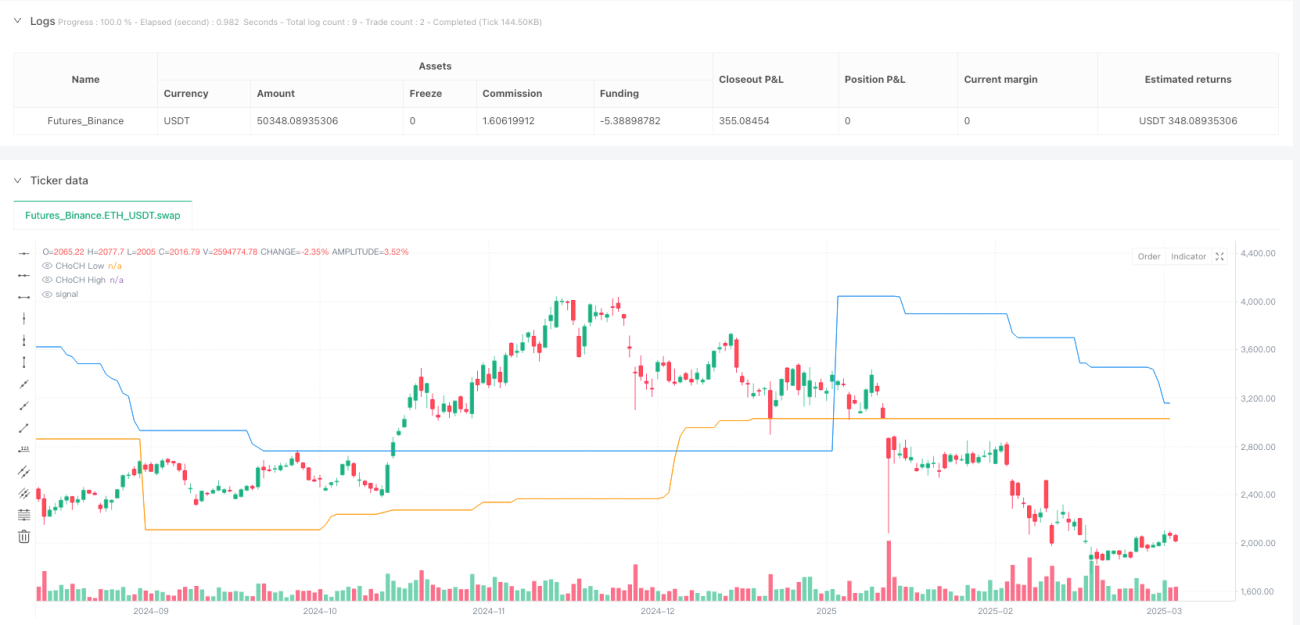
市場構造の変動取引戦略は,市場構造の変化,流動性のキャプチャ,およびトレンドの動きに基づいた高度な取引方法である.この戦略は,価格変化の重要な特徴を分析し,潜在的トレンドの逆転と継続の機会を識別することによって,トレーダーに体系化された取引意思決定の枠組みを提供します.

戦略原則

戦略の核心となるのは,以下の4つの重要な指標です.

  1. 変化の特徴 ((Change of Character, CHoCH):価格動向のターニングポイントを識別し,市場の潜在的方向の変化を判断する.
  2. 構造の破裂 (Break of Structure, BOS):トレンドの動力と方向性の破裂を確認する.
  3. 誘導点 (Inducements, IDM):市場の流動性の罠と資金の移動を捉える
  4. スウィープス (Sweeps): 偽の突破口を特定し,流動性を利用する.

戦略は,平均的な実際の波動範囲 (ATR),相対的な強さ指数 (RSI) および取引量を含む技術分析指標を総合的に使用し,多次元的な取引意思決定システムを構築する.

戦略的優位性

  1. 系統的なリスク管理:ATR計算によるストップ・ロスとストップ・ストップにより,単一取引のリスクを効果的に制御する.
  2. 複数のフィルタ条件:CHoCH,BOS,RSIと交差量と組み合わせて,信号の正確性を向上させる.
  3. ダイナミックポジション管理:権利利害率を使用して取引ポジションを設定し,資金の使用効率を最適化する.
  4. 柔軟なエントリー・アウト・メカニズム:市場構造の動向に応じて取引戦略を調整できる.

戦略リスク

  1. 偽の突破リスク: 市場構造指標は誤った信号を生成する可能性があります.
  2. パラメータの感受性: 戦略のパラメータの設定は,パフォーマンスに顕著な影響を及ぼします.
  3. 取引量と流動性のリスク:流動性の低い市場では不良な結果が出る可能性があります.
  4. 引き下げコントロール: 継続的なトレンド市場では,より大きな引き下げに直面する可能性があります.

戦略最適化の方向性

  1. 機械学習アルゴリズムの導入:パラメータ選択と信号認識の最適化.
  2. 信号の信頼性を向上させるため,複数のタイムフレーム解析を追加しました.
  3. ダイナミック・リスク・マネジメント・モジュール開発:市場の変動に応じてポジション調整
  4. MACD,ブリン帯などの技術指標を統合し,信号のフィルタリングを強化.

要約する

市場構造を振動する取引戦略は,市場構造を体系的に分析することによって,交易者に強力な取引意思決定の枠組みを提供する先進的な量的な取引方法である.継続的な最適化とリスク管理により,この戦略は,異なる市場環境で安定した取引パフォーマンスを得る可能性があります.

ストラテジーソースコード
/*backtest
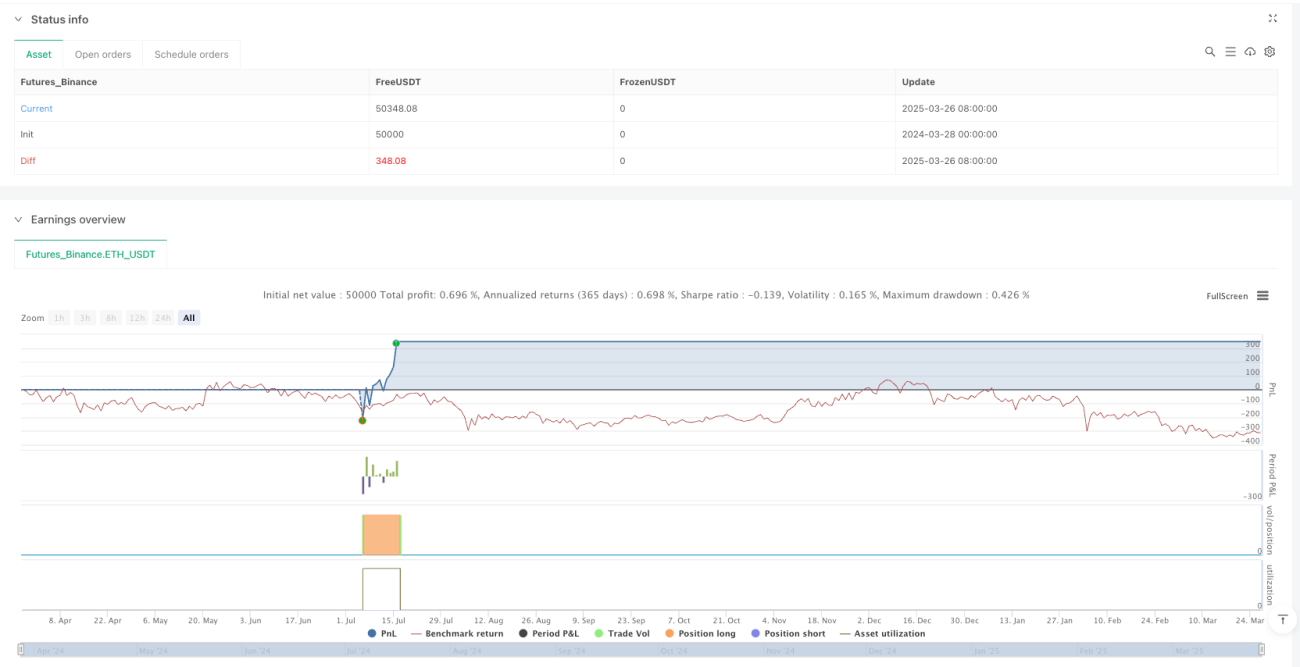
start: 2024-03-28 00:00:00
end: 2025-03-27 00:00:00
period: 1d
basePeriod: 1d
exchanges: [{"eid":"Futures_Binance","currency":"ETH_USDT"}]
*/

//@version=5
strategy("Market Structure Swing Trading", overlay=true, default_qty_type=strategy.percent_of_equity, default_qty_value=5)

// === Input Parameters ===
len = input(50, "CHoCH Detection Period")
shortLen = input(3, "IDM Detection Period")
atrMultiplierSL = input(2.0, "ATR Multiplier for Stop Loss")
atrMultiplierTP = input(3.0, "ATR Multiplier for Take Profit")
rsiPeriod = input(14, "RSI Period")
rsiOverbought = input(70, "RSI Overbought Level")
rsiOversold = input(30, "RSI Oversold Level")
volThreshold = input(1.2, "Volume Multiplier Threshold") 

// === ATR Calculation for SL & TP ===
atr = ta.atr(14)
stopLossLong = close - (atr * atrMultiplierSL)
takeProfitLong = close + (atr * atrMultiplierTP)
stopLossShort = close + (atr * atrMultiplierSL)
takeProfitShort = close - (atr * atrMultiplierTP)

// === RSI Filter ===
rsi = ta.rsi(close, rsiPeriod)
longConditionRSI = rsi < rsiOversold
shortConditionRSI = rsi > rsiOverbought

// === Volume Filter ===
volThresholdValue = ta.sma(volume, 20) * volThreshold
highVolume = volume > volThresholdValue

// === Market Structure Functions ===
swings(len) =>
    var int topx = na
    var int btmx = na
    upper = ta.highest(len)
    lower = ta.lowest(len)
    top = high[len] > upper ? high[len] : na
    btm = low[len] < lower ? low[len] : na
    topx := top ? bar_index[len] : topx
    btmx := btm ? bar_index[len] : btmx
    [top, topx, btm, btmx]

[top, topx, btm, btmx] = swings(len)

// === CHoCH Detection ===
var float topy = na
var float btmy = na
var os = 0
var top_crossed = false
var btm_crossed = false

if top
    topy := top
    top_crossed := false
if btm
    btmy := btm
    btm_crossed := false

if close > topy and not top_crossed
    os := 1
    top_crossed := true
if close < btmy and not btm_crossed
    os := 0
    btm_crossed := true

// === Break of Structure (BOS) ===
var float max = na
var float min = na
var int max_x1 = na
var int min_x1 = na

if os != os[1]
    max := high
    min := low
    max_x1 := bar_index
    min_x1 := bar_index

bullishBOS = close > max and os == 1
bearishBOS = close < min and os == 0

// === Trade Conditions with Filters ===
longEntry = bullishBOS and longConditionRSI and highVolume
shortEntry = bearishBOS and shortConditionRSI and highVolume

// === Execute Trades ===
if longEntry
    strategy.entry("Long", strategy.long)
    strategy.exit("Long TP/SL", from_entry="Long", stop=stopLossLong, limit=takeProfitLong)

if shortEntry
    strategy.entry("Short", strategy.short)
    strategy.exit("Short TP/SL", from_entry="Short", stop=stopLossShort, limit=takeProfitShort)

// === Plotting Market Structure ===
plotshape(series=longEntry, location=location.belowbar, color=color.green, style=shape.labelup, title="BUY")
plotshape(series=shortEntry, location=location.abovebar, color=color.red, style=shape.labeldown, title="SELL")
plot(topy, color=color.blue, title="CHoCH High")
plot(btmy, color=color.orange, title="CHoCH Low")