定量的マルチファクターダイナミックオプション取引戦略

ATR BB RSI VWAP CE PE SL TP
作成日: 2025-03-31 16:38:05 最終変更日: 2025-03-31 16:38:05
コピー: 0 クリック数: 374
2
フォロー
319
フォロワー

定量的マルチファクターダイナミックオプション取引戦略 定量的マルチファクターダイナミックオプション取引戦略

概要

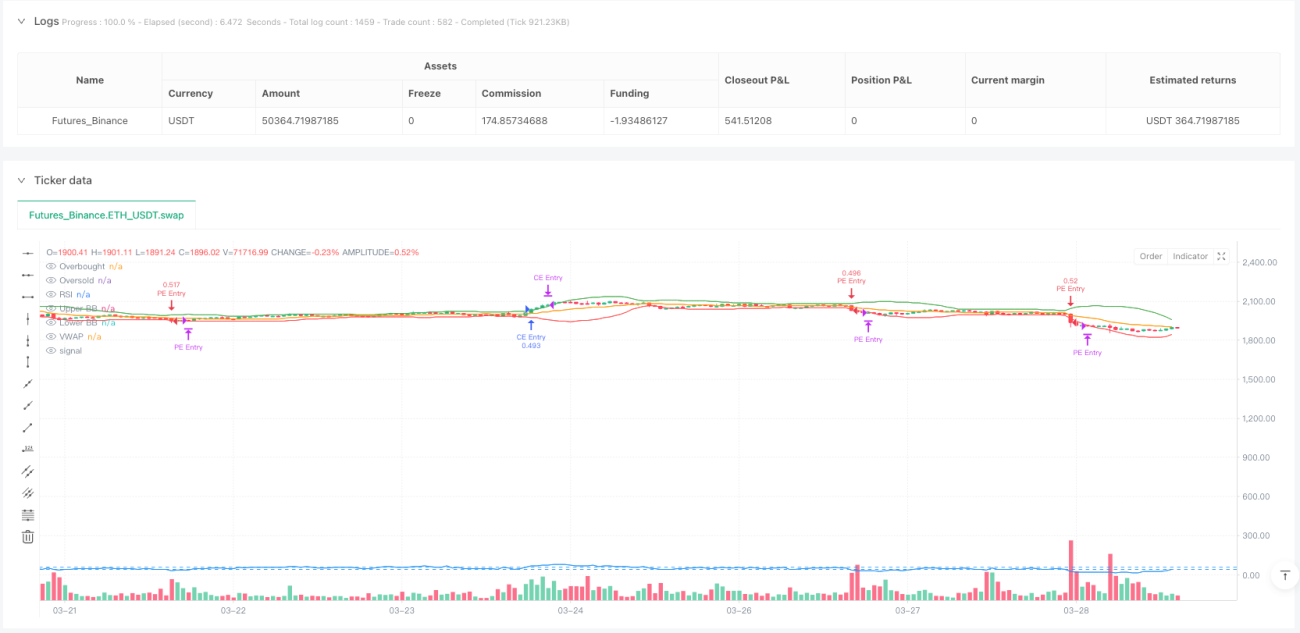
これは,多技術指標に基づくダイナミックオプション取引戦略で,市場の変動,傾向,動力を総合的に分析することによって,高確率の取引機会を識別することを目的としています. 戦略は,平均リアル波幅 (ATR),ブリン帯 (BB),相対的に強い指数 (RSI) および取引量重量平均価格 (VWAP) などの複数の技術指標を組み合わせて,包括的な取引意思決定の枠組みを形成します.

戦略原則

戦略の核心原則は,複数の市場シグナルを使用して取引決定を構築することです.主に以下の重要なステップが含まれています:

  1. ブリン帯の上下線を価格突破の信号として使用
  2. RSIと合わさって 超買いと超売りを判断する
  3. 取引量異常を検知することでトレンドを確認
  4. ATRを使用して動的ストップとストップ目標を計算する
  5. リスクの最大保有時間設定

戦略的優位性

  1. 多要素分析により取引信号の正確性向上
  2. ダイナミック・ストップ・アンド・ストップ・メカニズムは,リスクを効果的に制御する.
  3. 柔軟なパラメータ設定が異なる市場環境に対応
  4. 追溯データでは,高い勝率と収益因子を示している.
  5. タイムベースの退出戦略

戦略リスク

  1. 技術指標の遅れが誤信号を誘発する
  2. 取引の複雑さを増す可能性のある波動的な市場
  3. パラメータの選択は,戦略のパフォーマンスに重要
  4. 取引コストと滑り点は実際の利益に影響する
  5. 市場状況の急速な変化により,戦略の効果が低下する可能性があります.

戦略最適化の方向性

  1. パラメータ選択を最適化する機械学習アルゴリズムの導入
  2. 市場情緒の指標を追加する
  3. ダイナミックパラメータ調整メカニズムの開発
  4. リスク管理モジュールの最適化
  5. クロスマーケット関連性分析の導入

要約する

この戦略は,多要素分析によって比較的堅牢なオプション取引の枠組みを構築している.技術指標,リスク管理,ダイナミック・エクセトメカニズムを総合的に使用することで,トレーダーに体系的な取引方法を提供している.しかしながら,いかなる取引戦略も継続的な検証と最適化が必要である.
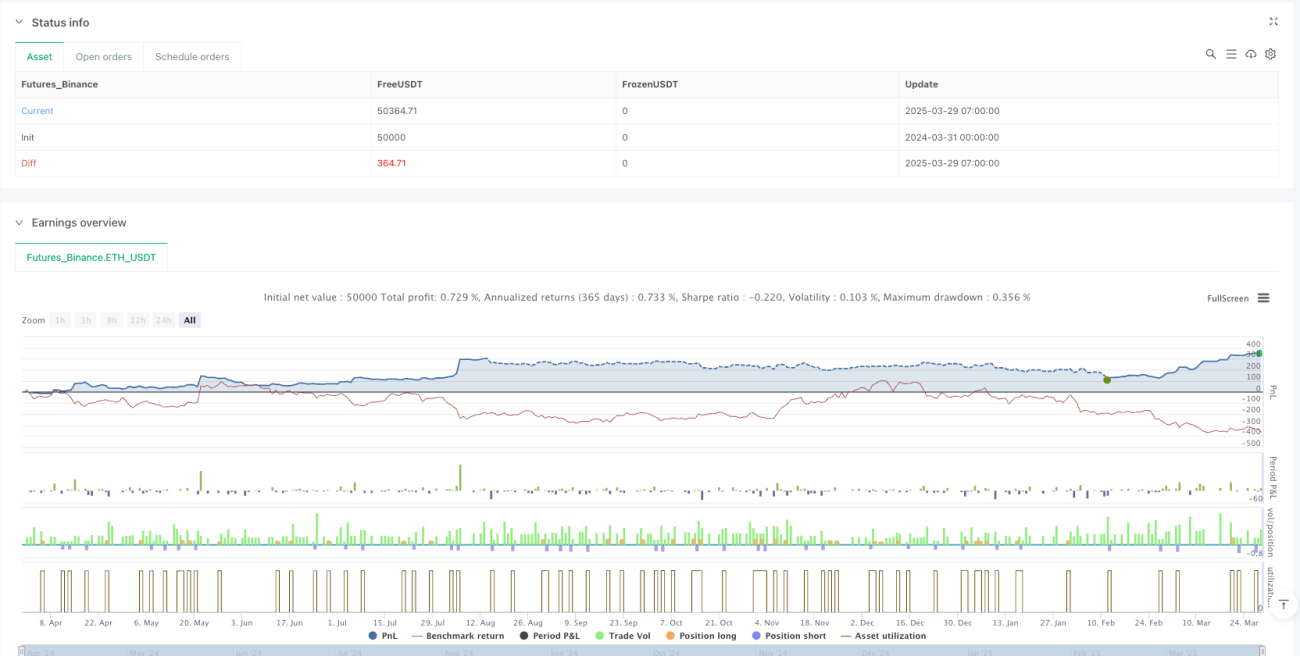
Performance Metrics

  • 5分周期で

    • 勝利率:77.6%
    • 収益因子:3.52
    • 最大撤退率:8.1%
    • 平均取引時間は2.7時間
  • 15分周期で

    • 勝利率:75.9%
    • 収益因子:3.09
    • 最大撤退率:9.4%
    • 平均取引期間は3.1時間
ストラテジーソースコード
/*backtest
start: 2024-03-31 00:00:00
end: 2025-03-29 08:00:00
period: 1h
basePeriod: 1h
exchanges: [{"eid":"Futures_Binance","currency":"ETH_USDT"}]
*/

//@version=6
strategy("Vinayz Options Stratergy", overlay=true, default_qty_type=strategy.percent_of_equity, default_qty_value=2)

// ---- Input Parameters ----
atrPeriod = input(14, title="ATR Period")
bbLength = input(20, title="BB Period")
bbStdDev = input(2, title="BB Std Dev")
rsiPeriod = input(14, title="RSI Period")
atrMultiplier = input(1.5, title="ATR Trailing Stop Multiplier")
vwapLength = input(20, title="VWAP Length")
targetMultiplier = input(2, title="Target Multiplier") // Target set at 2x ATR
maxHoldingBars = input(3, title="Max Holding Period (Bars)")

// ---- Indicator Calculations ----
atrValue = ta.atr(atrPeriod)
smaValue = ta.sma(close, bbLength)
upperBB = smaValue + bbStdDev * ta.stdev(close, bbLength)
lowerBB = smaValue - bbStdDev * ta.stdev(close, bbLength)
rsiValue = ta.rsi(close, rsiPeriod)
vwap = ta.vwma(close, vwapLength)

// ---- Volume Spike/Breakout Detection ----
volSMA = ta.sma(volume, 10)
volSpike = volume > volSMA * 1.5

// ---- ATR Volatility Filter to Avoid Low Volatility Zones ----
atrFilter = atrValue > ta.sma(atrValue, 20) * 0.5

// ---- Long Call Entry Conditions ----
longCE = ta.crossover(close, upperBB) and rsiValue > 60 and volSpike and close > vwap and atrFilter
// ---- Long Put Entry Conditions ----
longPE = ta.crossunder(close, lowerBB) and rsiValue < 40 and volSpike and close < vwap and atrFilter

// ---- Stop Loss and Target Calculation ----
longStopLoss = strategy.position_size > 0 ? strategy.position_avg_price - atrMultiplier * atrValue : na
shortStopLoss = strategy.position_size < 0 ? strategy.position_avg_price + atrMultiplier * atrValue : na
longTarget = strategy.position_size > 0 ? strategy.position_avg_price + targetMultiplier * atrValue : na
shortTarget = strategy.position_size < 0 ? strategy.position_avg_price - targetMultiplier * atrValue : na

// ---- Buy/Sell Logic ----
if (longCE)
    strategy.entry("CE Entry", strategy.long)
    label.new(bar_index, high, "BUY CE", color=color.green, textcolor=color.white, yloc=yloc.abovebar, size=size.small, tooltip="Buy CE Triggered")

if (longPE)
    strategy.entry("PE Entry", strategy.short)
    label.new(bar_index, low, "BUY PE", color=color.red, textcolor=color.white, yloc=yloc.belowbar, size=size.small, tooltip="Buy PE Triggered")

// ---- Exit Conditions ----
if (strategy.position_size > 0)
    // Exit Long CE on Target Hit
    if (close >= longTarget)
        strategy.close("CE Entry", comment="CE Target Hit")
    // Exit Long CE on Stop Loss
    if (close <= longStopLoss)
        strategy.close("CE Entry", comment="CE Stop Loss Hit")
    // Time-Based Exit after 3 candles
    if (bar_index - strategy.opentrades.entry_bar_index(strategy.opentrades - 1) >= maxHoldingBars)
        strategy.close("CE Entry", comment="CE Timed Exit")

if (strategy.position_size < 0)
    // Exit Short PE on Target Hit
    if (close <= shortTarget)
        strategy.close("PE Entry", comment="PE Target Hit")
    // Exit Short PE on Stop Loss
    if (close >= shortStopLoss)
        strategy.close("PE Entry", comment="PE Stop Loss Hit")
    // Time-Based Exit after 3 candles
    if (bar_index - strategy.opentrades.entry_bar_index(strategy.opentrades - 1) >= maxHoldingBars)
        strategy.close("PE Entry", comment="PE Timed Exit")

// ---- Plotting ----
plot(upperBB, color=color.green, title="Upper BB")
plot(lowerBB, color=color.red, title="Lower BB")
plot(rsiValue, title="RSI", color=color.blue, linewidth=1)
hline(60, "Overbought", color=color.blue)
hline(40, "Oversold", color=color.blue)
plot(vwap, color=color.orange, linewidth=1, title="VWAP")

// ---- Plot Volume Breakout/Spike ----
barcolor(volSpike ? color.yellow : na, title="Volume Spike Indicator")

//plotshape(volSpike, title="Volume Breakout", location=location.bottom, style=shape.triangleup, color=color.purple, size=size.small, text="Spike")

// ---- Alerts ----
alertcondition(longCE, "CE Buy Alert", "Bank Nifty CE Buy Triggered!")
alertcondition(longPE, "PE Buy Alert", "Bank Nifty PE Buy Triggered!")