概要
これは,流動性ゾーン入場,ATRの波動的値,そしてダイナミックなリスク管理を統合することによって,トレーダーに構造化された取引方法を提供する革新的な量化取引戦略である.この戦略は,高確率の取引機会を識別するために,複数の技術的分析指標を組み合わせ,自動で止まりと停止のレベルを計算することを目的としている.
戦略原則
戦略の核心となる要素は以下の通りです.
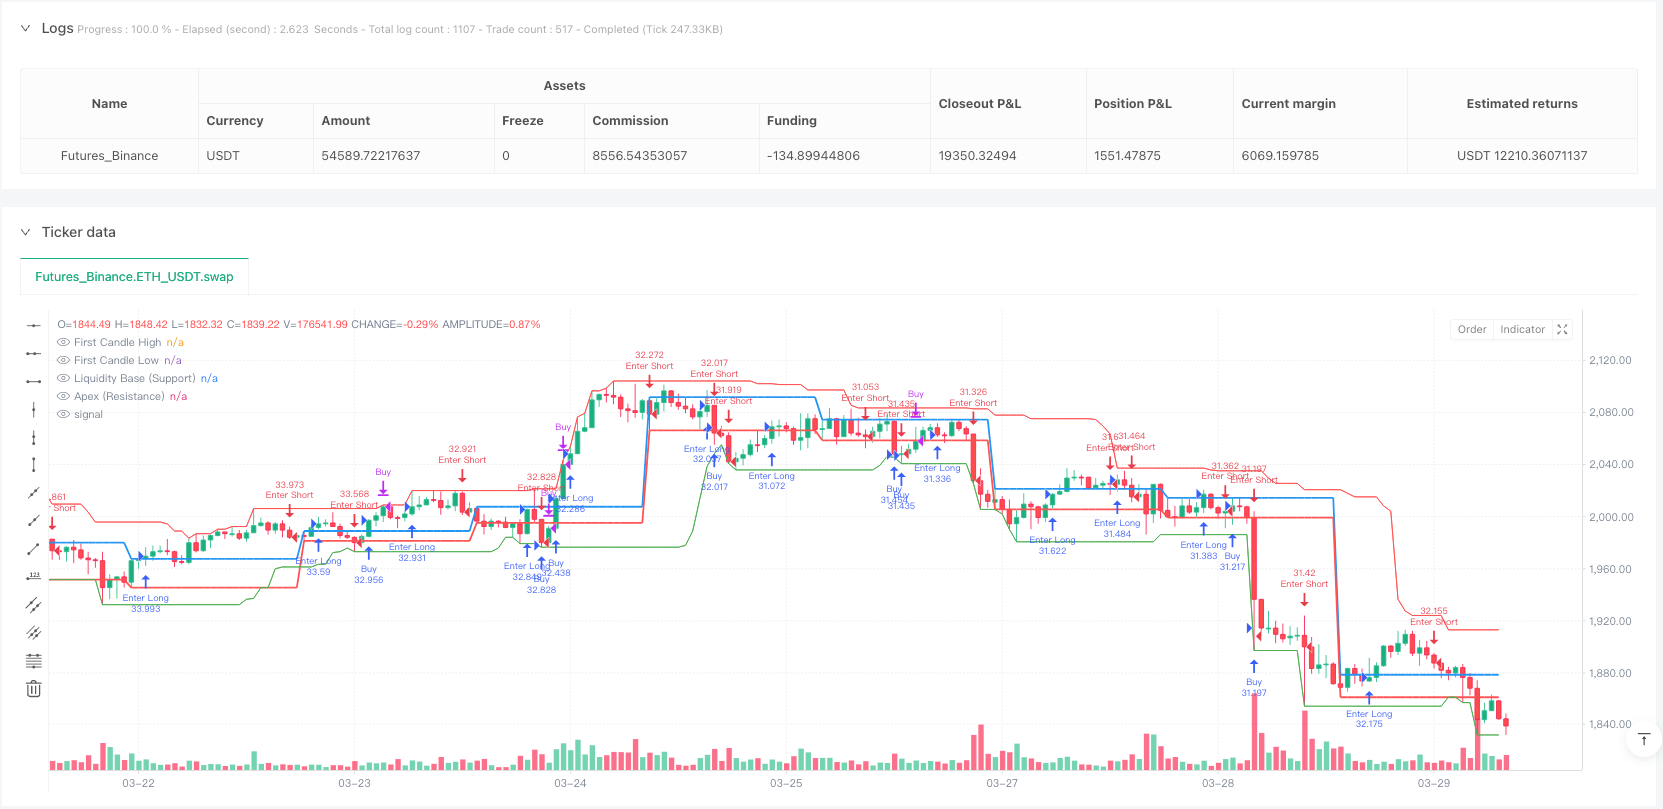
- 流動性領域分析:特定の周期内の最低点と最高点を計算することによって,潜在的なサポートと抵抗領域を識別する.
- ATR波動率フィルター:入場とリスク管理の動的値として,平均実際の波動範囲 ((ATR) を使用する.
- トレンドフィルター:50周期指数移動平均 ((EMA) と相対的に強い指数 ((RSI) を組み合わせて市場の傾向と動力を確認する.
- ダイナミックなリスク管理:ATRに基づいて自動でストップとストップ・ローズレベルを計算し,リスク/リターン比率を柔軟に調整することができます.
戦略的優位性
- 多次元信号生成:流動性,波動率,傾向フィルタを組み合わせて,信号品質を向上させる.
- 適応リスク管理: ストップ・ストップ・ロスを動的に調整し,取引リスクを効果的に管理する.
- 柔軟なパラメータ設定:ATRの長さ,流動性周期,取引時間などをカスタマイズできます.
- ビジュアルサポート:流動性線と最初のK線レベルのビジュアル表示を提供する.
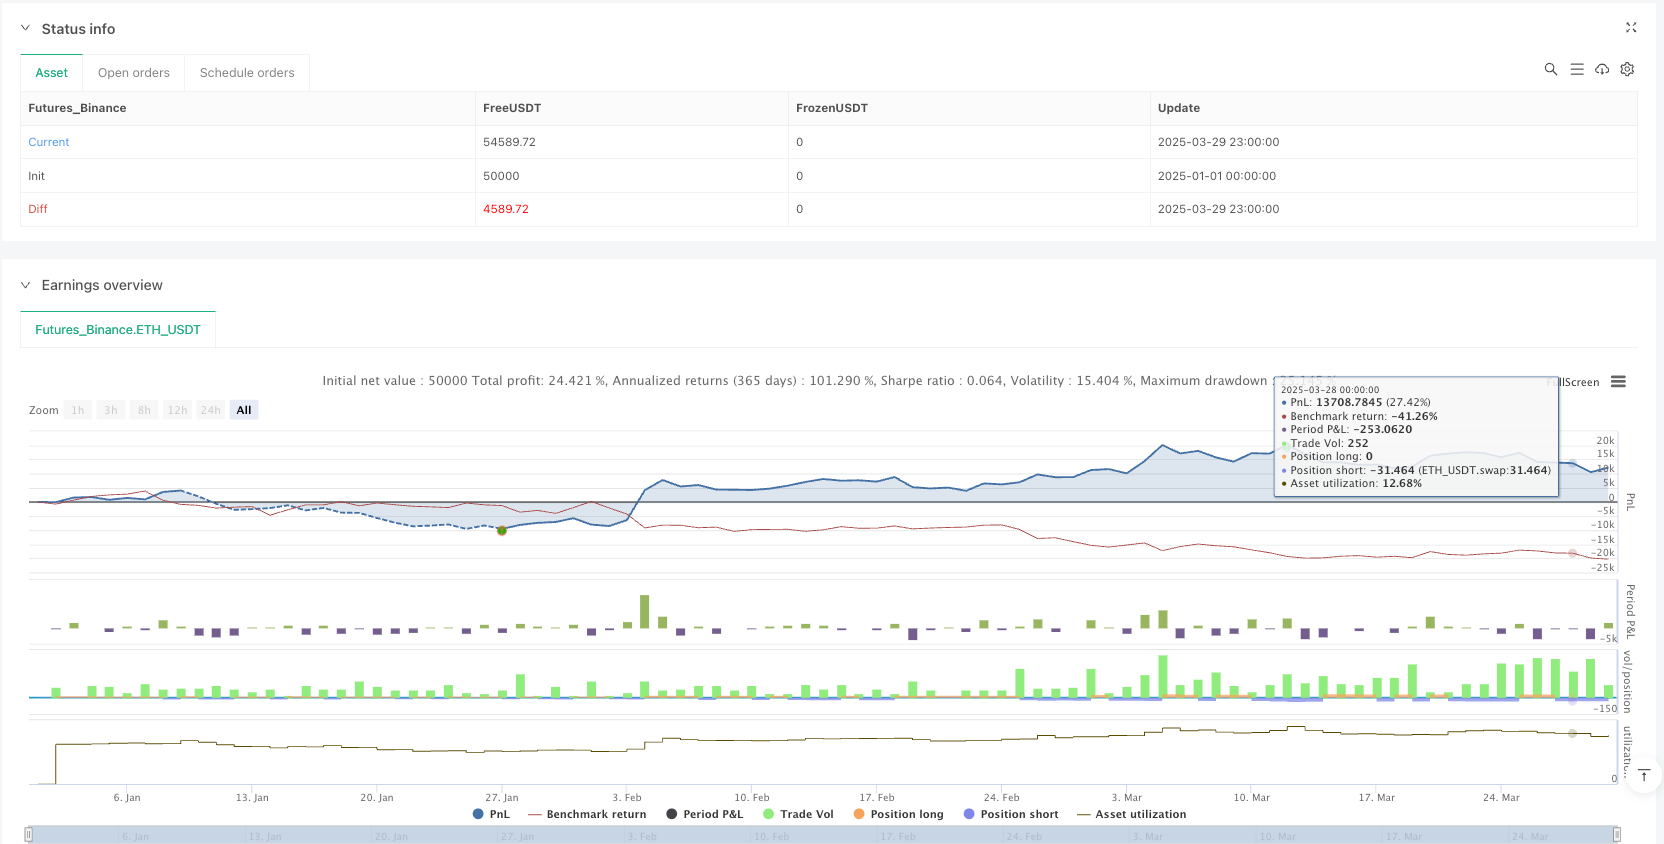
- パフォーマンストラッキング:内蔵の取引統計表で,勝率と負勝状況をグラフに直接表示する.
戦略リスク
- パラメータ感性: 戦略の性能はパラメータ選択に高度に依存し,継続的な反測と最適化が必要である.
- 市場の適応性: 傾向が不明な,または高度に変動する市場では,不安定なパフォーマンスを示す可能性があります.
- 偽突破の危険性:流動性の領域突破の誤報の可能性
- 取引頻度:セッションのフィルタリングと多重な条件により取引機会が減少する可能性があります.
- 64%の勝利率は,将来の成績を完全に反映していないかもしれない.
戦略最適化の方向性
- 機械学習統合:機械学習アルゴリズムの動的調整パラメータと信号生成の導入.
- 多市場適応性:異なる市場と品種に適用できるより一般的なパラメータ設定を開発する.
- リスク管理の深度:より複雑なポジションサイズとリスク配分アルゴリズムを導入する.
- シグナル確認メカニズム:取引量または他の技術指標のような追加の確認指標を追加する.
- リアルタイムパフォーマンスモニタリング:リアルタイムパフォーマンス評価と自適性調整モジュールの開発.
要約する
ThinkTech AI取引戦略は,革新的な多要素方法によって,トレーダーに強力な量化取引ツールを提供します.流動性分析,波動率フィルタリング,およびダイナミックリスク管理により,この戦略は,高品質の取引機会を識別することを目的としています.しかし,トレーダーは,戦略の潜在力を最大限に発揮するために,継続的に反省,最適化,慎重に適用する必要があります.
ストラテジーソースコード
/*backtest
start: 2025-01-01 00:00:00
end: 2025-03-30 00:00:00
period: 1h
basePeriod: 1h
exchanges: [{"eid":"Futures_Binance","currency":"ETH_USDT"}]
*/

if high > ta.highest(high[1], 5)
    strategy.entry("Enter Long", strategy.long)
else if low < ta.lowest(low[1], 5)
    strategy.entry("Enter Short", strategy.short)//@version=6
strategy("ThinkTech AI Signals", overlay=true, initial_capital=100000, default_qty_type=strategy.percent_of_equity, default_qty_value=100)

//──────────────────────────────
// Input Settings
//──────────────────────────────
riskRewardRatio    = input.float(title="Risk/Reward Ratio", defval=2.0, minval=1.0, step=0.1)

// Inputs from second script
liquidity_period   = input.int(20, title="Liquidity Base Period")
atr_length         = input.int(14, title="ATR Length")
atr_threshold      = input.float(0.3, title="ATR Breakout Threshold")
take_profit_mult   = input.float(0.25, title="Take-Profit Multiplier")
stop_loss_mult     = input.float(0.75, title="Stop-Loss Multiplier")
vol_filter         = input.bool(true, title="Enable Volume Filter")
session_filter     = input.bool(true, title="Limit to Trading Session")

// Additional inputs for further filtering and settings
atrMultiplier      = input.float(title="ATR Multiplier for Stop Loss", defval=1.5, minval=0.1, step=0.1)
retestCushionLong  = input.float(title="Retest Cushion Factor for BUY", defval=1.0, minval=1.0, step=0.001)
retestCushionShort = input.float(title="Retest Cushion Factor for SELL", defval=1.0, minval=0.0, maxval=1.0, step=0.001)
useTrendFilter     = input.bool(title="Use 50 EMA Trend Filter", defval=true)
useRSIFilter       = input.bool(title="Use RSI Filter", defval=false)
rsiPeriod          = input.int(title="RSI Period", defval=14, minval=1)
rsiOversold        = input.float(title="RSI Oversold Level", defval=30.0, minval=1, maxval=50)
rsiOverbought      = input.float(title="RSI Overbought Level", defval=70.0, minval=50, maxval=100)

// Option to remove plotted lines
showLiquidityLines   = input.bool(true, title="Show Liquidity Lines")
showFirstCandleLines = input.bool(true, title="Show First Candle Level Lines")

//──────────────────────────────
// Calculations & Variables (Liquidity & ATR Based)
//──────────────────────────────
price        = close
atr          = ta.atr(atr_length)
vol_condition = volume > ta.sma(volume, 20)

// Define Liquidity Base and Apex for support/resistance
liquidity_base = ta.lowest(low, liquidity_period)
apex           = ta.highest(high, liquidity_period)
// Track recent highs and lows for filtering
hh = ta.highest(high, 30)
ll = ta.lowest(low, 30)

//──────────────────────────────
// Trade Stats Variables
//──────────────────────────────
var float take_profit = na
var float stop_loss   = na
var bool  in_trade    = false
var int   win_count   = 0
var int   loss_count  = 0

//──────────────────────────────
// ENTRY LOGIC (BUY) Based on Liquidity & ATR
//──────────────────────────────
breakout_up      = price > liquidity_base + (atr * atr_threshold)
point_of_release = ta.crossover(price, liquidity_base) and breakout_up
retest_buy       = price > liquidity_base and price < hh and not in_trade

// Session condition (e.g. trading between 9AM–12PM)
session_condition = (hour >= 9 and hour <= 12) or not session_filter

if (point_of_release or retest_buy) and (vol_condition or not vol_filter) and session_condition
    strategy.entry("Buy", strategy.long)
    take_profit := price + (atr * take_profit_mult)
    stop_loss   := liquidity_base - (atr * stop_loss_mult)
    in_trade    := true
    alert("Buy Signal - Price: " + str.tostring(price), alert.freq_once_per_bar)

//──────────────────────────────
// ENTRY LOGIC (SELL) Based on Liquidity & ATR
//──────────────────────────────
breakout_down = price < apex - (atr * atr_threshold)
clean_break   = ta.crossunder(price, apex) and breakout_down
retest_sell   = price < apex and price > ll and not in_trade

if (clean_break or retest_sell) and (vol_condition or not vol_filter) and session_condition
    strategy.entry("Sell", strategy.short)
    take_profit := price - (atr * take_profit_mult)
    stop_loss   := apex + (atr * stop_loss_mult)
    in_trade    := true
    alert("Sell Signal - Price: " + str.tostring(price), alert.freq_once_per_bar)

//──────────────────────────────
// EXIT LOGIC (For BUY & SELL)
//──────────────────────────────
if strategy.position_size > 0
    if price >= take_profit
        strategy.close("Buy", comment="Take Profit")
        win_count += 1
        in_trade := false
    if price <= stop_loss
        strategy.close("Buy", comment="Stop Loss")
        loss_count += 1
        in_trade := false

if strategy.position_size < 0
    if price <= take_profit
        strategy.close("Sell", comment="Take Profit")
        win_count += 1
        in_trade := false
    if price >= stop_loss
        strategy.close("Sell", comment="Stop Loss")
        loss_count += 1
        in_trade := false

//──────────────────────────────
// Plot Liquidity Lines (Support/Resistance)
//──────────────────────────────
plot(showLiquidityLines ? liquidity_base : na, color=color.green, title="Liquidity Base (Support)")
plot(showLiquidityLines ? apex : na, color=color.red, title="Apex (Resistance)")

//──────────────────────────────
// Debugging Signal Shapes
//──────────────────────────────
plotshape(series=point_of_release, location=location.belowbar, color=color.green, style=shape.triangleup, title="Buy Signal")
plotshape(series=clean_break, location=location.abovebar, color=color.red, style=shape.triangledown, title="Sell Signal")

//──────────────────────────────
// Win/Loss Table Display
//──────────────────────────────
var table t = table.new(position.top_right, 1, 2)
if bar_index == last_bar_index
    table.cell(t, 0, 0, "Wins: " + str.tostring(win_count), bgcolor=color.new(color.green, 80))
    table.cell(t, 0, 1, "Losses: " + str.tostring(loss_count), bgcolor=color.new(color.red, 80))

//──────────────────────────────
// Alert Conditions for Entries and Exits
//──────────────────────────────
alertcondition(point_of_release, title="Buy Alert", message="Buy Signal Triggered")
alertcondition(clean_break, title="Sell Alert", message="Sell Signal Triggered")
var int lastClosedTrades = 0
var bool exitSignal = false
if strategy.closedtrades > lastClosedTrades
    exitSignal := true
    lastClosedTrades := strategy.closedtrades
alertcondition(exitSignal, title="EXIT Signal", message="EXIT signal triggered: Trade has closed (TP or SL reached).")

//──────────────────────────────
// FIRST 15-MINUTE CANDLE CAPTURE (9:30–9:45 AM EST)
//──────────────────────────────
newDay = dayofmonth != dayofmonth[1]
var float fHigh = na
var float fLow  = na
var bool  firstCandleCaptured = false
if newDay
    fHigh := high
    fLow  := low
    firstCandleCaptured := true

//──────────────────────────────
// Additional Filters & Calculations
//──────────────────────────────
// Trend Filter: 50 EMA
ema50       = ta.ema(close, 50)
longFilter  = not useTrendFilter or (close > ema50)
shortFilter = not useTrendFilter or (close < ema50)

// ATR-Based Stop Loss Buffer
atrValue       = ta.atr(14)
stopLossBuffer = atrValue * atrMultiplier

// RSI Calculation (if enabled)
rsiValue = ta.rsi(close, rsiPeriod)

//──────────────────────────────
// ENTRY CONDITIONS (15-Minute Candle Retest)
//──────────────────────────────
// Breakout/Breakdown based on the first candle levels
buyBreakout   = firstCandleCaptured and ta.crossover(close, fHigh)
sellBreakdown = firstCandleCaptured and ta.crossunder(close, fLow)
// Retest conditions: price must retest the level after the breakout/breakdown
buyRetest  = firstCandleCaptured and (low <= fHigh) and (close > fHigh)
sellRetest = firstCandleCaptured and (high >= fLow) and (close < fLow)
// Final entry signals (with optional RSI filter)
buySignal  = buyBreakout and buyRetest and longFilter and (strategy.position_size == 0) and (not useRSIFilter or (rsiValue < rsiOversold))
sellSignal = sellBreakdown and sellRetest and shortFilter and (strategy.position_size == 0) and (not useRSIFilter or (rsiValue > rsiOverbought))

//──────────────────────────────
// Trade Parameters for 15-Minute Candle Retest
//──────────────────────────────
candleRange    = fHigh - fLow
stopLossBuy    = fLow - stopLossBuffer
takeProfitBuy  = fHigh + (candleRange * riskRewardRatio)
stopLossSell   = fHigh + stopLossBuffer
takeProfitSell = fLow - (candleRange * riskRewardRatio)

//──────────────────────────────
// Execute Trades for 15-Minute Candle Retest
//──────────────────────────────
if buySignal
    strategy.entry("BUY", strategy.long)
    strategy.exit("TP/SL BUY", "BUY", stop=stopLossBuy, limit=takeProfitBuy)

if sellSignal
    strategy.entry("SELL", strategy.short)
    strategy.exit("TP/SL SELL", "SELL", stop=stopLossSell, limit=takeProfitSell)

//──────────────────────────────
// Plot First Candle Level Lines (Optional)
//──────────────────────────────
plot(showFirstCandleLines and firstCandleCaptured ? fHigh : na, title="First Candle High", color=color.blue, linewidth=2)
plot(showFirstCandleLines and firstCandleCaptured ? fLow : na, title="First Candle Low", color=color.red, linewidth=2)