
2
Follow
502
Followers
概要
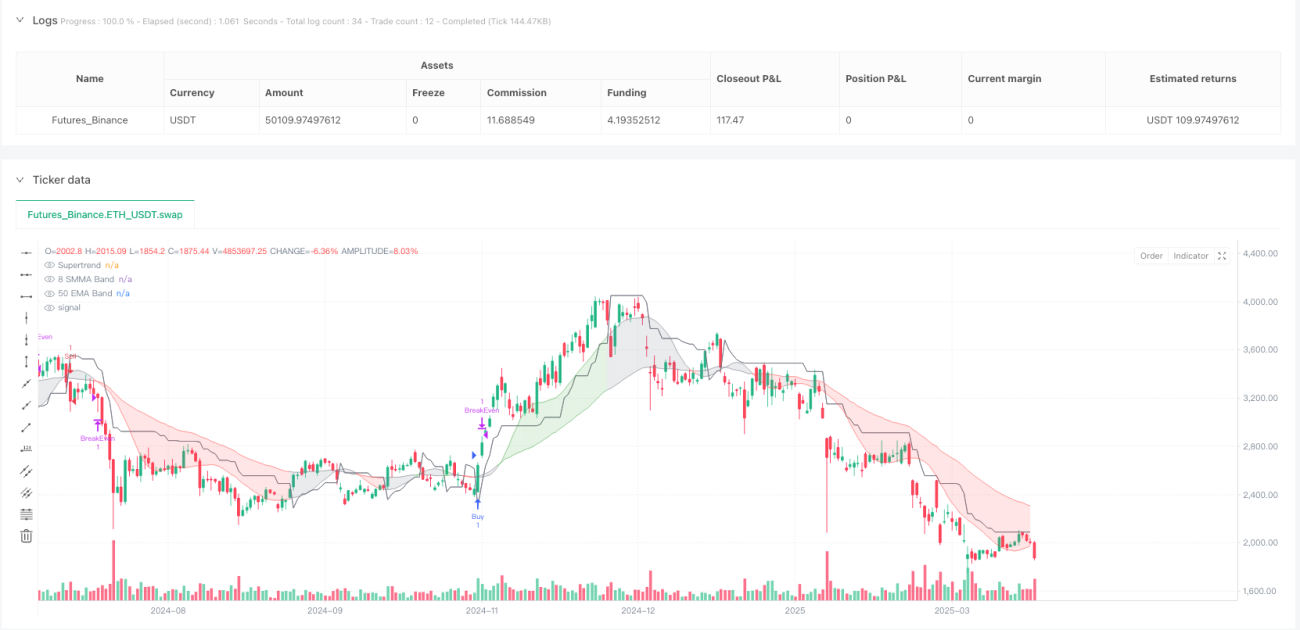
これは、平均真実範囲(ATR)に基づくトレンド追従戦略であり、複数のテクニカル指標を組み合わせて高確率の取引を捉えることを目的としています。本戦略は、ATRフィルター、スーパートレンド指標、指数移動平均(EMA)と単純移動平均(SMMA)のトレンドバンド、相対力指数(RSI)による確認、および動的ストップロスシステムを統合し、包括的で柔軟な取引アプローチを提供します。
戦略の原理
戦略の核心原理は、複数のテクニカル指標の協調動作に基づいています。
-
トレンド識別:スーパートレンド指標(パラメータ:ファクター2、期間5)と50日EMAおよび8日SMMAトレンドバンドを使用して市場トレンドの方向性を定義します。トレンドは色分けされます:
- 緑:強気トレンド
- 赤:弱気トレンド
- グレー:中立フェーズ
-
ATRスマートフィルター:14期間ATRと50期間単純移動平均によりボラティリティの拡大を検出し、ATRが上昇しているか、またはそのSMAの101%を超えている場合のみ取引を行うことで、強いトレンド時のみエントリーを確保します。
-
エントリー条件:
- ロングエントリー:価格が50日EMAを上回り、スーパートレンドが強気、RSI > 45、ATRがトレンド強度を確認
- ショートエントリー:価格が50日EMAを下回り、スーパートレンドが弱気、RSI < 45、ATRがトレンド強度を確認
-
動的ストップロスと利確:
- 利確:5倍ATRに基づく適応型利確
- ストップロス:3.5倍ATRのトレーリングストップ
- ブレークイーブンストップ:価格が2倍ATR分動いた後に作動
- 固定ストップロス:0.8倍ATR乗数を使用してリスク管理
戦略の利点
- ボラティリティの低い領域での取引を避け、不安定な市場を効果的にフィルタリング
- 過剰取引を防止し、利確ロック機構により早期の再エントリーを回避
- 強いトレンドを捉え、トレーリングストップにより利益を継続
- ドローダウンを低減し、ATRベースのストップロスが大きな損失を防止
- パラメータ調整が可能で、異なる市場に合わせてATR乗数、ストップロス、利確、RSIフィルターを微調整可能
戦略のリスク
- テクニカル指標への過度な依存により、偽シグナルが発生する可能性
- レンジ相場ではパフォーマンスが低下する可能性
- パラメータ設定の不適切が取引コストを増加させる可能性
- RSI確認により急激なトレンド変化を見逃す可能性
戦略の最適化方向
- 機械学習アルゴリズムを導入し、パラメータを動的に調整
- 出来高確認などの追加フィルターを追加
- 異なる市場および時間枠における最適なパラメータ組み合わせを探索
- 複数時間枠検証メカニズムの開発
まとめ
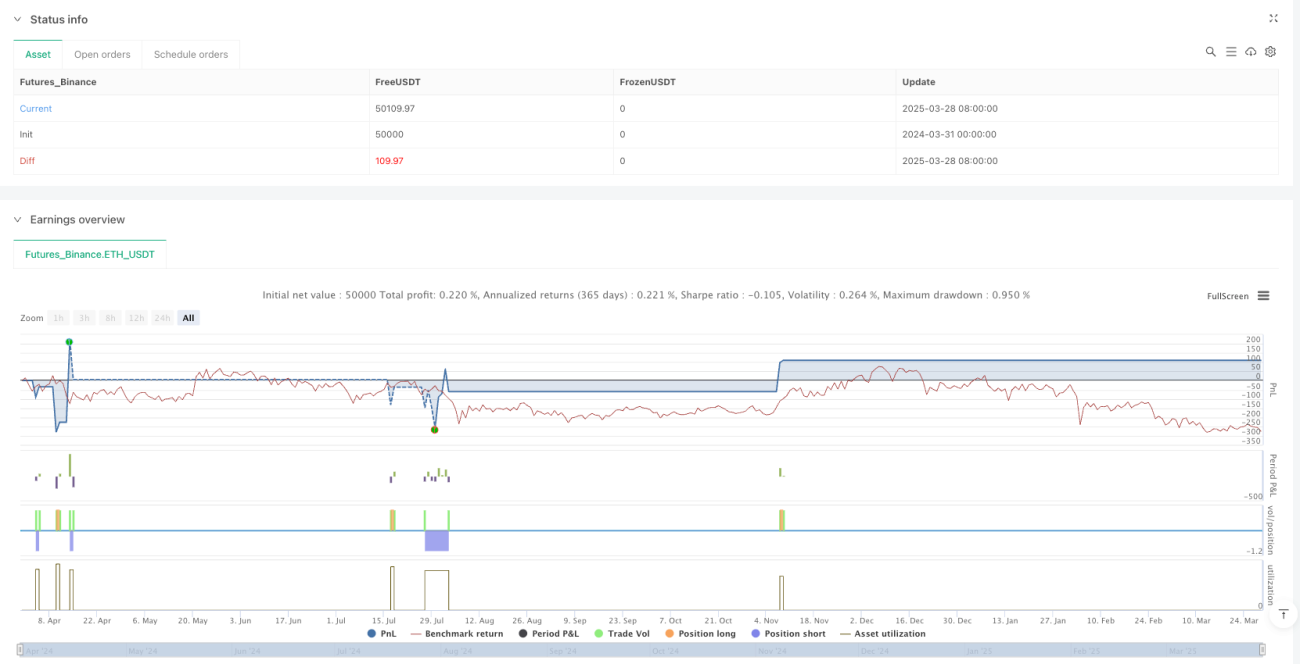
これは高度なトレンド追従戦略であり、複数指標の協調と動的リスク管理により、トレーダーに柔軟で強力な取引ツールを提供します。継続的なバックテストと最適化が、この戦略を成功裏に適用するための鍵となります。
Source
Pine
Strategy parameters
Related strategies
Comment
All comments (0)
No data
- 1