ダイナミックRSI高低値ダイバージェンストレンド戦略

2
Follow
502
Followers
概要
本稿では、相対力指数(RSI)に基づく低高ポイントのダイバージェンストレンド取引戦略について詳述します。この戦略は、価格とRSI指標の間のダイバージェンスを識別することで潜在的なトレンド反転の機会を捉え、トレーダーに正確なエントリーとエグジットのシグナルを提供します。視覚的なシグナルとテクニカル指標分析を独自に組み合わせ、取引判断の精度とタイムリーさを向上させることを目的としています。
戦略の原理
戦略の核心原理は、相対力指数(RSI)の低高ポイントダイバージェンス理論に基づいています。具体的な実装は以下の重要なステップを含みます。
- RSI指標の計算:14期間のRSI長を使用し、現在の市場の買われすぎ・売られすぎ状態を評価します。
- 価格の極値の識別:ルックバック期間を用いて安値と高値を特定します。
- ダイバージェンス判定メカニズム:
- 強気のダイバージェンス:価格が新たな安値を付ける一方、RSI指標が同期して下落しない場合
- 弱気のダイバージェンス:価格が新たな高値を付ける一方、RSI指標が同期して上昇しない場合
- シグナル生成:
- 売られ過ぎゾーン(30未満)での強気のダイバージェンス
- 買われ過ぎゾーン(70超)での弱気のダイバージェンス
戦略の優位性
- 高精度なシグナル識別:厳格なダイバージェンス条件によるフィルタリングで、誤ったシグナルを低減します。
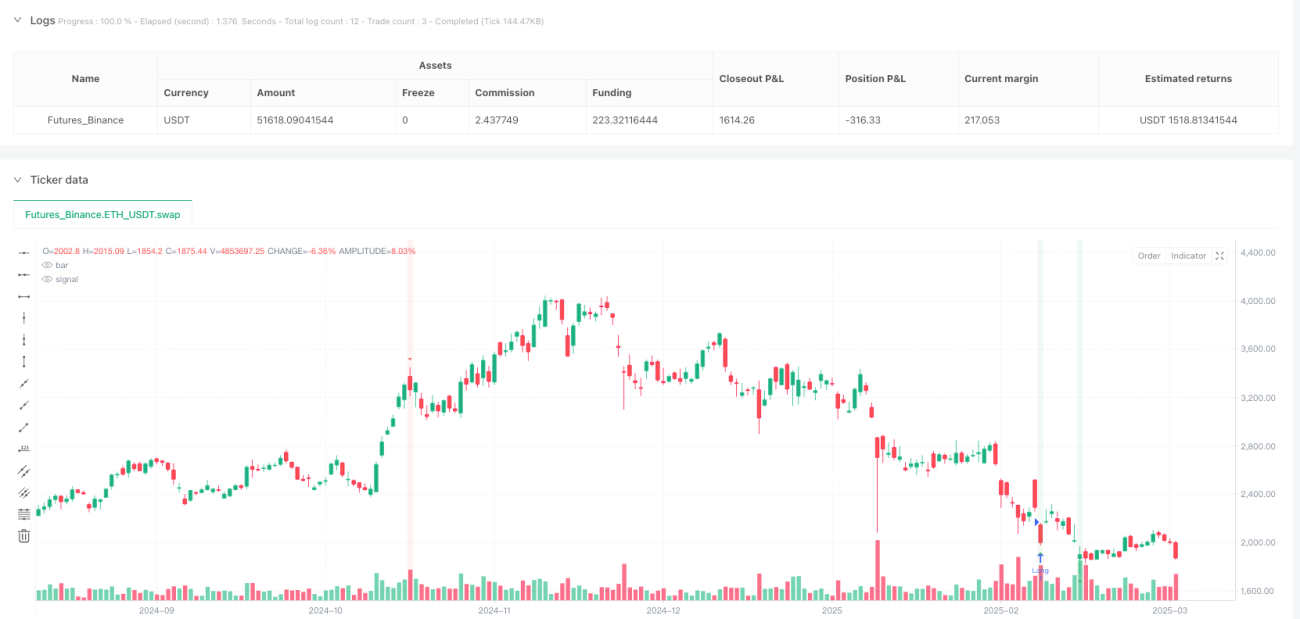
- 視覚的なシグナル表示:大型の三角形マーカーと背景ハイライトを使用し、シグナルの可読性を向上させます。
- 柔軟性の高さ:RSIパラメータ、ルックバック期間、買われ過ぎ・売られ過ぎの閾値を調整可能です。
- 複数時間枠への適応性:1時間足から4時間足でのパフォーマンスが最も優れています。
- デバッグ機能:内蔵のデバッグテーブルにより、主要指標の検証が容易です。
戦略のリスク
- 誤判定リスク:ダイバージェンスシグナルは100%正確ではなく、一定の確率で誤ったシグナルが発生する可能性があります。
- 市場の激しい変動:強いトレンド相場では、ダイバージェンス戦略のパフォーマンスが低下する場合があります。
- パラメータ感受性:RSIパラメータやルックバック期間の不適切な設定は戦略効果を低下させる可能性があります。
- 取引コスト:頻繁な取引により、高い手数料やスリッページコストが発生する可能性があります。
戦略の最適化方向
- 複数指標による確認:移動平均線、MACDなどの指標を組み合わせてシグナルの精度を向上させます。
- 動的パラメータ調整:市場のボラティリティに応じてRSIパラメータをスマートに調整します。
- ストップロスメカニズム:ATRに基づく動的ストップロス戦略を導入します。
- 機械学習による最適化:機械学習アルゴリズムを使用してエントリー・エグジットポイントを動的に最適化します。
- リスク管理:市場のボラティリティに応じてポジションサイズを調整します。
まとめ
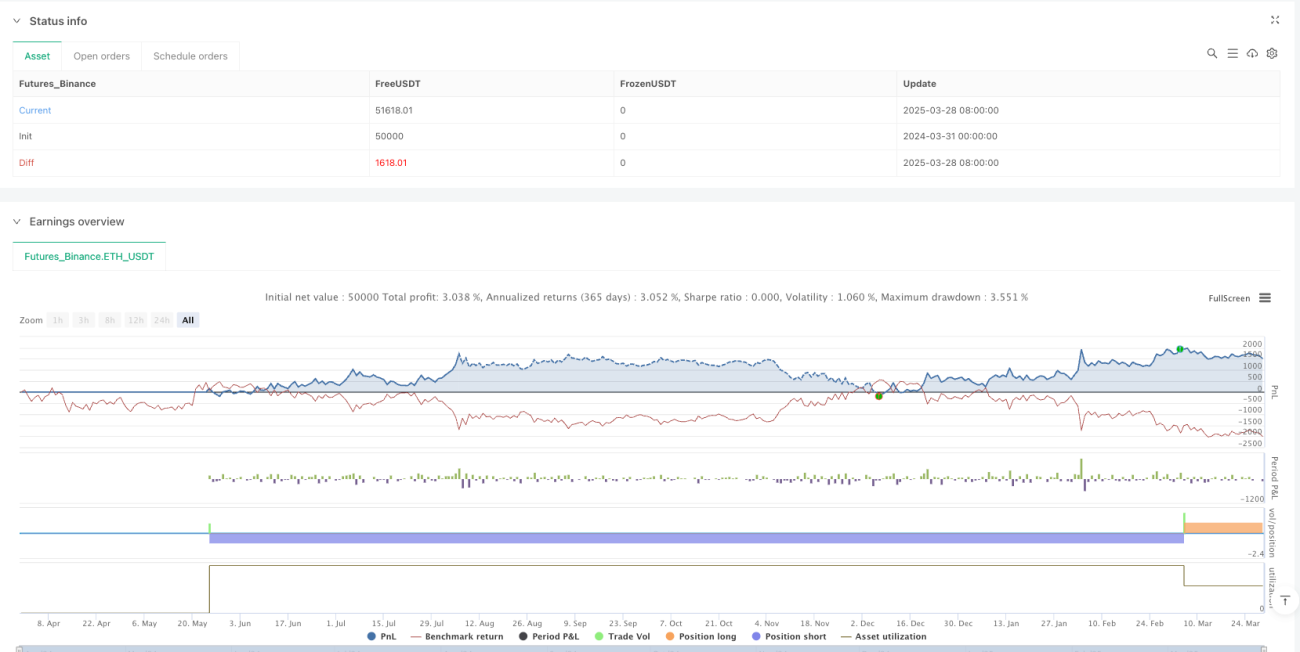
動的RSI低高ポイントダイバージェンストレンド戦略は、正確なテクニカル指標分析と視覚的なシグナルを通じて、トレーダーに比較的高効率なトレンド取引手法を提供します。継続的な最適化とリスク管理により、この戦略は様々な市場環境で安定したパフォーマンスを維持することが期待されます。
Source
Pine
Strategy parameters
Related strategies
Comment
All comments (0)
No data
- 1