
2
Follow
502
Followers
概要
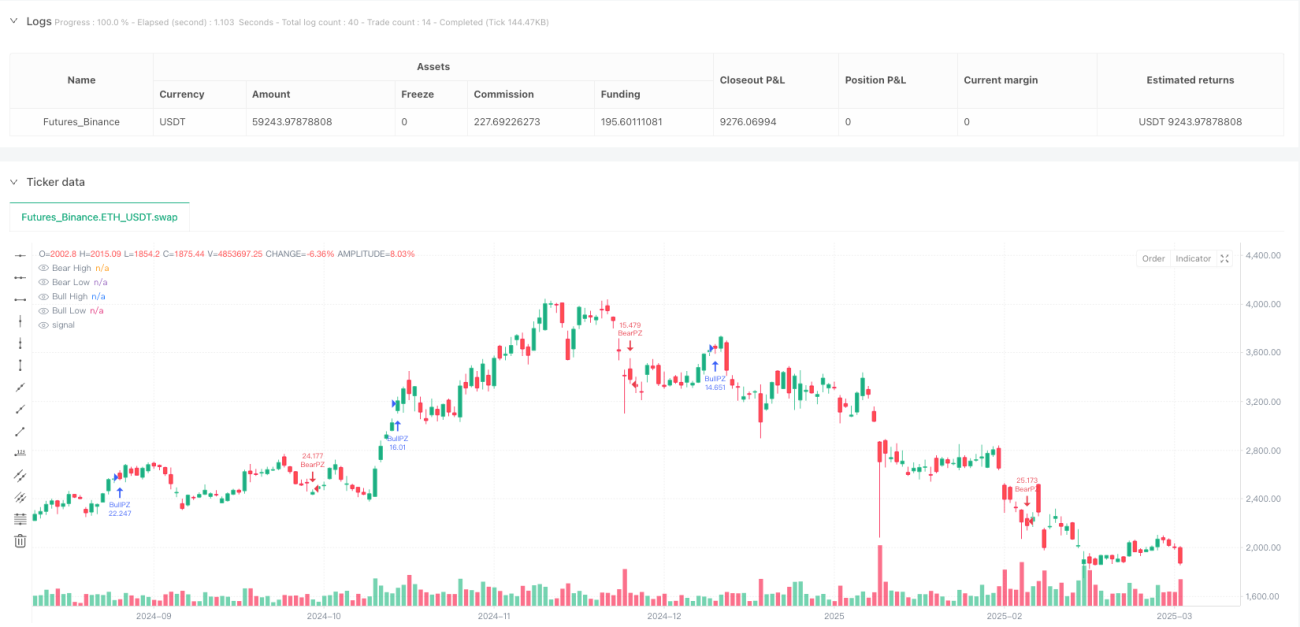
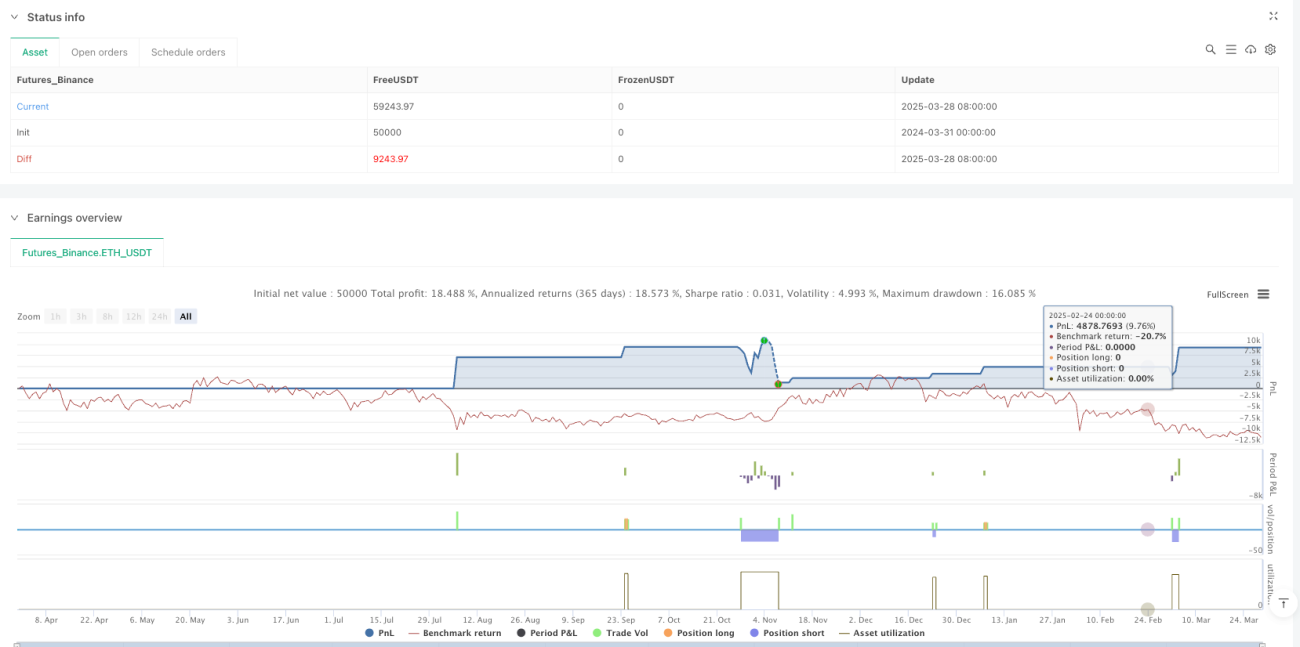
PowerZone取引戦略は、市場における強い価格変動を捉えることに焦点を当てた革新的な自動売買手法です。本戦略は、「PowerZone」と呼ばれる特定の価格ゾーンを識別し、トレーダーに明確なエントリーとエグジットのシグナルを提供すると同時に、リスク管理機能を内蔵しています。
戦略の原理
戦略の核は、以下の2種類のPowerZoneを識別することです。
-
強気 PowerZone (Bullish PowerZone):
- 最初に1本の弱気ローソク足(終値が始値より安い)
- その後、連続する複数のローソク足(デフォルト5本)が上昇トレンドを形成
- 全体の価格変動が事前設定された閾値(デフォルト2%)を超える
-
弱気 PowerZone (Bearish PowerZone):
- 最初に1本の強気ローソク足(終値が始値より高い)
- その後、連続する複数のローソク足が下降トレンドを形成
- 全体の価格変動が事前設定された閾値を超える
戦略の利点
- トレンド転換点の自動識別
- 柔軟なパラメータカスタマイズ機能を内蔵
- 明確な可視化表示
- 自動リスク管理(利確・損切)
- 様々な市場環境に対応可能
- コードがシンプルで理解・修正が容易
戦略のリスク
- パラメータ設定が不適切な場合、過剰取引につながる可能性
- レンジ相場では誤ったシグナルが発生する可能性
- 固定ロットでは1回の損失リスクが増加する可能性
- 高度なフィルター機構が不足
- より広範な市場トレンドやサイクルを考慮していない
戦略の最適化方向
-
追加フィルター条件の導入
- トレンド指標(EMAなど)との組み合わせ
- モメンタム指標(RSIなど)の統合
- 出来高確認メカニズムの追加
-
動的ポジション管理
- 市場のボラティリティに応じてポジションサイズを調整
- リスク割合に基づくポジションコントロールの実施
-
マルチ時間枠検証
- 異なる時間足でのシグナル相互検証
- シグナルの信頼性向上
まとめ
PowerZone取引戦略は、価格の強いゾーンを体系的に識別することで、トレーダーに構造化された取引アプローチを提供します。その主な利点は自動化、可視化、柔軟性にありますが、パラメータの慎重な調整と継続的なリスク管理メカニズムの最適化が必要です。
Source
Pine
/*backtest
start: 2024-03-31 00:00:00
end: 2025-03-29 08:00:00
period: 1d
basePeriod: 1d
exchanges: [{"eid":"Futures_Binance","currency":"ETH_USDT"}]
*/

// This Pine Script® code is subject to the terms of the Mozilla Public License 2.0 at https://mozilla.org/MPL/2.0/
// © tradingbauhaus

//@version=6Strategy parameters
Related strategies
Comment
All comments (0)
No data
- 1