
[翻訳]
概要
多次元ピボットポイント取引戦略と動的フィボナッチインジケーターシステムは、テクニカル分析に基づく取引戦略であり、主に日内ピボットポイント、中枢レンジ(CPR)、フィボナッチリトレースメント水準、出来高加重平均価格(VWAP)、移動平均線などの複数の指標を利用して、潜在的な買いと売りの機会を特定します。この戦略は、特に3分足チャートでの短期的な取引を対象としており、特定条件のローソク足が重要なサポート・レジスタンスラインに接触しているかどうかを判断することで、取引シグナルを発します。
本戦略は、日々の高値、安値、終値から計算されるピボットポイントシステムと、出来高加重平均価格(VWAP)および移動出来高加重平均価格(MVWAP)を動的なサポート・レジスタンスの基準として活用します。同時に、相対力指数(RSI)、単純移動平均線(SMA)、指数平滑移動平均線(EMA)などのテクニカル指標を用いて、包括的な取引判断システムを構築しています。
まず、条件を満たすグリーン(上昇)およびレッド(下落)ローソク足を識別し、次にこれらのローソク足がピボットポイント、サポート、レジスタンス、またはVWAPなどのキープライスレベルに接触しているかどうかを判断します。レッドのローソク足がキープライスレベルに接触した場合、買いシグナル(CE)が発生します。グリーンのローソク足がキープライスレベルに接触した場合、売りシグナル(PE)が発生します。この反転発想は、キープライスレベルで潜在的な反転点を探すという核心理念を反映しています。
戦略の原理
この戦略の原理は、価格が重要なサポート・レジスタンスラインを中心に変動する市場行動に基づき、ローソク足の形状、出来高、モメンタム指標を組み合わせて取引判断を行います。具体的な原理は以下の通りです。
-
ローソク足識別メカニズム:
- グリーンローソク足(上昇):終値が始値より高く、ローソク足の実体が少なくとも17ポイント、始値が安値に0.382倍のローソク足レンジを加えた値より低く、終値が安値に0.682倍のローソク足レンジを加えた値より高い。
- レッドローソク足(下落):終値が始値より低く、ローソク足の実体が少なくとも17ポイント。
-
ピボットポイント計算体系:
- 日次ピボットポイント(PP):(日高値 + 日安値 + 日終値) / 3
- レジスタンスライン:R1、R2、R3、R4
- サポートライン:S1、S2、S3、S4
- 中枢レンジ(CPR):下方CPRと上方CPRで構成され、市場がレンジ内で推移する可能性のある価格帯を提供します。
-
価格の動的基準:
- VWAP(出来高加重平均価格):出来高要因を考慮した平均価格水準を反映。
- MVWAP(移動出来高加重平均価格):VWAPの移動平均で、より平滑な価格基準を提供。
-
補助指標システム:
- RSI:市場の買われすぎ・売られすぎを測定。
- SMA(50期間)およびEMA(20期間):価格トレンド方向の参考を提供。
- 出来高分析:20期間の出来高移動平均線で出来高トレンドを評価。
-
取引シグナル生成:
- 条件を満たすレッドローソク足が任意のピボットポイント、サポート、レジスタンス、またはVWAP/MVWAPに接触した場合、買いシグナル(CE)を生成。
- 条件を満たすグリーンローソク足が任意のピボットポイント、サポート、レジスタンス、またはVWAP/MVWAPに接触した場合、売りシグナル(PE)を生成。
戦略の核心理念は、重要なサポート・レジスタンス付近で価格の潜在的な反転を捉えることであり、特定のローソク足形状と複数のテクニカル指標によるフィルタリングにより、シグナルの有効性を高めます。ピボットポイントに接触したローソク足は、これらのキープライスレベルで市場が迷いや反転の可能性が高まっていることを示すことが多いです。
戦略のメリット
戦略コードを詳細に分析すると、以下の顕著な利点をまとめることができます。
-
多次元検証メカニズム:複数のテクニカル指標(ピボットポイント、VWAP、移動平均線、RSI)を組み合わせて取引シグナルを検証し、偽シグナルのリスクを低減。
-
市場への動的適応:日内のピボットポイントシステムが毎日更新されるため、異なる市場環境やボラティリティに戦略が適応可能。
-
正確なローソク足識別:厳格なローソク足形状条件とフィボナッチ水準により、有望な取引機会を選別し、シグナル品質を向上。
-
柔軟な表示設定:戦略はビュー適応機能を持ち、適切な時間枠(15分未満の日内チャート)でのみピボットポイントを表示し、チャートの乱雑さを軽減。
-
逆張り思考の利点:レッドローソク足がキープライスに接触した場合に買い機会を探し、グリーンローソク足がキープライスに接触した場合に売り機会を探すことで、市場の短期的な買われすぎ・売られすぎ状態を活用。
-
完全な価格階層システム:複数層のサポート・レジスタンス(S1-S4およびR1-R4)を含み、豊富な参照価格を提供し、さまざまな変動幅の市場環境に対応。
-
中枢レンジ(CPR)の統合:CPRは当日の潜在的なレンジ相場ゾーンを識別し、日内取引において重要な参考価値を提供。
-
視覚的補助:豊富なマークや形状表示により、条件を満たすローソク足やキープライスへの接触をチャート上で直感的に識別でき、トレーダーは素早く判断可能。
-
出来高確認:出来高分析を組み合わせ、出来高移動平均線で市場参加度を評価し、シグナルの信頼性を強化。
-
日内取引に最適:短時間枠(特に3分足チャート)向けに設計されており、日内トレーダーが市場の変動を利用して頻繁に取引を行うのに適しています。
これらのメリットにより、本戦略は総合性が高く、適応性に優れた日内取引システムとなり、特にテクニカル分析にある程度精通し、価格行動とキープライスレベルに基づいて取引を行いたい投資家に適しています。
戦略のリスク
本戦略には多くの利点がある一方で、トレーダーが慎重に対処すべき潜在的なリスクも存在します。
-
過剰シグナルリスク:複数のピボットポイント(PP、R1-R4、S1-S4)やその他の指標が関与するため、ボラティリティの高い市場では過剰なシグナルが発生し、取引頻度の増加や手数料の負担増につながる可能性があります。
- 解決策:取引時間帯の制限やトレンド確認条件など、追加のフィルターを追加することを検討。
-
逆張り取引の落とし穴:戦略は逆張りロジック(レッドローソク足がキープライスに接触→買い、グリーンローソク足がキープライスに接触→売り)に基づいており、強いトレンド相場では連続損失につながる可能性があります。
- 解決策:戦略を使用する前に、全体的な市場トレンドを評価し、強いトレンドでの逆張り取引を避けるためにトレンドフィルターを追加。
-
パラメータ感度:戦略の効果は、ローソク足識別パラメータ(例:ローソク足の実体が17ポイント以上)や移動平均線の期間設定に大きく依存し、市場環境によって異なるパラメータが必要となる場合があります。
- 解決策:異なる銘柄や市場条件でバックテストを実施し、パラメータを最適化。
-
ストップロスの欠如:コード内に明確なストップロス戦略が設定されておらず、1回の損失が過大になる可能性があります。
- 解決策:ATRベースの動的ストップロスや固定ポイントストップロスなど、明確なストップロス戦略を実装。
-
日内戦略の限界:3分足チャートに特化した日内戦略であるため、中長期的な保有には適さず、長期的なトレンドの機会を逃す可能性があります。
- 解決策:この戦略を取引システムの一部として位置づけ、中長期戦略と組み合わせて使用。
-
ピボットポイントの限界:レンジ相場では、価格が複数のピボットポイントに頻繁に接触し、混乱したシグナルが発生する可能性があります。
- 解決策:レンジ相場では一時的に戦略を停止するか、シグナル確認条件を追加。
-
出来高に基づく重み調整の欠如:VWAPを使用しているものの、出来高の大きさに応じてシグナルの重みを動的に調整していません。
- 解決策:出来高のしきい値条件を追加し、十分な市場参加がある場合にのみ取引を行う。
-
時間依存性:日次ピボットポイントは前日のデータに基づくため、新しい取引日の開始時には当日の十分なデータが不足し、不安定な動作をする可能性があります。
- 解決策:取引開始から30~60分後に戦略を有効にし、十分な市場情報を取得してから使用。
-
自動化実施の課題:戦略には複数の条件判断が含まれるため、実際の自動実行時に遅延や実行タイミングの問題が発生する可能性があります。
- 解決策:実行システムを最適化して低遅延を確保するか、半自動方式で人間による確認と組み合わせる。
-
バックテストバイアスのリスク:コード内のグリーン/レッドローソク足の識別ロジックは、バックテストと実際の取引環境で一貫性がない可能性があります。
- 解決策:厳格なリアルタイム模擬テストを実施し、戦略が実際の取引環境でも有効であることを確認。
これらのリスクを認識し管理することは、本戦略を成功裏に適用する上で重要であり、トレーダーは自身のリスク許容度と取引スタイルに応じて適切に調整する必要があります。
戦略の最適化の方向性
コードの詳細な分析に基づき、以下は本戦略の最適化可能な主な方向性です。
-
動的ローソク足識別パラメータ:
- 現在の戦略では固定値(例:ローソク足の実体が17ポイント以上)を使用して有効なローソク足を識別していますが、ATR(平均真のレンジ)ベースの動的パラメータに変更することで、異なるボラティリティ環境への適応性を高められます。
- 最適化理由:固定パラメータはボラティリティ環境によって効果が大きく異なり、動的パラメータにより戦略の適応性が向上します。
-
トレンドフィルターシステム:
- より高い時間枠(例:15分足や30分足)のトレンド判断を追加し、メイントレンド方向にのみ取引を実行するか、シグナルの重みを調整します。
- 最適化理由:強いトレンドでの逆張り取引を回避し、勝率とリスクリワード比を向上。
-
シグナル品質スコアリングメカニズム:
- 各取引シグナルに総合スコアリングシステムを導入し、ローソク足の強さ、接触したピボットポイントの重要性、RSI値、出来高の異常など複数の要素を考慮。
- 最適化理由:すべてのシグナルの質が同じとは限らず、スコアリングシステムにより低品質なシグナルをフィルタリングし、取引効率を向上。
-
資金管理の統合:
- シグナルの強さや市場条件に応じてポジションサイズを動的に調整し、高確度の機会ではポジションを増やし、低確度の場合はリスクエクスポージャーを削減。
- 最適化理由:効果的な資金管理は長期的な収益に不可欠であり、戦略のパフォーマンスを大幅に改善。
-
複数時間枠の確認:
- シグナル生成前に複数の時間枠(例:3分足と15分足チャート)の条件一致を確認し、一致した場合のみ取引を実行。
- 最適化理由:複数時間枠の確認により誤シグナルの確率を低減し、取引の精度を向上。
-
ストップロスとテイクプロフィットのメカニズム:
- ボラティリティベースの動的ストップロスやキー構造位置ストップロスなどのスマートストップロスシステムを実装し、同時に自動テイクプロフィット目標を設定。
- 最適化理由:完全なリスク管理は大きなドローダウンの回避と利益の保護に不可欠。
-
取引時間帯フィルター:
- 効率的な取引時間帯と非効率な時間帯を識別し、市場のボラティリティが低い時間帯や混乱した時間帯(例:昼休憩時間、相場の寄り付き前後など)を避ける。
- 最適化理由:時間帯により市場行動の特徴が異なるため、選択的な取引により全体的な効率を向上。
-
適応型インジケーターパラメータ:
- 固定のテクニカル指標パラメータ(例:RSIの14期間、EMAの20期間)を、市場状態に基づいて自動調整されるパラメータに変更。
- 最適化理由:市場条件が変化すれば最適な指標パラメータも変化するため、指標の感度を向上。
-
市場環境の分類:
- アルゴリズムを追加して現在の市場環境(トレンド、レンジ、高ボラティリティなど)を自動認識し、異なる環境に応じて異なるパラメータ設定を適用。
- 最適化理由:単一のパラメータ設定ではすべての市場環境で最適なパフォーマンスを発揮できず、環境適応型の調整により戦略の安定性が大幅に向上。
-
機械学習による強化:
- 機械学習モデルを統合してシグナルの成功確率を予測し、履歴パターン認識に基づいて取引シグナルの選別と優先順位付けを行うことを検討する。
- 改善理由:機械学習は人手では発見困難な複雑なパターンを発見でき、戦略のインテリジェント化レベルを向上させる。
以上の最適化方向を実施することで、本戦略は従来の利点を維持しつつ、適応性、正確性、長期的収益性を大幅に向上させ、様々な市場環境の課題にうまく対応できるようになる。
まとめ
多次元ピボットポイント取引戦略と動的フィボナッチ指標システムは、総合性が高く構造が整ったデイトレード戦略システムである。伝統的なテクニカル分析ツール(ピボットポイント、フィボナッチリトレースメント、移動平均線)と現代的な動的指標(VWAP、CPR)を巧みに組み合わせ、厳格なローソク足条件フィルターと多重指標確認により、トレーダーに有望なデイトレードフレームワークを提供する。
本戦略の核心的な強みは、重要な価格水準を網羅的にカバーし、潜在的反転ポイントを敏感に捉える点にある。厳格なローソク足識別条件を設定することで、無意味な市場ノイズを大量に除去し、確率の高い取引機会に集中できる。同時に、出来高とモメンタム指標を組み合わせることで、シグナルの信頼性をさらに高めている。
しかし、戦略にはシグナルが多すぎる可能性、逆張り取引のリスク、パラメータ最適化の課題などの限界もある。これらの問題に対して、動的パラメータ調整、複数時間枠の確認、スマートな資金管理、市場環境適応など、複数の最適化方向を提案した。これにより、トレーダーは自身のニーズと市場特性に応じて戦略を調整し、全体的な取引効果を高めることができる。
留意すべきは、いかなる取引戦略も「魔法の杖」ではないということである。取引の成功は戦略そのものに加え、トレーダーの忍耐、規律、継続的な学習にも依存する。本戦略については、トレーダーはまずシミュレーション環境で十分にテストし、異なる市場条件下での動作特性を理解し、徐々にパラメータを調整して特定の取引商品と自身のスタイルに適合させ、最終的に個別化された持続可能な収益システムを構築することを推奨する。
継続的な実践、フィードバック、最適化を通じて、多次元ピボットポイント取引戦略と動的フィボナッチ指標システムは、デイトレーダーのツールボックスにおける強力な武器となり、日内市場変動を捉えるための信頼性の高いテクニカル分析フレームワークを提供する。
- トレードシグナルの生成:
- 条件を満たす赤いローソク足が任意のピボットポイント、サポートライン、レジスタンスライン、またはVWAP/MVWAPにタッチした場合、買いシグナル(CE)が生成されます
- 条件を満たす緑のローソク足が任意のピボットポイント、サポートライン、レジスタンスライン、またはVWAP/MVWAPにタッチした場合、売りシグナル(PE)が生成されます
この戦略の核となる考え方は、主要なサポート・レジスタンス付近での潜在的な反転を捉えることであり、特定のローソク足パターンと複数のテクニカル指標でフィルタリングすることでシグナルの有効性を高めます。ピボットポイントにタッチするローソク足は、これらの重要な価格水準で市場の迷いや反転の可能性が高まっていることを示すことが多いです。
戦略の利点
戦略コードを詳細に分析すると、以下の顕著な利点が明らかになります:
-
多次元検証メカニズム: 複数のテクニカル指標(ピボットポイント、VWAP、移動平均線、RSI)を組み合わせてトレードシグナルを検証し、偽シグナルのリスクを低減します。
-
動的な市場適応: 日次ピボットポイントシステムは毎日更新され、戦略が異なる市場環境やボラティリティに適応できるようにします。
-
正確なローソク足識別: 厳格なローソク足パターン条件とフィボナッチレベルを通じて、潜在的な取引機会を選別し、シグナルの質を向上させます。
-
柔軟な表示設定: 戦略はビュー適応機能を備えており、適切な時間足(15分未満の日中チャート)でのみピボットポイントを表示するため、チャートの乱雑さを軽減します。
-
逆張り思考の利点: この戦略は、赤いローソク足が重要な水準にタッチしたときに買い機会を、緑のローソク足がタッチしたときに売り機会を探すことで、潜在的な短期的な過熱感や売られ過ぎを利用します。
-
完全な価格水準の階層: 複数のサポート・レジスタンス層(S1~S4、R1~R4)を含み、豊富な参照価格を提供し、異なる変動幅の市場環境に適しています。
-
統合された中央ピボットレンジ(CPR): CPRは当日の潜在的な保ち合いゾーンの識別を提供し、日中取引において重要な参考価値があります。
-
視覚的補助: 豊富なマーカーと形状により、条件を満たすローソク足や重要な価格水準へのタッチ事例がチャート上に直感的にマークされるため、トレーダーは迅速に識別できます。
-
出来高確認: 出来高分析を組み込み、出来高移動平均線を通じて市場参加度を評価し、シグナルの信頼性を高めます。
-
日中取引に適している: この戦略は短い時間足(特に3分足)向けに特別に設計されており、頻繁な取引で市場変動を活用したい日内トレーダーに適しています。
これらの利点により、この戦略は強力で適応性のある日中取引システムとなっており、特にテクニカル分析を理解し、価格アクションと重要な価格水準に基づいて取引したい投資家に適しています。
戦略のリスク
多くの利点がある一方で、この戦略にはトレーダーが注意すべき潜在的なリスクもいくつか存在します:
-
過剰シグナルリスク: 戦略が複数のピボットポイント(PP、R1~R4、S1~S4)や他のインジケーターを扱うため、ボラティリティの高い市場では多くのシグナルが発生し、頻繁な取引と手数料増加につながる可能性があります。
- 解決策: 追加のフィルタリング条件(例:取引時間帯の制限やトレンド確認条件)を加えることを検討してください。
-
逆張り取引の罠: 戦略は逆張りロジック(赤いローソク足が重要水準にタッチしたら買い、緑のローソク足がタッチしたら売り)に基づいており、強いトレンド相場では連続した損失につながる可能性があります。
- 解決策: 戦略を使用する前に全体的な市場トレンドを評価し、強いトレンドでは逆張りを避けるためのトレンドフィルターを追加してください。
-
パラメータ感度: 戦略の有効性は、ローソク足識別パラメータ(例:ローソク足の高さが17ポイント以上)や移動平均線の期間設定に大きく依存しており、異なる市場環境では異なるパラメータが必要となる可能性があります。
- 解決策: 異なる銘柄や市場状況でバックテストを行い、パラメータ設定を最適化する。
-
ストップロスメカニズムの欠如: コード内に明確なストップロス戦略が設定されておらず、1回のトレードで過大な損失が発生する可能性があります。
- 解決策: ATRベースの動的ストップロスや固定ポイントストップロスなど、明確なストップロス戦略を実装する。
-
デイトレード戦略の限界: 3分足に特化した戦略であるため、中長期保有には適さず、長期的なトレンドの機会を逃す可能性があります。
- 解決策: この戦略を取引システムの一部として捉え、中長期戦略と併用する。
-
ピボットポイントの限界: レンジ相場では、価格が複数のピボットポイントに頻繁にタッチし、混乱を招くシグナルが発生する可能性があります。
- 解決策: レンジ相場では戦略を一時的に無効にするか、シグナル確認条件を追加することを検討する。
-
出来高加重の調整不足: VWAPを使用しているものの、出来高の大きさに基づいてシグナルの重みを動的に調整していません。
- 解決策: 出来高の閾値条件を追加し、十分な市場参加がある場合にのみ取引が行われるようにする。
-
時間依存性: 日次のピボットポイントは前日のデータに基づいており、新しい取引日の開始時点では当日のデータが不足しているため、不安定なパフォーマンスとなる可能性があります。
- 解決策: 取引開始から30~60分後に戦略を有効にし、十分な市場情報が得られるようにすることを検討する。
-
自動化実装の課題: この戦略は複数の条件判定を含むため、実際の自動実行時に遅延やタイムリーな実行ができない可能性があります。
- 解決策: 実行システムを最適化して低レイテンシを確保するか、手動確認を組み合わせた半自動化アプローチを検討する。
-
バックテストバイアスのリスク: コード内の陽線・陰線の識別ロジックは、バックテスト環境と実際の取引環境で一貫性が取れない可能性があります。
- 解決策: 厳格なライブシミュレーションテストを実施し、実際の取引環境でも戦略が有効であることを確認する。
これらのリスクを認識し、適切に管理することは、この戦略を成功させる上で極めて重要です。トレーダーは、自身のリスク許容度や取引習慣に基づいて適切な調整を行う必要があります。
戦略の最適化の方向性
コードの詳細な分析に基づき、この戦略を最適化するための主要な方向性は以下の通りです。
-
動的ローソク足識別パラメータ:
- 現在の戦略では、有効なローソク足を識別するために固定値(例:ローソク足の高さが少なくとも17ポイント)を使用しています。これをATR(平均真の範囲)に基づく動的パラメータに変更することで、異なるボラティリティ環境により適応できるようになります。
- 最適化の根拠: 固定パラメータは様々なボラティリティ環境で異なるパフォーマンスを示すため、動的パラメータにより戦略の適応性が向上します。
-
トレンドフィルタリングシステム:
- より上位の時間軸(例:15分足や30分足)からトレンド判定を追加し、メイントレンドの方向にのみ取引を実行するか、シグナルの重みを調整します。
- 最適化の根拠: 強いトレンドにおける逆張り取引を回避し、勝率とリスクリワード比を向上させます。
-
シグナル品質スコアリングメカニズム:
- 各取引シグナルに対して総合スコアリングシステムを構築し、ローソク足の強さ、タッチしたピボットポイントの重要度、RSI値、出来高異常などの複数の要素を考慮します。
- 最適化の根拠: すべてのシグナルの品質が同じとは限らないため、スコアリングシステムにより低品質のシグナルをフィルタリングし、取引効率を向上させます。
-
資本管理の統合:
- シグナルの強さや市場の状況に応じてポジションサイズを動的に調整し、確率の高い機会にはポジションを増やし、確率の低い状況ではリスクエクスポージャーを低減します。
- 最適化の根拠: 効果的な資本管理は長期的な収益性にとって極めて重要であり、戦略パフォーマンスを大幅に向上させる可能性があります。
-
複数時間枠での確認:
- シグナルを生成する前に、複数の時間枠で条件の一致性を確認します。例えば、3分足と15分足のシグナルが一致した場合のみ取引を行います。
- 最適化の根拠: 複数時間枠での確認により、誤ったシグナルの発生確率を低減し、取引精度を向上させることができます。
-
ストップロスと利確メカニズム:
- ボラティリティに基づく動的ストップロスや主要な構造的ポジションのストップロスなど、スマートなストップロスシステムを実装し、同時に自動利確目標を設定します。
- 最適化の根拠: 適切なリスク管理は、大きなドローダウンを回避し、利益を保護するために極めて重要です。
-
取引時間フィルター:
- 効率的な取引時間帯と非効率な時間帯を特定し、市場のボラティリティが低い時間帯や混乱しやすい時間帯(ランチタイムや寄り付き前後、引け前後など)を避けます。
- 最適化の根拠: 市場の特性は時間帯によって異なり、選択的に取引を行うことで全体的な効率を向上させることができます。
-
適応型インジケーターパラメータ:
- 固定されたテクニカル指標パラメータ(例: 14期間RSI、20期間EMA)を、市場の状態に応じて自動調整されるパラメータに変更します。
- 最適化の根拠: 市況が変化すると、最適な指標パラメータもそれに応じて調整されるべきであり、指標の感度を向上させることができます。
-
市場環境の分類:
- 現在の市場環境(トレンド相場、レンジ相場、高ボラティリティなど)を自動識別するアルゴリズムを追加し、環境に応じて異なるパラメータ設定を適用します。
- 最適化の根拠: 単一のパラメータ設定では、すべての市場環境で最適なパフォーマンスを発揮することは困難です。環境適応型の調整により、戦略の安定性を大幅に高めることができます。
-
機械学習による強化:
- 機械学習モデルを統合し、シグナルの成功確率を予測することで、過去のパターン認識に基づいて取引シグナルをフィルタリングし、優先順位を付けることを検討します。
- 最適化の根拠: 機械学習は人間が識別するのが難しい複雑なパターンを発見でき、戦略の知的レベルを向上させることができます。
これらの最適化方向を実施することで、戦略は本来の利点を維持しながら、適応性、精度、長期的な収益性を大幅に向上させ、様々な市場環境下での課題により適切に対応できるようになります。
まとめ
「ダイナミックフィボナッチインジケーターを活用した多次元ピボットポイント取引システム」は、総合的でよく構成されたデイトレード戦略システムです。伝統的なテクニカル分析ツール(ピボットポイント、フィボナッチリトレースメント、移動平均線)と現代的な動的指標(VWAP、CPR)を巧みに組み合わせています。厳格なローソク足条件のスクリーニングと複数指標による確認を通じて、トレーダーに有望なデイトレードのフレームワークを提供します。
この戦略の核となる強みは、主要な価格水準を網羅的にカバーし、潜在的な反転ポイントを敏感に捉える点にあります。厳格なローソク足識別条件を設定することで、戦略は意味のない市場ノイズの多くをフィルタリングし、確率の高い取引機会に焦点を当てることができます。同時に、出来高やモメンタム指標の使用により、シグナルの信頼性がさらに向上します。
ただし、この戦略にはいくつかの制限もあります。例えば、過剰なシグナル、逆張りリスク、パラメータ最適化の課題などです。これらの問題に対処するために、動的パラメータ調整、複数時間枠の確認、インテリジェントな資金管理、市場環境への適応など、いくつかの最適化の方向性を提案しました。これらの最適化により、トレーダーは自分のニーズや市場特性に応じて戦略を調整し、全体的な取引効果を向上させることができます。
注目すべきは、どの取引戦略も「魔法の弾丸」ではないということです。成功した取引は戦略そのものだけでなく、トレーダーの忍耐、規律、そして継続的な学習にも依存します。この戦略については、まずシミュレーション環境で徹底的にテストし、異なる市場条件でのパフォーマンス特性に慣れ、徐々にパラメータを調整して特定の取引銘柄や個人のスタイルに適応させ、最終的に個別化された持続可能な収益性のある取引システムを形成することを推奨します。
継続的な実践、フィードバック、最適化を通じて、動的フィボナッチ指標を備えた多次元ピボットポイント取引システムは、デイトレーダーのツールボックスにおける強力な武器となり、短期的な市場機会を捉えるための信頼性の高いテクニカル分析フレームワークを提供することができます。
この戦略は、伝統的なピボットポイントと現代のテクニカルツールを統合することで、市場構造を尊重しつつ、日中価格変動に応答するバランスの取れたアプローチを生み出します。重要な価格水準での主要な価格インタラクションに焦点を当てることで、トレーダーは市場心理をより深く理解し、取引パフォーマンスを向上させる可能性があります。
最終的に、成功裡の実装には、思慮深いカスタマイズ、厳格なテスト、そして規律ある実行が必要です。適切なリスク管理原則を含む包括的な取引計画の一部として適切に適用された場合、この戦略は、より大きな自信と精度を持って日中市場の複雑さをナビゲートするための体系的な方法を提供します。
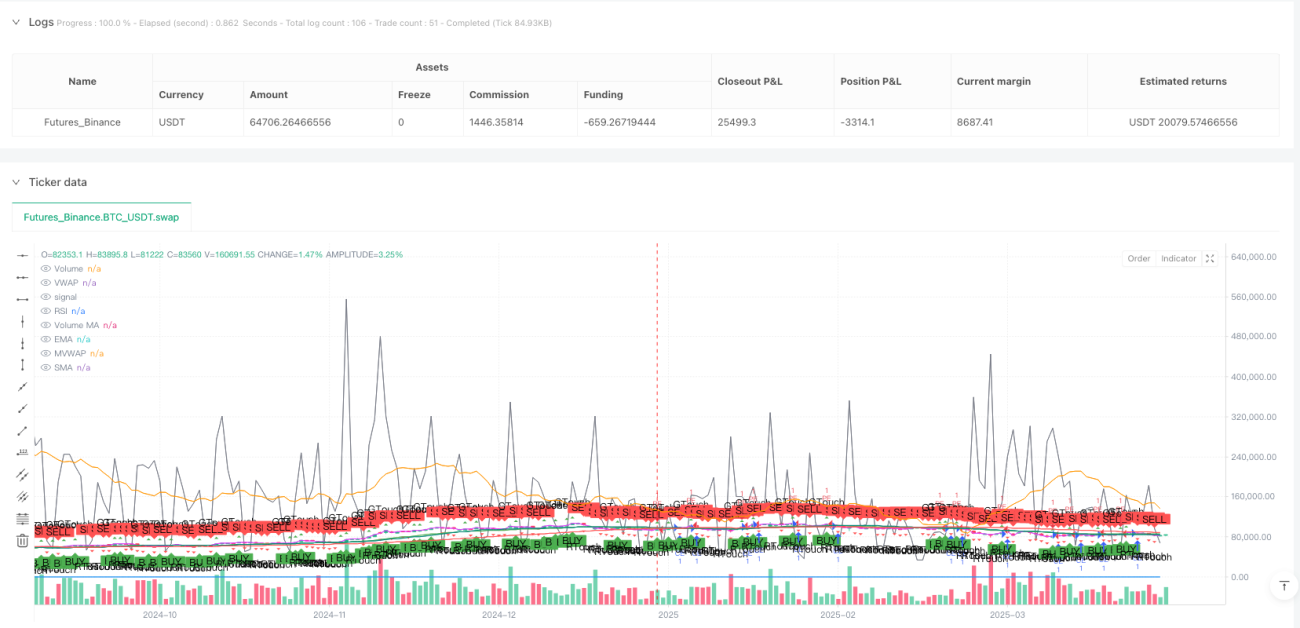
/*backtest
start: 2025-01-01 00:00:00
end: 2025-04-01 00:00:00
period: 1d
basePeriod: 1d
exchanges: [{"eid":"Futures_Binance","currency":"BTC_USDT"}]
*/

//@version=5
strategy("Pivot Point CE/PE Strategy", overlay=true)

// Identify 3-minute candles (Assuming the script is applied to a 3-minute chart)- 1