
2
Follow
502
Followers
概要
これは複数のテクニカル指標を組み合わせた高度な取引戦略であり、出来高加重平均価格(AVWAP)、固定レンジ出来高分布(FRVP)、指数平滑移動平均線(EMA)、相対力指数(RSI)、平均方向性指数(ADX)、MACDなどのツールを統合し、インジケーターの集約によって高確率の取引機会を特定することを目的としています。
戦略の原理
本戦略は以下の複数条件によりエントリーシグナルを判断します:
- 価格とAVWAPのクロス
- 価格のEMAに対する位置
- RSIの強弱判断
- MACDのトレンドモメンタム
- ADXによるトレンド強度確認
- 出来高フィルター
戦略はアジア、ロンドン、ニューヨークの取引時間帯に焦点を当てており、これらの時間帯は通常流動性が高く、取引シグナルの信頼性が向上します。エントリーロジックはロングとショートの2モードを備え、段階的な利確・損切りメカニズムを設定しています。
戦略の利点
- 複数インジケーターの組み合わせによるシグナル精度の向上
- 動的な出来高フィルターにより低流動性取引を回避
- 柔軟な利確・損切り戦略
- 異なる取引時間帯に基づく戦略最適化
- 動的なリスク管理メカニズム
- 可視化シグナルによる意思決定支援
戦略のリスク
- 複数インジケーターの組み合わせによりシグナルの複雑性が増大する可能性
- バックテストデータに過学習リスクがある可能性
- 異なる市場環境下でパフォーマンスが不安定になる可能性
- 取引コストとスリッページが実際の収益に影響を与える可能性
戦略の最適化方向性
- 機械学習アルゴリズムの導入によるパラメーターの動的調整
- より多くの取引時間帯への適応性の追加
- 利確・損切り戦略の最適化
- さらなるフィルター条件の導入
- 銘柄横断的な汎用性のある戦略モデルの開発
まとめ
本戦略は高度にカスタマイズされた多次元的な取引戦略であり、複数のテクニカル指標と取引時間帯の特性を統合することで、取引シグナルの品質と精度を高めようと試みています。本戦略は、定量取引におけるインジケーター集約と動的リスク管理の複雑性を示しています。
Source
Pine
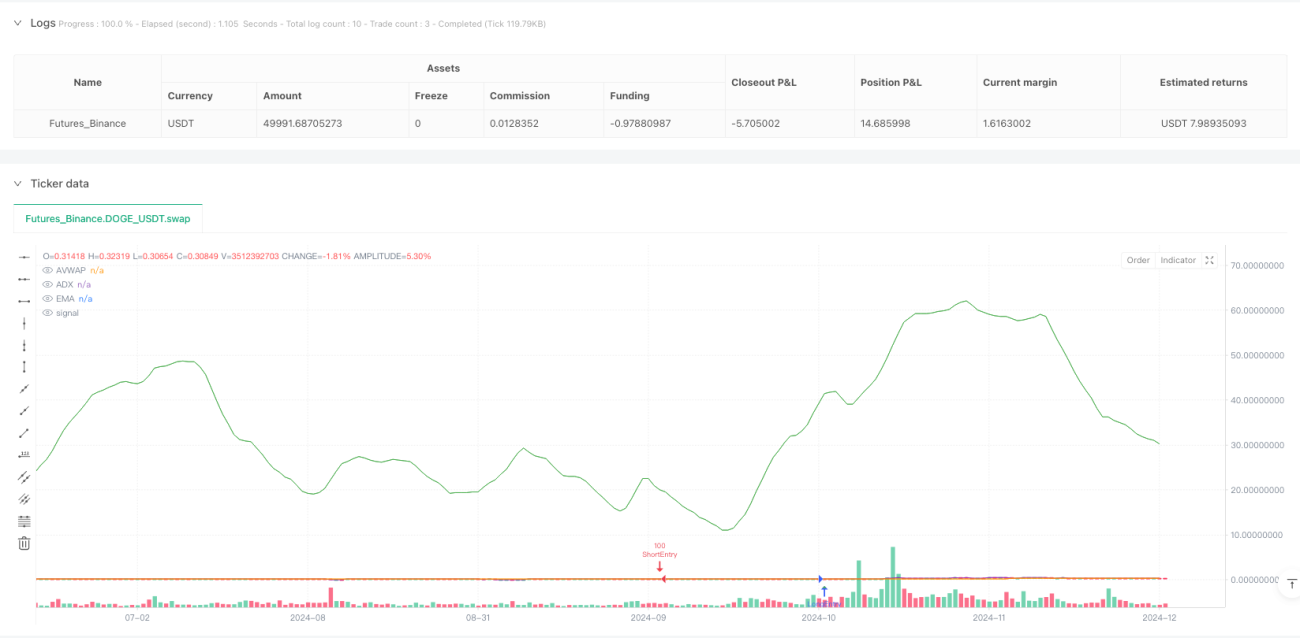
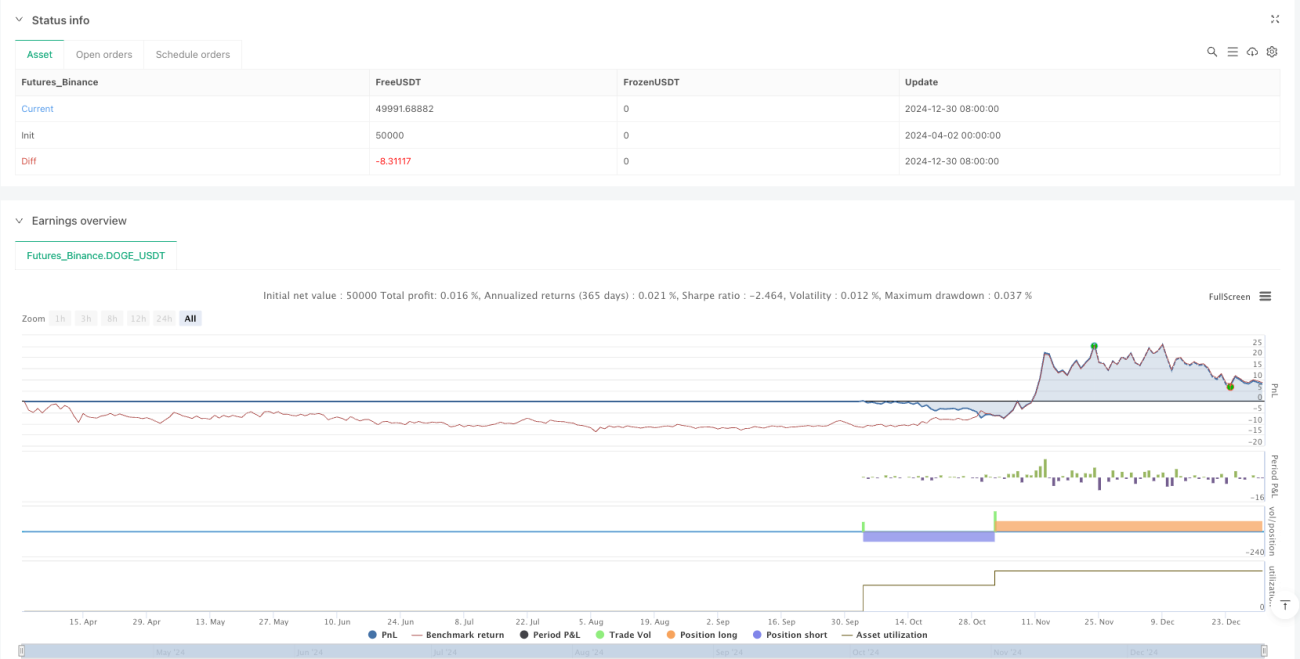
/*backtest
start: 2024-04-02 00:00:00
end: 2024-12-31 00:00:00
period: 1d
basePeriod: 1d
exchanges: [{"eid":"Futures_Binance","currency":"DOGE_USDT"}]
*/

//@version=6
strategy("FRVP + AVWAP by Grok", overlay=true, initial_capital=10000, default_qty_type=strategy.percent_of_equity, default_qty_value=100)

// User InputsStrategy parameters
Related strategies
Comment
All comments (0)
No data
- 1