多重モメンタム指標トレンド追跡定量取引戦略

2
Follow
502
Followers
概要
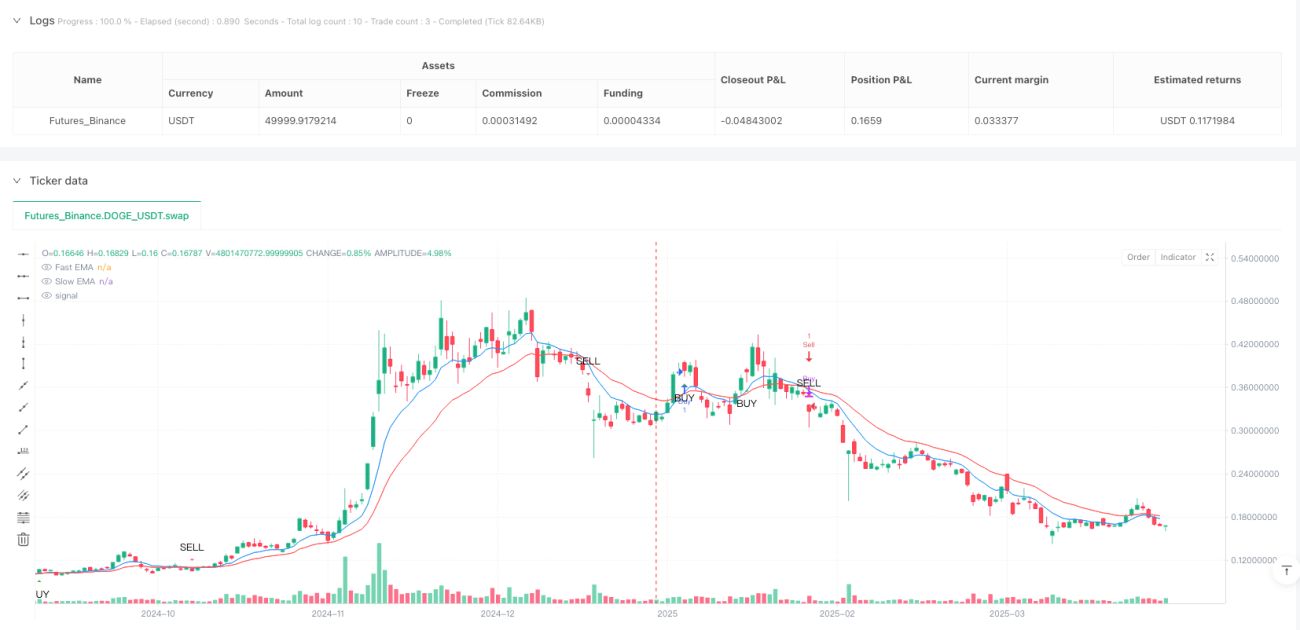
マルチモメンタム指数トレンド追跡定量取引戦略は、指数移動平均(EMA)、相対力指数(RSI)、および移動平均収束拡散指標(MACD)を組み合わせた複合型定量取引手法です。この戦略は複数のテクニカル指標を統合することで、取引シグナルの正確性と信頼性を高め、特に高ボラティリティ市場における短期および中期取引に適しています。
戦略原理
本戦略の中核原理は、複数指標による共同検証です:
- 高速EMA(9期間)と低速EMA(21期間)を使用してトレンド方向とモメンタム変化を判断
- RSI(14期間)により市場モメンタムと買われすぎ・売られすぎの状態を確認
- MACD指標を利用してトレンドのモメンタムと方向を検証
具体的な取引シグナル生成ルール:
- 高速EMAが低速EMAを上抜け、かつRSI > 50、MACDラインがシグナルラインより高い場合に買いシグナル
- 高速EMAが低速EMAを下抜け、かつRSI < 50、MACDラインがシグナルラインより低い場合に売りシグナル
戦略の利点
- 複数指標による共同検証により、偽シグナルのリスクを大幅に低減
- 市場トレンドの変化を動的に捉え、適応力が高い
- パラメータ調整が可能で、異なる市場環境に柔軟に対応
- シグナル生成ロジックが明確で、理解と実装が容易
- 高ボラティリティ市場における短期および中期取引に適している
戦略のリスク
- レンジ相場において頻繁な無効取引が発生する可能性
- 指標パラメータの選択が不適切な場合、取引効率が低下する可能性
- 取引コストやスリッページの影響を考慮していない
- 単一市場環境における戦略の安定性に限界がある
戦略の最適化方向
- 追加のフィルター条件(例:出来高確認)の導入
- ストップロスおよび利確メカニズムの追加
- EMA、RSI、MACDパラメータの動的調整
- 機械学習に基づくパラメータ適応アルゴリズムの開発
- より多くの市場環境判断指標の導入
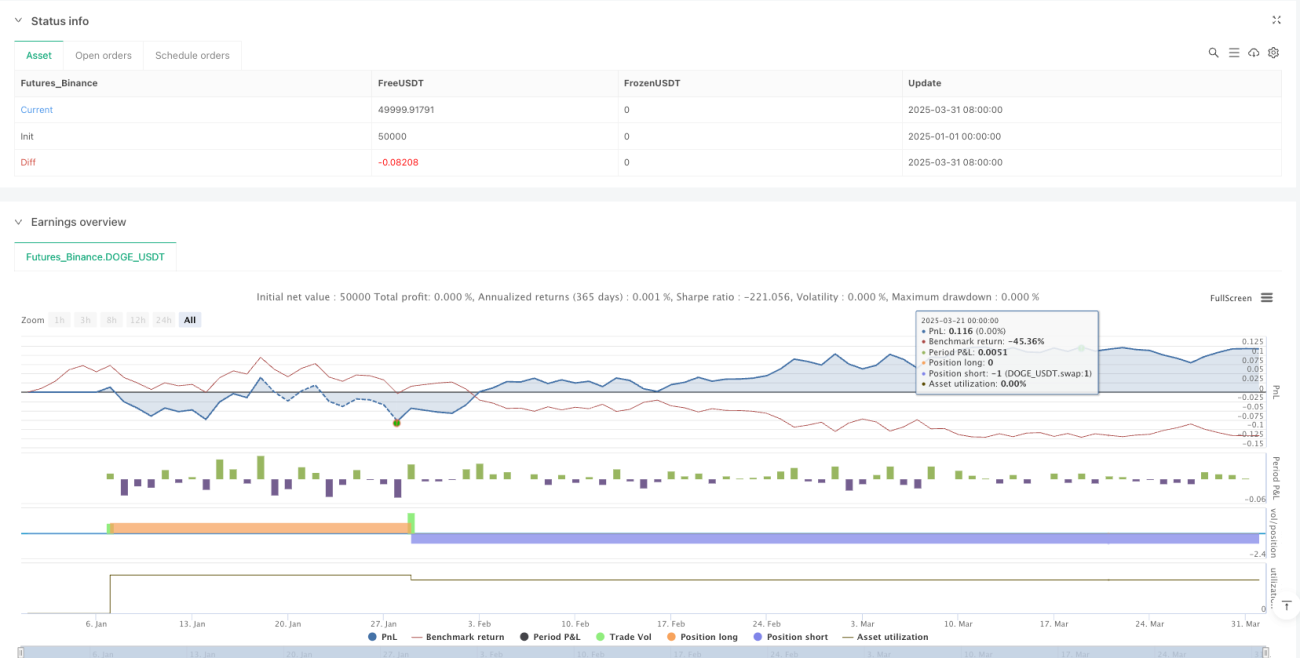
まとめ
マルチモメンタム指数トレンド追跡定量取引戦略は、EMA、RSI、MACDの3つの主要テクニカル指標を統合することで、比較的堅牢な取引シグナル生成システムを構築しています。本戦略は十分な柔軟性を維持しつつ、高いリスク管理能力を備えており、定量取引を行う投資家にとって研究に値する取引手法を提供しています。
Source
Pine
Strategy parameters
Related strategies
Comment
All comments (0)
No data
- 1