
概要
「市場構造ブレイクアウトと出来高ピーク、RSIマルチ指標クロス戦略」は、市場構造(SMC)、出来高ブレイクアウト、および相対力指数(RSI)を組み合わせたマルチ指標取引戦略です。この戦略は主に重要なスイングポイントを識別して市場構造を分析し、構造ブレイクアウト時に出来高ピークとRSI指標を組み合わせて取引シグナルを確定します。戦略の設計目的は、潜在的な市場の反転またはブレイクアウトポイントを特定し、より正確な取引エントリータイミングを提供し、偽のブレイクアウトによるリスクを低減することです。
戦略の原理
この戦略の核心理念は、マルチ指標の共振によって取引シグナルの有効性を確認することです。戦略の動作フローは以下の通りです。
- スイングポイント識別: pivot関数を使用して市場のスイング高値(pivot high)とスイング安値(pivot low)を識別し、パラメータ
swing_lenで遡り期間を制御します。 - 市場構造分析: 直近で確定したスイング高値と安値を継続的に記録・更新し、これらのポイントが市場の構造的サポート・レジスタンス域を形成します。
- 出来高確認: 出来高の単純移動平均線(SMA)を計算し、出来高ブレイクアウトの状況を識別します。現在の出来高が平均出来高の指定倍率よりも大きい場合、出来高ピークと判定します。
- RSIフィルター: 相対力指数(RSI)を追加のフィルター条件として使用し、シグナルの信頼性を高めます。
- 取引シグナル生成:
- ロングシグナル: 価格が前回のスイング安値(構造ブレイクアウト)を上抜け、出来高ピークを伴い、且つRSIが50未満(売られ過ぎの可能性を示す)
- ショートシグナル: 価格が前回のスイング高値(構造ブレイクアウト)を下抜け、出来高ピークを伴い、且つRSIが50超(買われ過ぎの可能性を示す)
- ポジション管理: 固定保有期間戦略を採用し、取引開始後に指定されたローソク足数(holdBars)を保有した後、ポジションを決済します。
戦略の優位性
- 構造化された市場分析: 戦略は重要なスイングポイントを識別することで、トレーダーに明確な市場構造の視点を提供し、価格動向の本質を理解するのに役立ちます。
- マルチ指標による確認: 出来高とRSI指標を組み合わせてシグナルを確認することで、偽のブレイクアウトのリスクを大幅に低減し、取引シグナルの質を向上させます。
- 出来高による検証: 出来高は価格変動の背後にある原動力であり、出来高ピークの条件により、価格ブレイクアウトを支える十分な市場参加があることを保証します。
- RSIの逆張り確認: 戦略におけるRSIの設定(ロングシグナルではRSI<50、ショートシグナルではRSI>50)は、逆張り思考の確認メカニズムを提供し、買われ過ぎ・売られ過ぎからの反発の機会を捉えるのに役立ちます。
- 明確な保有期間: 固定保有期間により、退出タイミングの主観的な判断の難しさを回避し、同時に1回の取引におけるリスク暴露時間を制限します。
- 高度なカスタマイズ性: 戦略は、スイングポイントの遡り期間、出来高移動平均線の長さ、出来高倍率、RSI期間、保有期間など、複数の調整可能なパラメータを提供し、トレーダーが異なる市場や時間枠に合わせて最適化できるようにします。
戦略のリスク
- 偽のブレイクアウトリスク: 戦略はマルチ指標で確認を行いますが、特にボラティリティの高い市場環境では、依然として偽のブレイクアウトが発生する可能性があります。
- 解決策: 追加の確認指標を追加するか、ブレイクアウト確認に必要なローソク足数を増やすことを検討します。
- 固定保有期間の限界: 固定保有期間により、トレンドが完全に展開する前に早期に決済してしまったり、トレンドが反転した後もポジションを保有し続ける可能性があります。
- 解決策: トレーリングストップやテクニカル指標に基づく退出シグナルなどの動的な退出メカニズムの導入を検討します。
- パラメータ最適化の落とし穴: パラメータを過度に最適化すると、過去データでは良好に機能しても、実取引ではパフォーマンスが低下する可能性があります。
- 解決策: 堅牢なパラメータ最適化を実施し、十分に長いバックテスト期間を使用し、異なる市場環境で戦略のロバスト性をテストします。
- ストップロスメカニズムの欠如: 現在の戦略には明確なストップロスメカニズムがなく、1回の取引で過大な損失が発生する可能性があります。
- 解決策: ボラティリティまたは固定パーセンテージに基づくストップロスメカニズムを追加します。
- 取引頻度の問題: パラメータ設定によっては、特定の市場条件下でシグナルが多過ぎたり少な過ぎたりする可能性があります。
- 解決策: 特定市場の変動特性に合わせてパラメータを調整するか、取引頻度制御メカニズムを追加します。
戦略の最適化方向性
-
動的退出メカニズム: 現在の戦略は固定保有期間で退出しますが、より動的な退出メカニズムの導入を検討できます:
- トレーリングストップ: 市場構造またはATR(Average True Range)に基づいて動的なストップロスラインを設定します。
- 逆シグナル退出: 現在のポジションと反対方向のシグナルが発生した場合に退出します。
- 利益目標: 市場構造または主要なサポート/レジスタンスに基づいて利益目標を設定します。
-
リスク管理の強化:
- ストップロスメカニズムの導入: ボラティリティ(例: ATRの倍数)または固定パーセンテージに基づいてストップロスを設定します。
- ポジション管理: 市場のボラティリティまたはシグナルの強さに応じてポジションサイズを調整します。
- リスクコントロール: 1日/1週間あたりの最大取引回数と最大リスクエクスポージャーを制限します。
-
シグナル品質の向上:
- トレンドフィルター: 長期トレンド判断を追加し、トレンド方向にのみポジションを取ります。
- 時間フィルター: 重要な経済指標発表前後の取引を避けます。
- ボラティリティフィルター: 過度に高いまたは低いボラティリティ環境では戦略パラメータを調整するか、取引を休止します。
-
複数時間枠の確認:
- より長期の時間枠での市場構造分析を導入し、複数の時間枠で構造が一致する場合にのみ取引します。
- この最適化によりノイズ取引を減らし、大きなトレンドを捉える能力を向上させることができます。
-
機械学習の強化:
- 機械学習アルゴリズムを使用してパラメータ選択を最適化し、異なる市場環境に応じて戦略パラメータを自動調整します。
- パターン認識アルゴリズムを導入し、市場構造識別の精度を高めます。
まとめ
「市場構造ブレイクアウトと出来高ピーク、RSIマルチ指標クロス戦略」は、市場構造分析、出来高確認、RSI指標フィルターを組み合わせることで、体系的な取引手法を提供する総合的な取引システムです。この戦略の中心的な強みは、マルチ指標の共振確認により、取引シグナルの信頼性を大幅に向上させる点にあります。
戦略の主な特徴は、スイングポイントを使用して市場の重要な構造を特定し、価格がこれらの構造をブレイクアウトする際に、出来高ピークとRSI指標を組み合わせて取引を確認することです。このアプローチにより、市場構造の変化を捉えられるだけでなく、出来高とRSIの補助確認により、偽のブレイクアウトのリスクを低減できます。
それにもかかわらず、この戦略には特に退出メカニズム、リスク管理、シグナル品質の面で最適化の余地があります。より動的な退出戦略の導入、リスク管理システムの強化、シグナルフィルターメカニズムの強化により、戦略の堅牢性と収益性をさらに向上させることができます。
最も重要なことは、トレーダーがこの戦略を使用する際に、機械的にシグナルに従うだけでなく、その背後にある市場構造の概念を理解する必要があるということです。市場構造変化の本質を理解し、出来高とRSI指標の補助分析を組み合わせることで、初めて戦略の潜在能力を最大限に引き出すことができるのです。
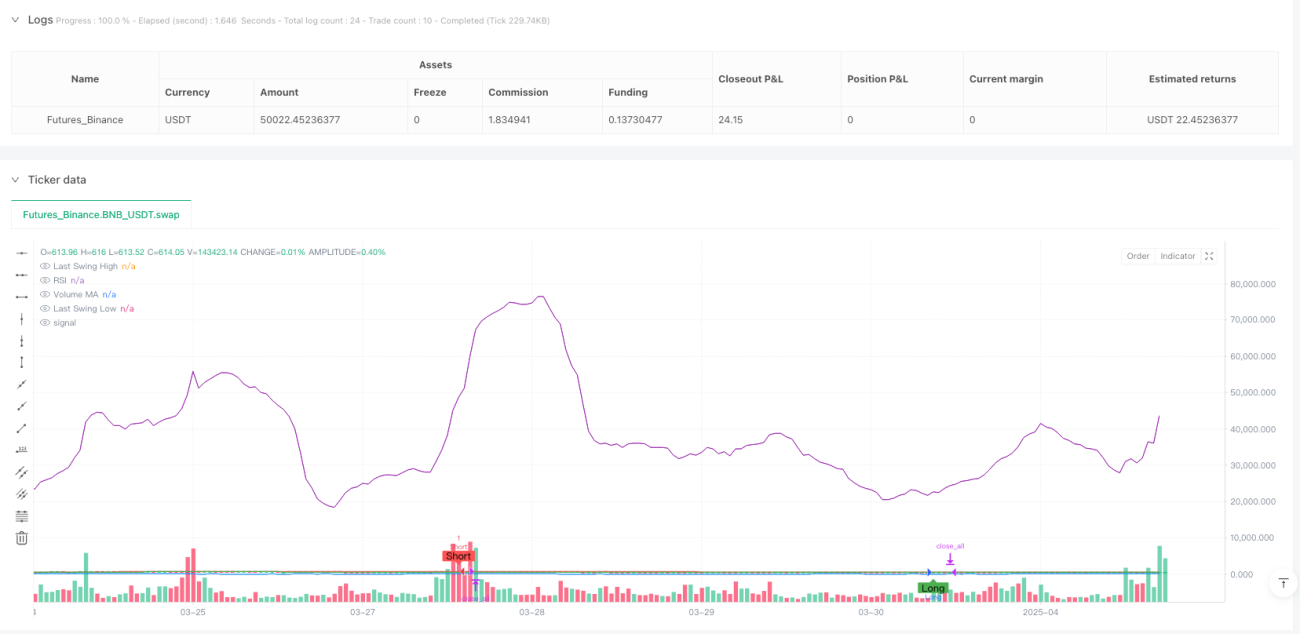
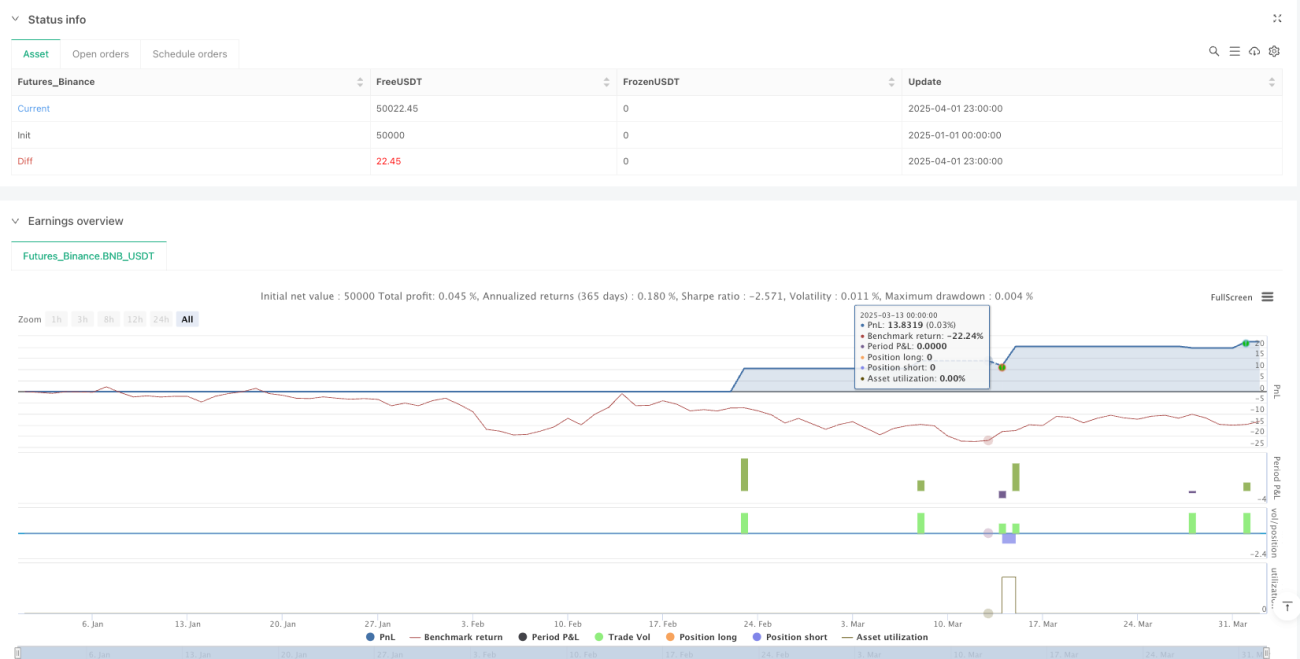
/*backtest
start: 2025-01-01 00:00:00
end: 2025-04-02 00:00:00
period: 1h
basePeriod: 1h
exchanges: [{"eid":"Futures_Binance","currency":"BNB_USDT"}]
*/

//@version=5
strategy("SMC Structure Break with Volume Spike + RSI Confluence", overlay=true, initial_capital=100000, currency=currency.USD)

// ===== INPUTS =====- 1