クオンツ・ロングショート・トレンド追跡動的ストップロス戦略

2
Follow
502
Followers
概要
これは、平均真实変動幅(ATR)と指数移動平均(EMA)に基づくロング・ショートのトレンド追跡戦略です。動的なストップロスとトレンド判断により、市場トレンドを正確に捉え、リスク管理を実現します。
戦略の原理
戦略の核となる原理は以下の重要なステップから構成されます:
- ATR指標を使用して動的ストップロス水準を計算する
- EMAと組み合わせて価格トレンド方向を判断する
- 価格とストップロス水準の相対位置に基づき取引シグナルを決定する
- 平均足(Heikin Ashi)ローソク足を採用することでシグナル認識を選択的に最適化できる
主要な計算ロジック:
- 動的ストップロス水準 = 現在価格 ± (ATR * 感度係数)
- トレンド判断はEMAとストップロス水準のクロスに基づく
- 価格がストップロス水準を突破し、かつEMAがクロスしたときに取引シグナルが発生する
戦略の利点
- 動的リスク管理:ATRがストップロス水準を適応的に計算し、市場のボラティリティに応じてリアルタイムに調整
- トレンド追跡の精度:EMAが価格変動に迅速に反応し、トレンド転換点を捉える
- 柔軟性が高い:ATR期間と感度係数をカスタマイズ可能
- 平均足ローソク足を選択でき、シグナル認識をさらに最適化
- 低頻度取引により取引コストを削減
- 複数市場・複数銘柄に対応
戦略のリスク
- レンジ相場では頻繁な誤シグナルが発生する可能性がある
- パラメータ設定が不適切だと過剰取引を引き起こす可能性がある
- ファンダメンタル要因や突発的なイベントの影響を考慮していない
- バックテストと実運用には一定の差異がある
リスク管理の推奨事項:
- パラメータを最適化し、感度係数を低くする
- 他のインジケーターと組み合わせて確認する
- ストップロスとポジション管理を設定する
- 継続的な監視と動的な調整
戦略の最適化方向性
- 機械学習アルゴリズムを導入してパラメータを動的最適化
- マルチタイムフレームの検証を追加
- 他のテクニカル指標との組み合わせ
- 適応型パラメータ選択メカニズムの開発
- リスク調整モジュールの追加
最適化目標:戦略の安定性向上、ドローダウンの低減、利益効率の向上
まとめ
これは、ATRとEMAに基づく動的なトレンド追跡戦略です。柔軟なストップロスメカニズムとトレンド判断により、比較的安定した市場参加を実現します。本戦略は優れた適応性とリスク管理特性を備えていますが、継続的な最適化と検証が必要です。
Source
Pine
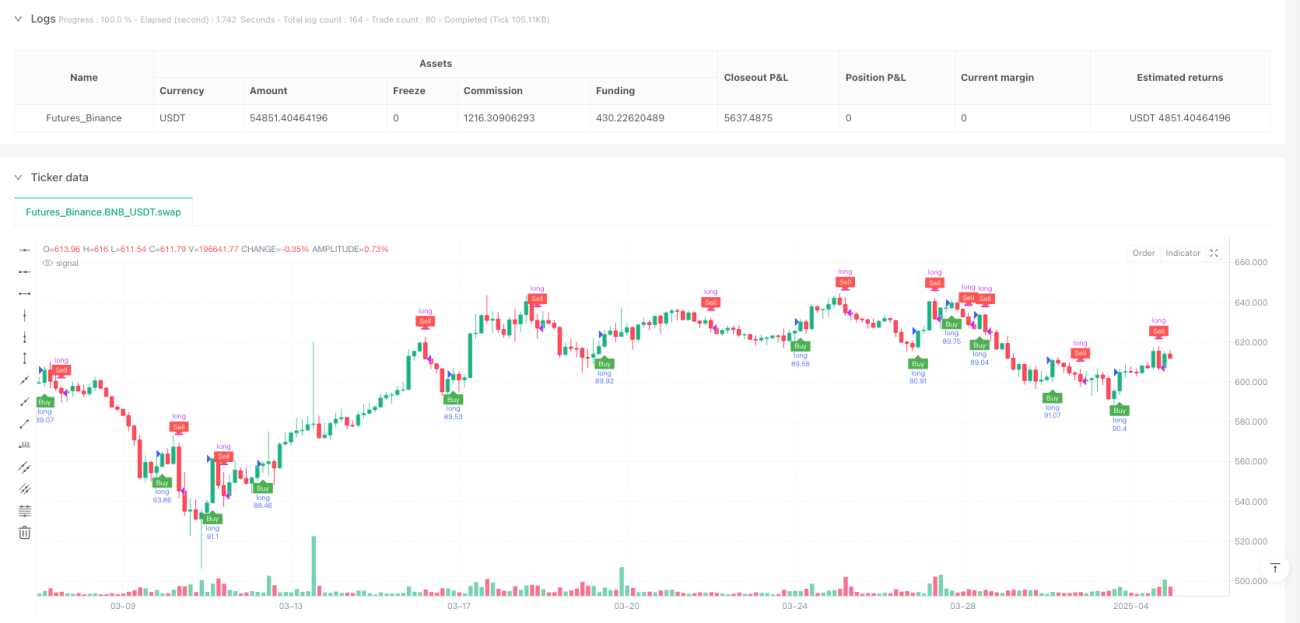
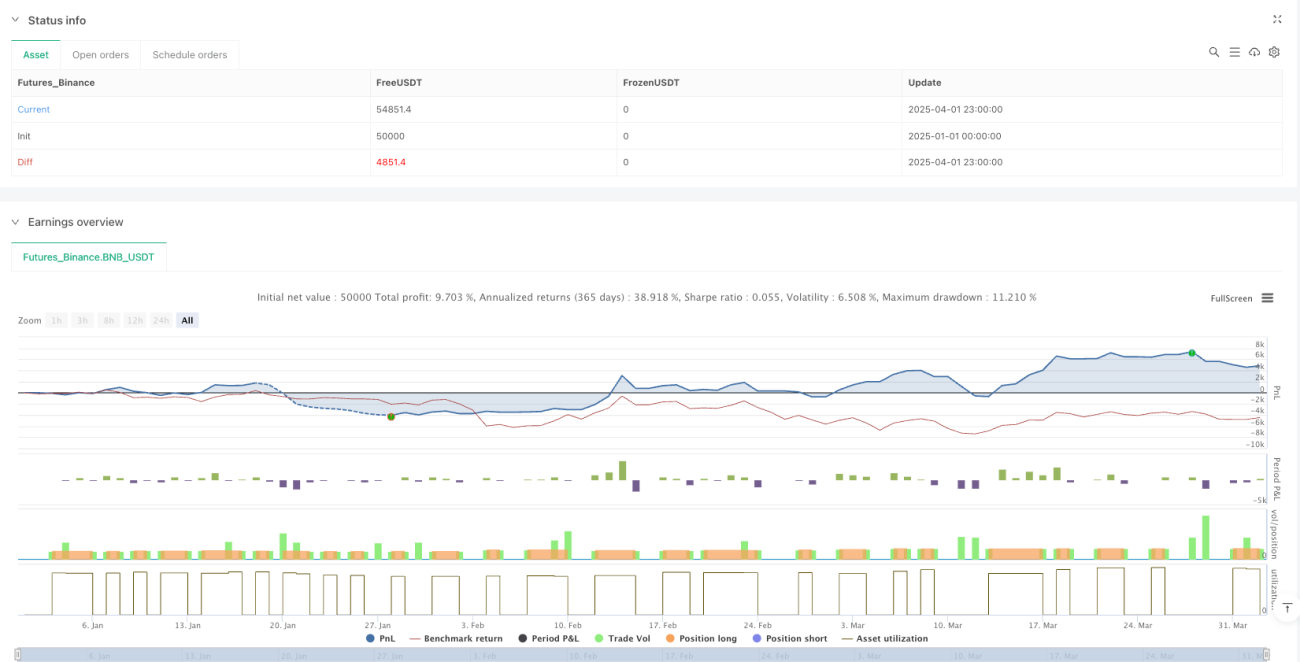
/*backtest
start: 2025-01-01 00:00:00
end: 2025-04-02 00:00:00
period: 3h
basePeriod: 3h
exchanges: [{"eid":"Futures_Binance","currency":"BNB_USDT"}]
*/

//@version=6
strategy("ducanhmaster v1", overlay=true, commission_type=strategy.commission.percent, commission_value=0.1, slippage=3, default_qty_type=strategy.percent_of_equity, default_qty_value=100)

// InputsStrategy parameters
Related strategies
Comment
All comments (0)
No data
- 1