
概要
ドウ理論トレンド適応型モメンタム戦略は、古典的なドウ理論の原則に基づく先進的な取引手法であり、市場トレンドの重要な転換点を識別することで取引判断を導きます。この戦略は価格トレンドの基本的なダイナミクスを検出し確認することに焦点を当て、上昇トレンドを「より高い高値(Higher Highs)」と「より高い安値(Higher Lows)」で定義し、下降トレンドを「より低い高値(Lower Highs)」と「より低い安値(Lower Lows)」で定義します。この方法は市場トレンドを捉え、トレンドが変化した際に迅速に対応するための体系的なアプローチを提供することを目的としています。
戦略の原理
この戦略のコア原理は、ドウ理論の古典的なトレンド識別方法に基づいています。戦略はta.pivothigh()とta.pivotlow()関数を使用して重要な転換点を検出します。具体的な実装には以下の重要なステップが含まれます:
- 転換点検出:
pivotLookbackパラメータを使用して左右のバー数を決定し、高値と安値を識別します。 - トレンド確認:より高い高値とより高い安値の条件が両方とも満たされた場合のみ上昇トレンドを確認します。同様に、より低い高値とより低い安値の条件が両方とも満たされた場合のみ下降トレンドを確認します。
- トレンド継続性:トレンド転換条件が満たされない場合、戦略は以前のトレンド状態を維持し、よりスムーズなトレンド追跡を実現します。
戦略の利点
- 動的トレンド識別:重要な転換点を継続的に分析することで、戦略は市場トレンドの変化を動的に捉えることができます。
- 柔軟な取引モード:自動、買いのみ、売りのみの3つの取引モードを提供し、さまざまなトレーダーのニーズに対応します。
- リスク管理:組み込みのストップロスとテイクプロフィット機構により、個々の取引のリスクを効果的に制御できます。
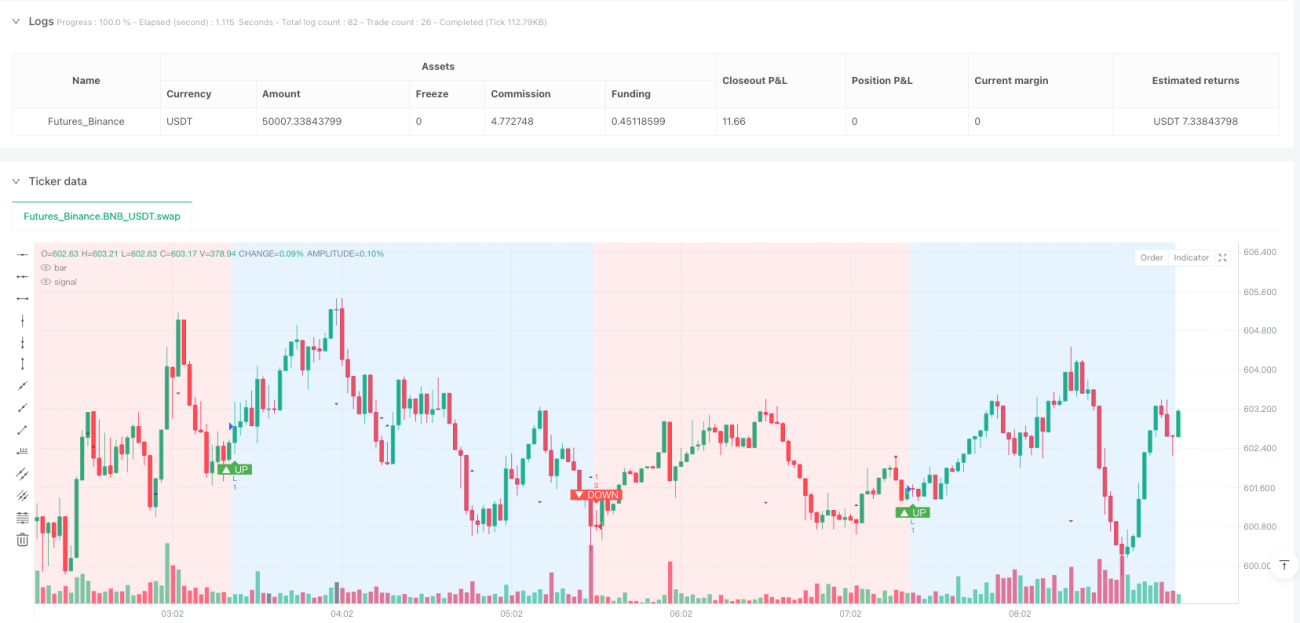
- トレンドの可視化:背景色とマーカーを通じてトレンド方向を直感的に表示し、トレーダーが市場状況を迅速に理解できるようにします。
- 低遅延:従来の移動平均線戦略と比較して、この方法はトレンド変化に対してより迅速に応答できます。
戦略のリスク
- ラグリスク:転換点検出を使用するため、戦略には固有のラグリスクがあり、トレンドの最も初期のシグナルを捉えられない可能性があります。
- レンジ相場リスク:変動が不明瞭な市場では、頻繁な小幅な価格変動が不必要な取引を引き起こす可能性があります。
- パラメータ感度:
pivotLookbackパラメータの選択は戦略のパフォーマンスに大きな影響を与え、異なる市場や時間枠に応じて調整が必要です。 - 取引コスト:頻繁な取引は、特に手数料率が高い場合に高い取引コストをもたらす可能性があります。
戦略の最適化方向
- 追加フィルターの導入:トレンド強度指標(ATRなど)を組み合わせて弱いトレンドシグナルをフィルタリングします。
- 動的パラメータ調整:市場のボラティリティに基づく適応型の
pivotLookbackパラメータメカニズムを開発します。 - マルチタイムフレーム検証:異なる時間枠でトレンドシグナルを相互検証し、シグナルの信頼性を向上させます。
- 機械学習の強化:機械学習アルゴリズムを探索してトレンド識別とエントリータイミングを最適化します。
- リスク管理の最適化:市場のボラティリティに応じてストップロスとテイクプロフィットの距離を動的に調整します。
まとめ
ドウ理論トレンド適応型モメンタム戦略は、強力なトレンド追跡手法であり、革新的な転換点分析技術を通じて、トレーダーに体系化されたトレンド識別ツールを提供します。いくつかの固有のリスクは存在するものの、その柔軟性とダイナミックさにより、現代のアルゴリズム取引戦略の中でも価値ある手法となっています。この戦略を成功裏に適用するには、その動作原理を深く理解し、具体的な市場環境に応じて継続的に最適化・調整する必要があります。
- 追加フィルターの導入:ATRなどのトレンド強度指標を組み合わせて、弱いトレンドシグナルをフィルタリングします。
- 動的パラメータ調整:市場のボラティリティに基づいて適応型のpivotLookbackパラメータメカニズムを開発します。
- マルチタイムフレーム検証:異なる時間軸でトレンドシグナルを相互検証し、シグナルの信頼性を向上させます。
- 機械学習の強化:機械学習アルゴリズムを活用して、トレンド識別とエントリータイミングの最適化を探ります。
- リスク管理の最適化:市場のボラティリティに基づいて、ストップロスやテイクプロフィットの距離を動的に調整します。
結論
ダウ理論トレンド適応型モメンタム戦略は、強力なトレンドフォロー手法であり、革新的な転換点分析技術を通じて、トレーダーに体系的なトレンド識別ツールを提供します。いくつかの固有のリスクは存在するものの、その柔軟性と動的特性により、現代の定量取引戦略において価値あるアプローチとなっています。この戦略を成功裏に適用するには、その動作原理を深く理解し、特定の市場環境に基づいて継続的な最適化と調整を行う必要があります。
/*backtest
start: 2025-03-29 00:00:00
end: 2025-03-30 09:00:00
period: 2m
basePeriod: 2m
exchanges: [{"eid":"Futures_Binance","currency":"BNB_USDT"}]
*/

//@version=5
// strategy(title="Dow Theory Trend Strategy v3", shorttitle="Dow Trend Strat v3", overlay=true,
//      initial_capital=10000, default_qty_type=strategy.percent_of_equity, default_qty_value=10,
// commission_type=strategy.commission.percent, commission_value=0.1, // Example strategy settings with commission- 1