
概要
本戦略は、マルチタイムフレーム分析、テクニカル指標の融合、およびフォーメーション認識を活用して高確率のトレード機会を捉える総合的な取引システムです。その核となる考え方は、5つの異なるタイムフレーム(1分、5分、15分、1時間、4時間)におけるトレンドの一貫性を分析し、出来高ブレイクアウト、包み足、モメンタム指標を組み合わせることで、市場の動きを正確に捉えることにあります。また、本戦略には自動の利確・損切りメカニズムが組み込まれており、市場のボラティリティに応じてリスク管理パラメータを動的に調整します。
戦略の原理
戦略の核心は以下の主要コンポーネントに基づいています。
-
マルチタイムフレームトレンド分析:戦略はまず、カスタム関数
getTrend()を用いて5つの異なるタイムフレームのトレンドを分析します。各タイムフレームにおいて、システムは短期EMAが長期EMAを上回っているか、RSI値が50を超えているか、価格が短期EMAを上回っているかをチェックしてロングシグナルを判定し、逆の条件でショートシグナルを判定します。 -
トレンドコンセンサスの確認:5つのタイムフレームすべてが同じ方向のトレンドシグナルを示した場合にのみ、システムはエントリーを検討します。この厳格なトレンドコンセンサスメカニズムにより、シグナルの信頼性が大幅に向上します。
-
エントリー条件の最適化:トレンドコンセンサスに加えて、エントリーには以下の条件を満たす必要があります。
- 包み足(陽の包み線または陰の包み線)の確認
- 出来高ブレイクアウト(20期間の平均出来高の2倍以上)
- RSIの確認(ロング時は55超、ショート時は45未満)
- 狭義市場指数(CMI)が30超(十分な市場モメンタムを確保)
- 出来高加重移動平均線(VWMA)に対する価格位置の確認
-
リスク管理システム:戦略は動的な利確・損切り計算方式を採用し、直近の価格変動(高値と安値の差)に基づいてストップロス水準を設定し、倍率パラメータ(デフォルト2.0)を使用して利確目標を設定します。
-
サポート/レジスタンスの可視化:システムは重要なサポート線とレジスタンス線を自動的に識別し表示し、視覚的な補助を通じてトレーダーが現在の市場構造を理解するのに役立ちます。
戦略の優位性
-
多次元シグナルフィルター:複数のテクニカル指標とタイムフレームの一貫性を要求することで、偽シグナルの可能性を大幅に低減します。この多重確認メカニズムにより、戦略は高確率のセットアップでのみ取引シグナルを発動します。
-
適応的リスク管理:ストップロスと利確水準は固定されておらず、現在の市場ボラティリティに基づいて動的に計算されるため、戦略は異なるボラティリティ条件下でも適切なリスクリワード比を維持できます。
-
完全な可視化システム:戦略には、トレンドダッシュボード、サポート/レジスタンスボックス、取引シグナルマーカー、予想利確・損切りラインなど、包括的な視覚補助ツールが含まれており、トレーダーに直感的な市場分析を提供します。
-
出来高確認:取引シグナルに有意な出来高の増加が伴うことを要求することで、戦略は単なる価格のランダムな変動ではなく、実際のモメンタムを持つ市場の動きを識別できます。
-
フォーメーション認識の統合:包み足をエントリー条件の一部とすることで、これらのローソク足パターンは通常、市場心理の顕著な転換を表すため、戦略の精度が向上します。
戦略のリスク
-
頻繁なリバランスの必要性:戦略が複数のタイムフレームの一貫性に依存するため、取引シグナルは比較的まれになる可能性があります。長期間取引機会がない場合、トレーダーは基準を引き下げる誘惑に駆られ、好ましくない取引を実行する可能性があります。
-
シグナル依存性:戦略はテクニカル指標とフォーメーションに大きく依存しており、突発的なニュースイベントや極端なボラティリティ時などの特定の市場条件下では、これらのシグナルが無効になったり誤った指示を与えたりする可能性があります。
-
過最適化のリスク:戦略は多数のパラメータと条件を使用しており、過去データに対して過度に最適化され、実際の市場条件下ではパフォーマンスが低下する可能性があります。十分に長いタイムフレームと異なる市場条件での徹底的なバックテストが必要です。
-
計算の複雑性:マルチタイムフレーム分析と複数の指標計算には多大な計算リソースが必要であり、特定の取引プラットフォームでパフォーマンスの問題や遅延を引き起こす可能性があります。
-
トレンド転換検出の遅延:戦略は複数のタイムフレームの一貫性を必要とするため、新しいトレンドがすべてのタイムフレームで確立されるまで、トレンド転換の初期段階で機会を逃す可能性があります。
最適化の方向性
-
適応的パラメータ調整:EMAの長さ、RSIのしきい値、CMI要件を現在の市場ボラティリティや取引セッションに応じて自動調整するメカニズムを導入し、異なる市場状態に対応します。
-
タイムフレーム重み付けシステム:単にすべてのタイムフレームの一致を要求するのではなく、上位タイムフレームのシグナルにより大きな影響を与える加重システムを実装することで、高品質基準を維持しつつ、よりタイムリーなシグナルを生成できる可能性があります。
-
市場状態の分類:現在の市場がトレンド状態かレンジ状態かを検出するアルゴリズムを追加し、それに応じて戦略パラメータを調整します。例えば、レンジ相場ではより高いCMIしきい値が必要になる可能性があります。
-
機械学習の統合:機械学習アルゴリズムを使用してエントリーとエグジットルールを最適化し、過去データに基づいて最も効果的なシグナルの組み合わせを特定し、新しいデータの蓄積に伴って継続的に改善します。
-
強化された分散化:フィボナッチリトレースメント水準、重要な価格水準、または市場心理指標などの無相関のテクニカル指標を追加し、追加の確認次元を提供します。
まとめ
マルチタイムフレーム融合型モメンタムキャッチ自動取引戦略は、厳格な多重確認メカニズムを通じて高確率の取引機会を識別する包括的な取引システムです。トレンド分析、出来高確認、フォーメーション認識、動的リスク管理を組み合わせることで、本戦略は各取引のリスクを管理しながら、高品質な取引シグナルを提供することを目指しています。
本戦略の厳格な条件により取引シグナルが比較的少なくなる可能性がありますが、これは実際には主な利点の一つであり、シグナルの質を数量よりも優先します。提案された最適化措置、特に適応的パラメータと市場状態分類により、戦略はさらにパフォーマンスと適応性を向上させることができます。
システム化され規律ある取引アプローチを求めるトレーダーにとって、この多面的な分析と厳格な確認の方法は、自動化ルールを通じて感情バイアスの影響を低減しつつ、異なる市場環境で一貫性を維持する強力なフレームワークを提供します。
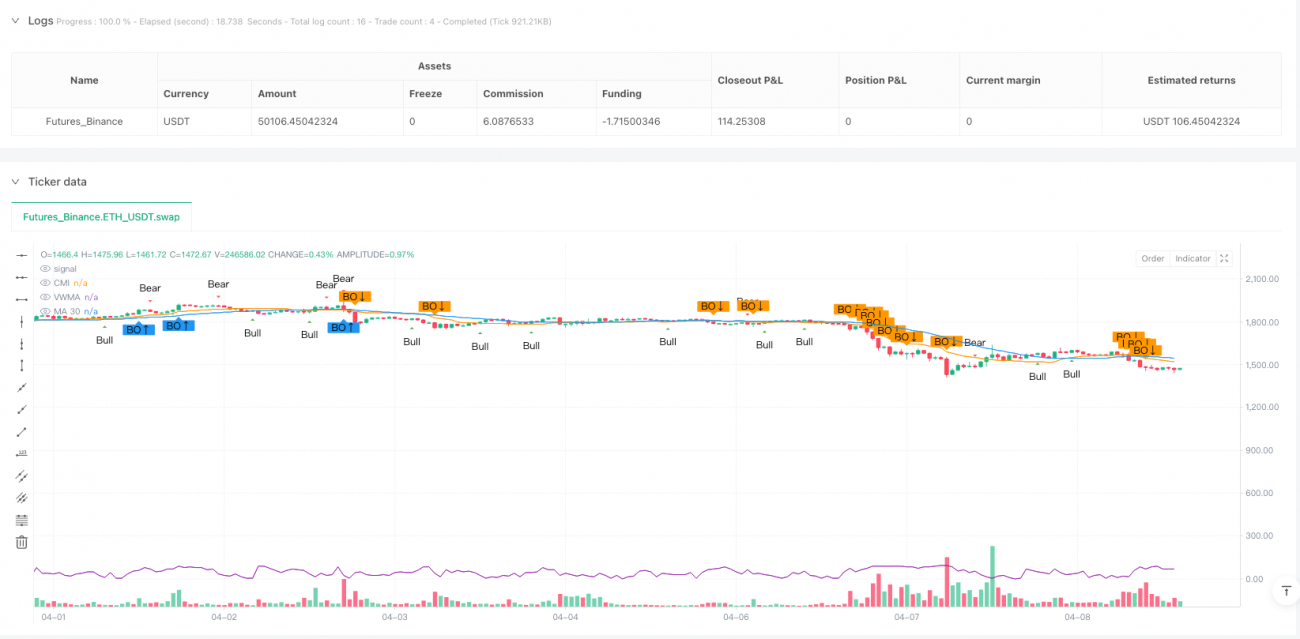
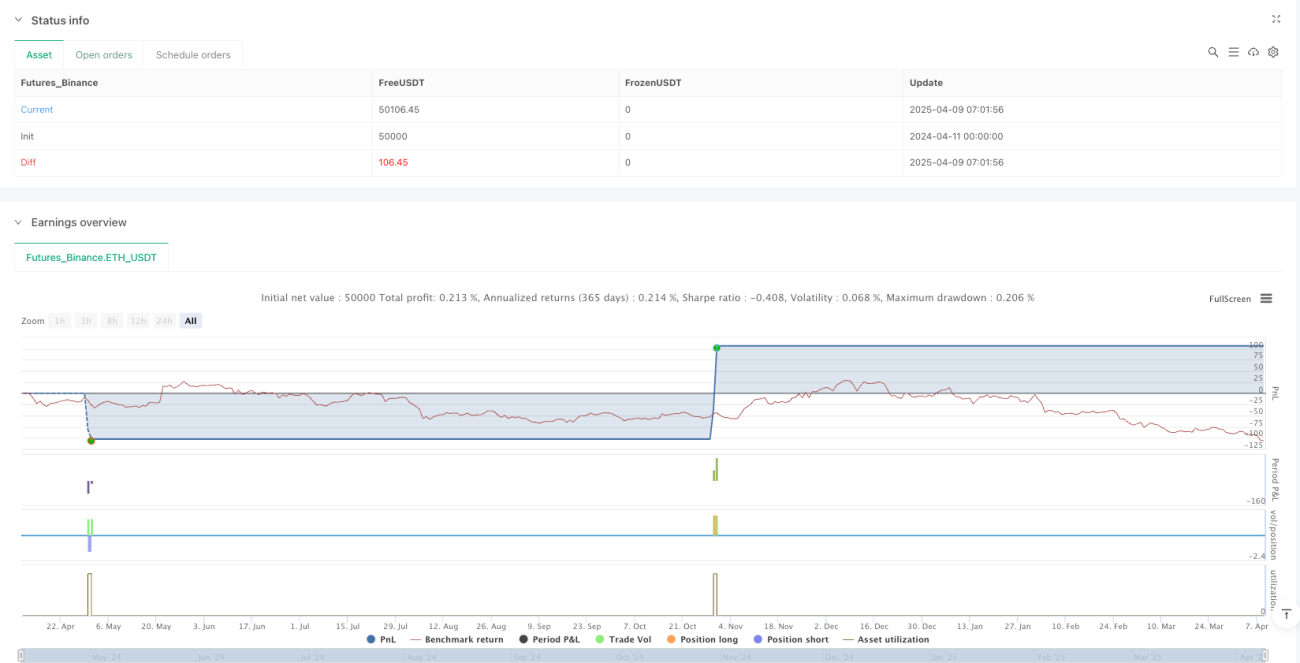
/*backtest
start: 2024-04-11 00:00:00
end: 2025-04-09 08:00:00
period: 1h
basePeriod: 1h
exchanges: [{"eid":"Futures_Binance","currency":"ETH_USDT"}]
*/

//@version=5
strategy("M.Shiham-XAUUSD Sniper Strategy", overlay=true, default_qty_type=strategy.percent_of_equity, default_qty_value=10, max_lines_count=500, max_boxes_count=500)

// === Input ===- 1