ヘイキンアシトレンド追跡戦略:マルチレベルのストップロス機構を備えたマルチタイムフレームトレンド認識システム

概要
ヘイケンアシトレンドフォロー戦略は、ヘイケンアシ(平均足)ローソク足、スーパートレンド指標、平均方向性指数(ADX)フィルターの利点を組み合わせた総合的な取引システムであり、強力なトレンドの動きを識別し、効果的な資金管理を行うことを目的としています。この戦略は、確立されたトレンド内のモメンタムを捉えることに重点を置きつつ、先進的な3層のストップロスメカニズムを採用して資金を保護し、利益を確定します。この戦略は多様な取引銘柄に適用可能であり、特にボラティリティが高い市場で優れたパフォーマンスを発揮します。
戦略の原理
ヘイケンアシトレンドフォロー戦略は、3つの中核的なテクニカル指標の相乗効果に基づいています:
-
ヘイケンアシローソク足分析:この戦略は、上下のヒゲがほとんどない「実体」のあるヘイケンアシローソク足に特に注目します。これらのローソク足は、価格が一方向に断固として動き、ほとんど押し目がなく、強いモメンタムとトレンド継続を示唆します。下ヒゲのない緑色のローソク足はロングシグナル、上ヒゲのない赤色のローソク足はショートシグナルと見なされます。
-
スーパートレンド指標フィルター:システムはスーパートレンド指標(デフォルト:係数3.0、ATR期間10)を使用して、潜在的なトレンド方向を確認します。エントリーシグナルはスーパートレンドの方向と一致している必要があり、これによりシグナルの信頼性が高まり、誤取引が減少します。
-
ADXフィルター(オプション):平均方向性指数はトレンドの強さを評価するために使用され、ADXが指定された閾値(デフォルト:25)を超えた場合にのみ取引がトリガーされます。これにより、レンジ相場や横ばい市場でのノイズシグナルをフィルタリングするのに役立ちます。
取引システムには明確なエントリールールとエグジットルールがあります:
- エントリーシグナル:以下の条件が満たされた場合に形成されます:(1)下ヒゲのない緑色のヘイケンアシローソク足(ロング)、または上ヒゲのない赤色のヘイケンアシローソク足(ショート);(2)スーパートレンド方向の確認;(3)ADX閾値(有効な場合)。
- エグジットシグナル:反対方向のヒゲなしローソク足が現れた場合、またはいずれかのストップロスメカニズムがトリガーされた場合に取引が終了します。
この戦略の最も顕著な特徴は、革新的な3層ストップロスシステムです:
- ATRトレーリングストップロス:市場のボラティリティ(ATR値)に基づいて動的にストップロス位置を調整し、トレンドが延長するにつれて利益を確定します。
- スイングポイントストップロス:市場の自然な構造(ルックバック期間内の最近の高値/安値)を利用してストップロスを設定し、市場自身のリズムを尊重します。
- 保険ストップロス:エントリー価格に対するパーセンテージに基づいて設定されたセーフティネットで、即時の資本保護を提供します。特にスイングポイントストップロスの位置がエントリーポイントから遠すぎる場合に有効です。
戦略の利点
-
多層的なリスク管理:3層のストップロスシステムは、さまざまな市場状況やリスクシナリオに対応した包括的な資金保護を提供します。これがこの戦略の最も顕著な利点です。
-
適応性の高さ:すべてのコンポーネント(スーパートレンド、ADX)は、さまざまな市場条件に応じて有効/無効にでき、パラメータも調整可能なため、戦略は非常に柔軟です。
-
強力なトレンド捕捉能力:ヘイケンアシローソク足の明確な視覚的シグナル、スーパートレンドによる確認、ADXによるトレンド強度評価を組み合わせることで、この戦略は強力なトレンドの動きを効果的に識別できます。
-
明確な視覚的フィードバック:戦略はチャート上にポジションステータス、エントリー価格、現在のストップロスレベルを表示するため、トレーダーは戦略の実行を直感的に理解し追跡できます。
-
内蔵の資金管理:戦略はエクイティのパーセンテージに基づいたポジション管理手法(デフォルト:3%)を採用しており、これによりアカウントサイズの変化に応じてリスクエクスポージャーが一定に保たれます。
-
完全な取引システム:エントリーシグナルからエグジットルールまでの完全な取引フローを提供し、追加の判断や指標を必要としません。
戦略のリスク
-
過剰最適化リスク:戦略には複数の調整可能なパラメータが含まれており、これがカーブフィッティングの問題を引き起こす可能性があります。つまり、過去のデータでは良好なパフォーマンスを示しても、リアルタイム取引では効果が薄れることがあります。解決策としては、十分に長い過去データを使用してバックテストを行い、異なる市場条件下で戦略のロバスト性をテストすることです。
-
トレンド反転リスク:多層のストップロスメカニズムがあるにもかかわらず、強いトレンドが突然反転した場合、この戦略は大きなドローダウンに直面する可能性があります。市場の突発的な極端な変動により、ストップロスがタイムリーにトリガーされず、予想以上の損失が発生する可能性があります。解決策としては、ボラティリティフィルターを追加するか、より厳格なリスク管理ルールを実装することを検討します。
-
パラメータ感応度:異なるパラメータ設定は大きく異なる結果をもたらす可能性があり、特にスーパートレンドの係数やADXの閾値が影響します。これには、トレーダーが各パラメータの影響を深く理解し、特定の市場環境に適したバランスを見つける必要があります。
-
低ボラティリティ環境でのパフォーマンス低下:低ボラティリティやレンジ相場では、この戦略は誤ったシグナルを複数回発生させ、「ノコギリ」取引を引き起こす可能性があります。解決策としては、このような環境では取引を一時停止するか、追加の市場環境フィルターを導入することです。
-
資金管理リスク:固定パーセンテージのポジション管理は、すべての市場環境に適しているわけではありません。高いボラティリティの市場では、リスクを制御するためにポジションサイズを減らす必要があるかもしれません。
戦略の最適化方向
-
ボラティリティ適応メカニズムの追加:現在の戦略は、ボラティリティフィルター(例:ヒストリカルボラティリティ(HV)やインプライドボラティリティ(IV)指標)を導入することでさらに最適化でき、異なる市場環境で自動的にパラメータを調整できるようになります。これにより、戦略は高ボラティリティ期間と低ボラティリティ期間の両方で安定したパフォーマンスを維持できるようになります。
-
時間フィルターの統合:ボラティリティが低い、または市場のトレンド性が弱い時間帯での取引を避けるために、時間ベースのフィルターを追加することを検討します。これは、特定の銘柄の取引に特に有用です。なぜなら、銘柄によって1日の異なる時間帯で異なる行動特性を示すからです。
-
機械学習最適化の導入:静的なパラメータ設定に依存するのではなく、機械学習技術を使用して最適なパラメータ組み合わせを自動的に識別できます。これは、過去のデータパターンを分析して、将来の特定の市場条件下でどのパラメータ設定が最も良いパフォーマンスを発揮するかを予測することで実現できます。
-
関連市場フィルターの追加:関連市場や指数の挙動を観察することでエントリーシグナルを強化します。例えば、特定の銘柄を取引する際に、全体の市場トレンドや関連市場の強弱を考慮します。
-
ストップロスメカニズムの最適化:現在の3層ストップロスシステムはさらに最適化可能であり、例えばボラティリティに基づいて保険ストップロスのパーセンテージを動的に調整したり、単純なルックバック期間の高値/安値ではなく、サポート/レジスタンスレベルを使用してスイングポイントストップロスを正確に設定したりできます。
-
出来高分析の統合:シグナル確認プロセスに出来高フィルターを追加し、価格の動きが十分な出来高のサポートを得ていることを確認することで、シグナルの信頼性を高めます。
まとめ
ヘイケンアシトレンドフォロー戦略は、複雑かつ包括的な取引システムであり、ヘイケンアシローソク足、スーパートレンド指標、ADXフィルターの独自の組み合わせを通じて、強いトレンドにおけるモメンタムの機会を捉えることに焦点を当てています。3層のストップロスシステムは包括的なリスク管理を提供し、カスタマイズ可能なパラメータ設定により、さまざまな市場条件に適応できます。
この戦略の主な利点は、明確な視覚的シグナル、強力なトレンド識別能力、そして包括的な資金保護メカニズムにあります。しかし、トレーダーはパラメータ最適化の課題や低ボラティリティ環境での潜在的な限界を認識する必要があります。
提案された最適化方向(ボラティリティ適応メカニズムの追加、時間フィルターの統合、出来高分析など)を実装することで、戦略のロバスト性と適応性をさらに強化できます。最終的に、ヘイケンアシトレンドフォロー戦略は、テクニカル分析の明確なシグナルとシステム化されたリスク管理の原則を組み合わせたバランスの取れたアプローチを代表しており、トレンドフォロートレーダーにとって価値あるツールを提供します。
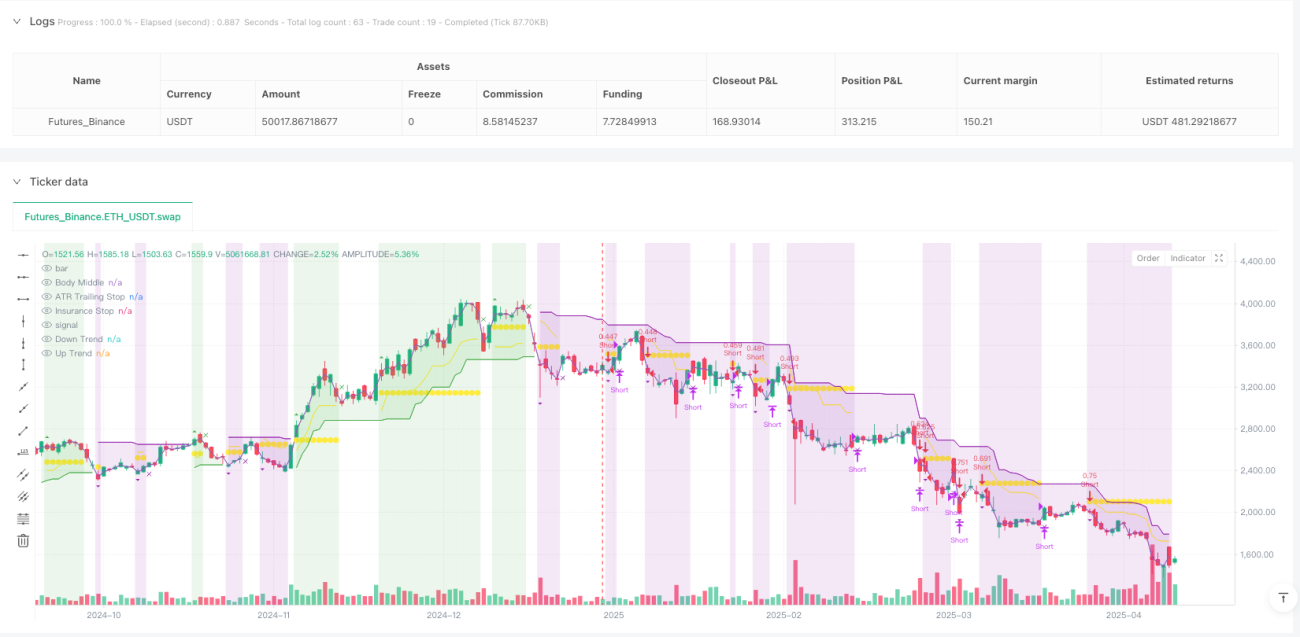
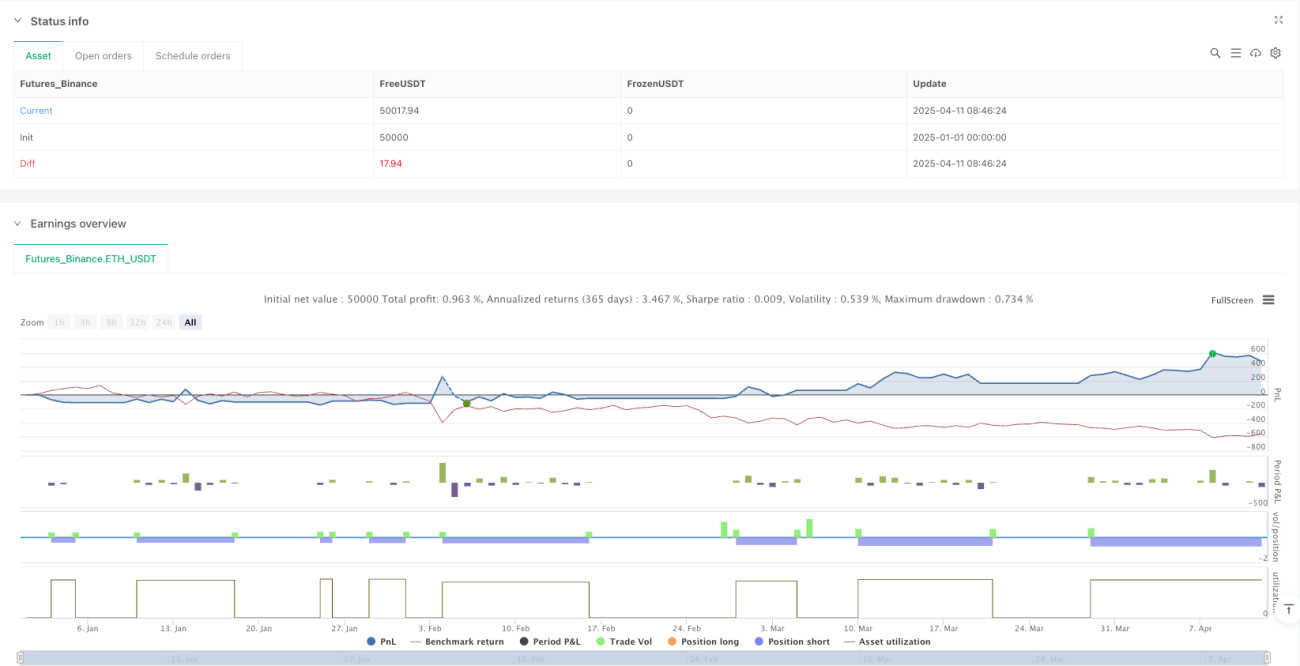
/*backtest
start: 2025-01-01 00:00:00
end: 2025-04-12 08:00:00
period: 1d
basePeriod: 1d
exchanges: [{"eid":"Futures_Binance","currency":"ETH_USDT"}]
*/

//@version=5
strategy("Heiken Ashi Supertrend ADX - Strategy", overlay=true, initial_capital=1000, commission_type=strategy.commission.percent, commission_value=0, calc_on_every_tick=true, process_orders_on_close=false, default_qty_type=strategy.percent_of_equity, default_qty_value=3)
- 1