マルチタイムフレーム適応型市場メカニズム定量取引戦略

ATR EMA RSI MACD ADX 布林带 蜡烛图形态 多时间框架分析 自适应算法 市场机制检测
作成日: 2025-04-21 16:20:34 最終変更日: 2025-04-21 16:20:34
コピー: 0 クリック数: 521
2
フォロー
319
フォロワー

マルチタイムフレーム適応型市場メカニズム定量取引戦略 マルチタイムフレーム適応型市場メカニズム定量取引戦略

概要

マルチタイムフレーム自己適応市場機構量化取引戦略は,多指標総合分析に基づく高度な量化取引システムで,異なる市場条件に応じて自動で取引戦略を調整することができる.この戦略は,人工知能の自己適応技術を活用して,4つの市場機構 (トレンド型,区間型,波動型,静止型) を識別し,現在の市場状態の動態に応じて取引パラメータを調整する.核心技術には,マルチタイムフレーム分析,図形認識,動態リスク認識,および自己最適化アルゴリズム管理が含まれ,トレーダーに包括的で柔軟な取引ツールを提供します.

戦略原則

この戦略の核心は,複数の技術指標を統合することで,市場状態の正確な検出とシグナル生成を実現する,多層の市場分析の枠組みにあります.

  1. 移動平均のシステム傾向方向を決定するために,高速 ((9サイクル) と遅い ((34サイクル) の指数移動平均 ((EMA) を使用し,ATRの値と組み合わせて判断の正確性を強化します.

  2. 複数の時間枠の確認機構: 高い時間枠のRSIとMACD指標により,よりマクロな市場視点を提供し,低い時間枠のノイズ信号をフィルターします. 戦略は,高い時間枠のトレンド確認に特に重点を置いて,HTF_RSIとHTF_MACDの交差点を強度フィルターとして使用します.

  3. 市場メカニズム識別アルゴリズム

    • トレンド型市場:ADX>20で,MAの差はATRの0.3倍以上で,高いタイムフレームのトレンドが確認される
    • 区間型市場:ADX <25と価格範囲比率は0.03未満,高時間枠中立
    • 波動的な市場:ブリン帯域幅は平均幅の1.5倍,ATRは平均ATRの1.2倍
    • 平静型市場:ブリン帯域幅は平均幅の0.8倍未満でATRは平均ATRの0.9倍未満
  4. 図形認識と交差量確認策略:多種高確率の図形状を検知する.これは,看板を飲み込む形状,線,夜星形状,穿刺線,双底,およびその看板対称形状である.各形状は取引量増強の確認,信号信頼性の強化を必要とする.

  5. 多要素評価システム:総合評価技術指標,形状識別,取引量状況,総合スコアを生成する. 買取シグナルには牛市≥1.0のスコアが必要,売出シグナルには熊市≥1.0のスコアが必要.

  6. ダイナミックストップと追跡ストップ:ATRを使用して動的ストップレベルを計算し,リスク管理が市場の変動に適応することを保証します.ストップ距離はATR値に応じて自動的に調整され,変動が増加すると拡大し,変動が減少すると縮小します.

  7. 自動最適化性能追跡システム: 異なる市場機構の下での取引のパフォーマンスを記録し,取引パラメータと評価値下げを調整し,戦略の自主的な最適化を実現します.

戦略的優位性

  1. 市場全体への適応この戦略の最も顕著な優点は,四つの異なる市場状態を自動的に認識し,それに適応でき,変化する市場環境における単一の戦略の限界を回避することです.市場が強いトレンド,横断整理,高波動または低波動の状態であるかどうかにかかわらず,システムはパラメータとシグナル値を適切に調整できます.

  2. 複数時間枠確認: 戦略は,より高い時間周期の指標を統合することによって,信号品質を大幅に向上させる.この”上から下へ”の分析方法は,低品質の信号を効果的にフィルターし,偽突破とノイズ取引を減らす.

  3. 高度形状認識: 交通量確認を組み合わせた図形状認識は,高確率の入場信号を提供する.これらの形状は,サポート位と抵抗位の近くで発生し,交通量拡大に伴って特に有効である.

  4. ダイナミックなリスク管理ATRベースのストップとトラッキングストップメカニズムは,リスク管理が市場の変動に自動的に調整することを保証します. この方法は,資本を保護しながら,利益のあるポジションを継続させ,リスクとリターンの比率を最適化します.

  5. 自動最適化メカニズム戦略は,異なる市場機構のパフォーマンスを記録し,将来の取引のためのフィードバックと調整の基盤を提供し,継続的な自己改善を実現します.

  6. 視覚的な監視: カラーコードの背景とパフォーマンス表で,トレーダーは,現在の市場状況,戦略のパフォーマンス,重要な指標を直観的に理解し,操作の透明性を高めます.

戦略リスク

  1. パラメータ感度:この戦略は,複数のパラメータと値を使用して,市場機構を識別し,信号を生成する.これらのパラメータの設定は,慎重に調整する必要があります.そうでなければ,市場状態を誤判したり,間違った信号を生成したりする可能性があります.特に,ADX,ATR比率,ブリン帯域などの重要な値は,異なる取引品種の特性に応じて最適化する必要があります.

  2. 計算の複雑さ複数の階層の指標計算と論理判断により,戦略の複雑性が増加し,特に低時間周期または高周波の取引環境では,反測とリアルタイム実行の速度が遅くなる可能性があります.

  3. 市場転換の遅れ: 戦略は,異なる市場状態を識別するために設計されているが,市場転換の過程は瞬間のものではなく,段階的である可能性がある. 転換の間,戦略は,誤判と間違った信号の危険にさらされる可能性がある.

  4. 技術指標への過度な依存戦略は,基本的要因や市場情勢を考慮せずに,技術指標や価格動向に基づいています. 重要なニュースや黒天の事件が発生した場合,純粋な技術分析は失効する可能性があります.

  5. 反射偏差戦略の複雑さと自己適応性により,過去データに過度に適合するリスクがあり,実際のパフォーマンスは反省結果より劣る可能性があります.

  6. 資本需要: ダイナミックなリスク管理メカニズムは,特定の市場条件下において,十分な取引資金を必要とし,合理的なリスク比率を維持するために,大きなストップ・ディスタンスを必要とする可能性があります.

最適化の方向

  1. 機械学習の強化:市場メカニズム識別とパラメータ調整を最適化するために機械学習アルゴリズムを導入する. 歴史データ訓練モデルを使用して,異なる市場状態の潜在的パターンを識別し,分類の正確性を向上させる. 実施方法には,ランダムフォレストまたはサポートベクトルマシンを使用して市場状態の分類,ニューラルネットワークを使用して指標の最適化重量を含むことができる.

  2. 感情指標の統合: 市場情緒指標を導入する (VIX,看落/看落オプション比率,ソーシャルメディア情緒分析など) 追加の確認層として. 市場情緒データは,市場転換点を予測するのに役立つ主要な指標として使用できます.

  3. 基本データ統合:経済カレンダーイベント,収益報告,または重要なニュースリリースなどの重要な基本データを統合するためのフレームワークを開発する.これは重要な発表の前にリスクフローチャーを調整し,意外な変動による損失を回避するのに役立ちます.

  4. タイムフィルター取引時間フィルターを適用し,流動性が低いまたは変動性の異常な時間を回避します.これは,アジア,ヨーロッパ,米国の市場での取引時に交差時間の異常な行動を避けるために,クロスマーケット取引において特に重要です.

  5. 関連性分析モジュール: 資産間関連性分析機能を追加し,多市場パターンと散布シグナルを識別する.例えば,通貨ペア間の関連性,株式指数とVIXの関係など,追加の取引確認を提供することができる.

  6. ダイナミック・ホールディング・スケールの最適化:現在の市場機構と過去の業績に基づいてポジションサイズを自動的に調整する. 市場機構が良好なパフォーマンスをしている場合,リスクの隙間を増加させ,不確実性や過去の不良な状況下でリスクを減らすことができます.

  7. ハードウェアの最適化:コードの効率を向上させ,特にリアルタイム取引環境での計算の複雑さを軽減する. 論理の一部を書き換え,より効率的なアルゴリズムとデータ構造を使用することを考慮することができる.

要約する

多時間枠自適化市場機構量化取引戦略は,多時間枠自適化市場機構識別,多時間枠分析,形状識別および動的リスク管理を統合した量化取引システムの重要な革新を表しています.その自適化能力と包括的な技術指標の統合は,単一の市場状態に限定されるのではなく,さまざまな市場環境で競争力を維持することを可能にします.

この戦略の真の価値は,単一の構成要素ではなく,全体的な枠組みにある.市場機構の識別,複数の時間枠の確認,形態の識別,および動的リスク管理の協同作用により,戦略は,高品質の信号を生成し,リスクを効果的に管理することができます.この多層のアプローチは,誤った信号を減らすと,全体的な安定性を向上させます.

しかし,この戦略は,パラメータの感受性,計算の複雑さ,潜在的過適合などの課題にも直面しています.この戦略を適用するトレーダーは,これらのリスクに注意し,十分なパラメータの最適化と前向きなテストを行うべきです.

将来の最適化の方向には,機械学習の強化,感情指標の統合,ダイナミックなポジション規模調整などが含まれる.これらの改善は,戦略の適応性と安定性をさらに向上させ,より包括的な取引システムにするだろう.全体的に,この戦略は,トレーダーのリスクの好みと市場の見解に応じてカスタマイズされ拡張できる強力なフレームワークを提供します.
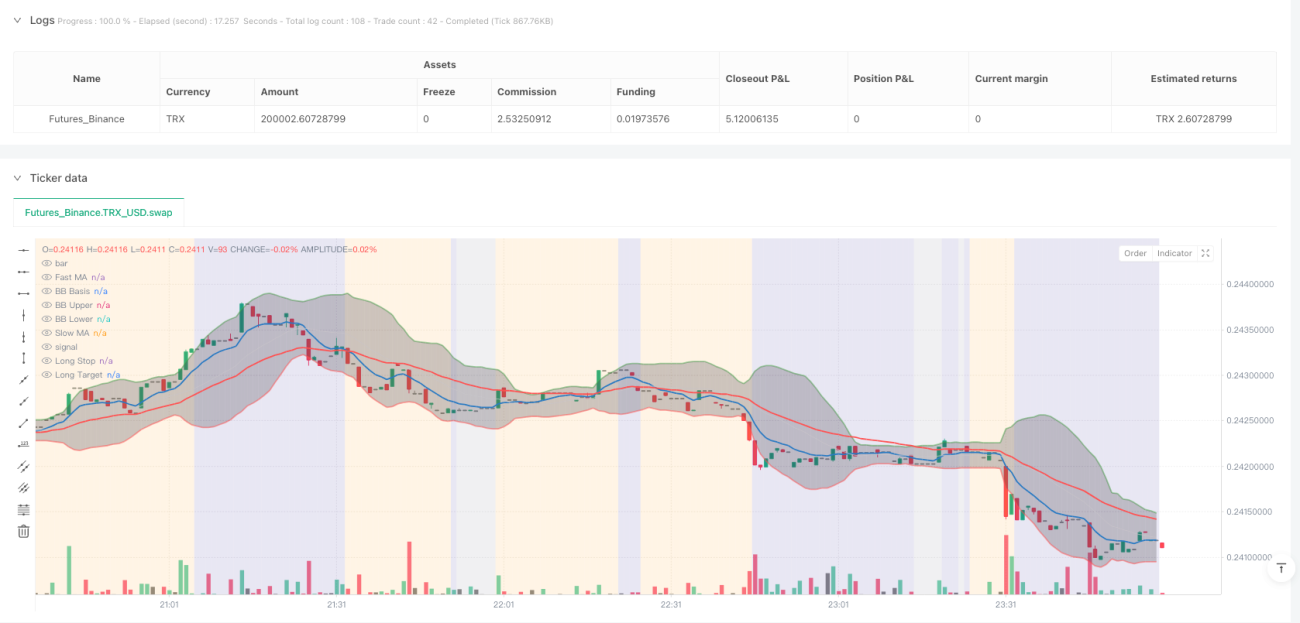
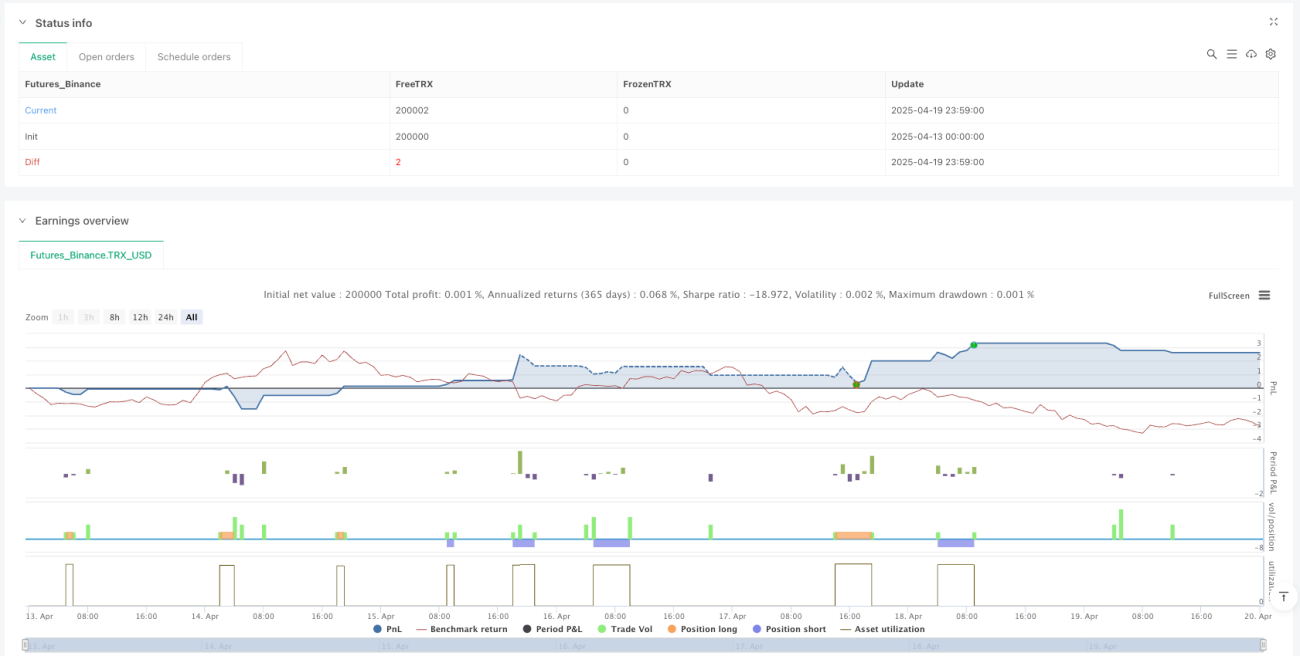
ストラテジーソースコード
/*backtest
start: 2025-04-13 00:00:00
end: 2025-04-20 00:00:00
period: 1m
basePeriod: 1m
exchanges: [{"eid":"Futures_Binance","currency":"TRX_USD"}]
*/

//@version=6
strategy("Dskyz (DAFE) AI Adaptive Regime - Pro", overlay=true, default_qty_type=strategy.fixed, default_qty_value=1, calc_on_order_fills=true, calc_on_every_tick=true)

// This script uses higher timeframe values for RSI/MACD, integrated into regime detection and scoring.
// Logic uses closed HTF bars to avoid repainting.

// D=====================================================Z
// 1. ATR SETTINGS==Z
// D=====================================================Z
group_atr = "⚡ ATR Settings"
atr_period     = input.int(14, "ATR Period", minval=1, group=group_atr)
atr_multiplier = input.float(1.5, "ATR Multiplier", minval=0.1, step=0.1, group=group_atr)
atr_val        = ta.atr(atr_period)
atr_avg        = ta.sma(atr_val, 50)

// D=====================================================Z
// 2. MOVING AVERAGE (MA) SETTINGS==Z
// D=====================================================Z
group_ma = "📊 Moving Averages"
fast_ma_length        = input.int(9, "Fast MA Length", minval=1, group=group_ma)
slow_ma_length        = input.int(34, "Slow MA Length", minval=1, group=group_ma)
ma_fast               = ta.ema(close, fast_ma_length)
ma_slow               = ta.ema(close, slow_ma_length)
ma_strength_threshold = input.float(0.5, "MA Strength Threshold", minval=0.0, step=0.1, group=group_ma)
trend_dir = ma_fast > ma_slow + (atr_val * ma_strength_threshold) ? 1 : ma_fast < ma_slow - (atr_val * ma_strength_threshold) ? -1 : 0

// D=====================================================Z
// 3. MULTI-TIMEFRAME (HTF) SETTINGS==Z
// D=====================================================Z
group_MTA = "⏱️ Multi-Timeframe Inputs"
htf = input.timeframe("D", "HTF for RSI & MACD", group=group_MTA)
htf_rsi_raw = request.security(syminfo.tickerid, htf, ta.rsi(close, 14))
htf_rsi = htf_rsi_raw[1]
[htf_macd_line_raw, htf_macd_signal_raw, htf_macd_hist_raw] = request.security(syminfo.tickerid, htf, ta.macd(close, 12, 26, 9))
htf_macd_line = htf_macd_line_raw[1]
htf_macd_signal = htf_macd_signal_raw[1]
htf_macd_hist = htf_macd_hist_raw[1]
// new: HTF trend direction for regime detection
htf_trend_bull = htf_macd_line > htf_macd_signal and htf_rsi > 50
htf_trend_bear = htf_macd_line < htf_macd_signal and htf_rsi < 50

// D=====================================================Z
// 4. TRADE SETTINGS==Z
// D=====================================================Z
group_trade = "⚙️ Trade Settings"
risk_per_trade      = input.int(500, "Risk per Trade ($)", minval=50, group=group_trade)
max_contracts       = input.int(5, "Max Contracts", minval=1, group=group_trade)
max_daily_drawdown  = input.float(0.05, "Max Daily Drawdown (%)", minval=0.01, group=group_trade)
tick_value          = input.float(12.5, "Tick Value ($)", minval=0.01, group=group_trade)
ticks_per_point     = input.int(4, "Ticks per Point", minval=1, group=group_trade)
default_stop_points = input.float(8.0, "Default Stop (Points)", minval=0.25, group=group_trade)

// D=====================================================Z
// 5. ADVANCED INDICATOR CALCULATIONS==Z
// D=====================================================Z

// --- ADX Calculation ---Z
adx_len   = 14
up        = ta.change(high)
down      = -ta.change(low)
plus_dm   = na(up) ? na : (up > down and up > 0 ? up : 0)
minus_dm  = na(down) ? na : (down > up and down > 0 ? down : 0)
trur      = ta.rma(ta.tr, adx_len)
plus_di   = 100 * ta.rma(plus_dm, adx_len) / trur
minus_di  = 100 * ta.rma(minus_dm, adx_len) / trur
adx_val   = 100 * ta.rma(math.abs(plus_di - minus_di) / (plus_di + minus_di), adx_len)

// --- Bollinger Bands Calculation ---Z
bb_basis     = ta.sma(close, 20)
bb_dev       = 2 * ta.stdev(close, 20)
bb_upper     = bb_basis + bb_dev
bb_lower     = bb_basis - bb_dev
bb_width     = (bb_upper - bb_lower) / bb_basis
bb_width_avg = ta.sma(bb_width, 50)

// --- Price Action Range ---Z
price_range = ta.highest(high, 20) - ta.lowest(low, 20)
range_ratio = price_range / close

// D=====================================================Z
// 6. REGIME ASSIGNMENT & PATTERN RECOGNITION==Z
// D=====================================================Z

// Regime assignment with HTF influence and looser thresholds
is_trending = adx_val > 20 and math.abs(ma_fast - ma_slow) > atr_val * 0.3 and htf_trend_bull or htf_trend_bear // loosened ADX and MA thresholds, added HTF
is_range    = adx_val < 25 and range_ratio < 0.03 and not htf_trend_bull and not htf_trend_bear // loosened ADX and range, HTF neutral
is_volatile = bb_width > bb_width_avg * 1.5 and atr_val > atr_avg * 1.2 and (htf_rsi > 70 or htf_rsi < 30) // loosened BB/ATR, added HTF overbought/oversold
is_quiet    = bb_width < bb_width_avg * 0.8 and atr_val < atr_avg * 0.9 // loosened BB/ATR
regime      = is_trending ? 1 : is_range ? 2 : is_volatile ? 3 : is_quiet ? 4 : 5
regime_name = regime == 1 ? "Trending" : regime == 2 ? "Range" : regime == 3 ? "Volatile" : regime == 4 ? "Quiet" : "Other"

// Pattern Recognition & Volume Confirmation-Z
vol_avg       = ta.sma(volume, 20)
vol_spike     = volume > vol_avg * 1.5
recent_low    = ta.lowest(low, 20)
recent_high   = ta.highest(high, 20)
is_near_support    = low <= recent_low * 1.01
is_near_resistance = high >= recent_high * 0.99

bullish_engulfing = close[1] < open[1] and close > open and close > open[1] and open < close[1] and is_near_support and vol_spike
hammer            = high - low > 3 * math.abs(open - close) and (close - low) / (0.001 + high - low) > 0.6 and is_near_support and vol_spike
morning_star      = close[2] < open[2] and math.abs(close[1] - open[1]) < 0.2 * (high[1] - low[1]) and close > open and close > (open[2] + close[2]) / 2 and is_near_support and vol_spike
piercing          = close[1] < open[1] and close > open and close > (open[1] + close[1]) / 2 and open < close[1] and is_near_support and vol_spike
double_bottom     = low < low[1] and low[1] > low[2] and low[2] < low[3] and close > open and is_near_support and vol_spike

bearish_engulfing = close[1] > open[1] and close < open and close < open[1] and open > close[1] and is_near_resistance and vol_spike
shooting_star     = high - low > 3 * math.abs(open - close) and (high - close) / (0.001 + high - low) > 0.6 and is_near_resistance and vol_spike
evening_star      = close[2] > open[2] and math.abs(close[1] - open[1]) < 0.2 * (high[1] - low[1]) and close < open and close < (open[2] + close[2]) / 2 and is_near_resistance and vol_spike
dark_cloud        = close[1] > open[1] and close < open and close < (open[1] + close[1]) / 2 and open > close[1] and is_near_resistance and vol_spike
double_top        = high > high[1] and high[1] < high[2] and high[2] > high[3] and close < open and is_near_resistance and vol_spike

bull_signal = (bullish_engulfing ? 0.5 : 0.0) +
              (hammer ? (regime == 2 ? 0.4 : 0.2) : 0.0) +
              (morning_star ? 0.2 : 0.0) +
              (piercing ? 0.2 : 0.0) +
              (double_bottom ? (regime == 3 ? 0.3 : 0.15) : 0.0)

bear_signal = (bearish_engulfing ? 0.5 : 0.0) +
              (shooting_star ? (regime == 2 ? 0.4 : 0.2) : 0.0) +
              (evening_star ? 0.2 : 0.0) +
              (dark_cloud ? 0.2 : 0.0) +
              (double_top ? (regime == 3 ? 0.3 : 0.15) : 0.0)

// Multi-Factor Confirmation with HTF-Z
rsi_val   = ta.rsi(close, 14)
[macd_line, macd_signal, macd_hist] = ta.macd(close, 12, 26, 9)
trend_bull = ma_fast > ma_slow
trend_bear = ma_fast < ma_slow
rsi_bull   = rsi_val < 30
rsi_bear   = rsi_val > 70
macd_bull  = macd_line > macd_signal
macd_bear  = macd_line < macd_signal
vol_expansion = atr_val > atr_avg * 1.2
// new: HTF confirmation for scoring
htf_bull_confirm = htf_trend_bull and htf_rsi < 70
htf_bear_confirm = htf_trend_bear and htf_rsi > 30

bull_score = bull_signal + (trend_bull ? 0.2 : 0) + (rsi_bull ? 0.15 : 0) + (macd_bull ? 0.15 : 0) + (vol_expansion ? 0.1 : 0) + (htf_bull_confirm ? 0.2 : 0)
bear_score = bear_signal + (trend_bear ? 0.2 : 0) + (rsi_bear ? 0.15 : 0) + (macd_bear ? 0.15 : 0) + (vol_expansion ? 0.1 : 0) + (htf_bear_confirm ? 0.2 : 0)

// D=====================================================Z
// 7. PERFORMANCE TRACKING & ADAPTIVE THRESHOLDS==Z
// D=====================================================Z
var float[] regime_pnl_long  = array.new_float(5, 0)
var float[] regime_pnl_short = array.new_float(5, 0)
var int[] regime_win_long    = array.new_int(5, 0)
var int[] regime_loss_long   = array.new_int(5, 0)
var int[] regime_win_short   = array.new_int(5, 0)
var int[] regime_loss_short  = array.new_int(5, 0)
var int entry_regime = na

if barstate.isconfirmed and strategy.closedtrades > 0 and not na(entry_regime)
    last_trade_profit = strategy.closedtrades.profit(strategy.closedtrades - 1)
    last_trade_entry_id = strategy.closedtrades.entry_id(strategy.closedtrades - 1)
    idx = entry_regime - 1
    if last_trade_entry_id == "Long"
        array.set(regime_pnl_long, idx, array.get(regime_pnl_long, idx) + last_trade_profit)
        if last_trade_profit > 0
            array.set(regime_win_long, idx, array.get(regime_win_long, idx) + 1)
        else
            array.set(regime_loss_long, idx, array.get(regime_loss_long, idx) + 1)
    else if last_trade_entry_id == "Short"
        array.set(regime_pnl_short, idx, array.get(regime_pnl_short, idx) + last_trade_profit)
        if last_trade_profit > 0
            array.set(regime_win_short, idx, array.get(regime_win_short, idx) + 1)
        else
            array.set(regime_loss_short, idx, array.get(regime_loss_short, idx) + 1)
    entry_regime := na

// D=====================================================Z
// 8. DRAWDOWN & CIRCUIT BREAKER==Z
// D=====================================================Z
var float max_equity = strategy.equity
if strategy.equity > max_equity
    max_equity := strategy.equity
daily_drawdown = (max_equity - strategy.equity) / max_equity
pause_trading  = daily_drawdown > max_daily_drawdown

// D=====================================================Z
// 9. ENTRY & EXIT LOGIC WITH DYNAMIC STOPS & TRAILING STOPS=Z
// D=====================================================Z
swing_low  = ta.lowest(low, 5)
swing_high = ta.highest(high, 5)
long_condition  = bull_score >= 1.0 and not pause_trading
short_condition = bear_score >= 1.0 and not pause_trading

var float trail_stop_long  = na
var float trail_stop_short = na
var float long_stop_price  = na
var float long_limit_price = na
var float short_stop_price = na
var float short_limit_price = na

if long_condition and strategy.position_size <= 0
    intended_stop = swing_low - atr_multiplier * atr_val
    stop_distance_points = close - intended_stop
    risk_per_contract = stop_distance_points * syminfo.pointvalue
    contracts = math.floor(risk_per_trade / risk_per_contract)
    contracts := contracts > 0 ? contracts : 1
    contracts := math.min(contracts, max_contracts)
    long_limit = close + stop_distance_points * 2
    strategy.entry("Long", strategy.long, qty = contracts)
    strategy.exit("Exit", from_entry = "Long", stop = intended_stop, limit = long_limit)
    long_stop_price  := intended_stop
    long_limit_price := long_limit
    trail_stop_long  := intended_stop
    entry_regime     := regime

if short_condition and strategy.position_size >= 0
    intended_stop = swing_high + atr_multiplier * atr_val
    stop_distance_points = intended_stop - close
    risk_per_contract = stop_distance_points * syminfo.pointvalue
    contracts = math.floor(risk_per_trade / risk_per_contract)
    contracts := contracts > 0 ? contracts : 1
    contracts := math.min(contracts, max_contracts)
    short_limit = close - stop_distance_points * 2
    strategy.entry("Short", strategy.short, qty = contracts)
    strategy.exit("Exit", from_entry = "Short", stop = intended_stop, limit = short_limit)
    short_stop_price  := intended_stop
    short_limit_price := short_limit
    trail_stop_short  := intended_stop
    entry_regime      := regime

if strategy.position_size > 0
    if close > long_limit_price * 0.5
        trail_stop_long := math.max(trail_stop_long, close - atr_val * atr_multiplier)
    strategy.exit("Long Trailing Stop", from_entry = "Long", stop = trail_stop_long)

if strategy.position_size < 0
    if close < short_limit_price * 0.5
        trail_stop_short := math.min(trail_stop_short, close + atr_val * atr_multiplier)
    strategy.exit("Short Trailing Stop", from_entry = "Short", stop = trail_stop_short)

if strategy.position_size == 0
    long_stop_price  := na
    long_limit_price := na
    short_stop_price := na
    short_limit_price := na

// D=====================================================Z
// 10. VISUALIZATION==Z
// D=====================================================Z
bgcolor(regime == 1 ? color.new(color.green, 85) : 
       regime == 2 ? color.new(color.orange, 85) : 
       regime == 3 ? color.new(color.red, 85) : 
       regime == 4 ? color.new(color.gray, 85) : 
       color.new(color.navy, 85))

plotshape(long_condition, style=shape.triangleup, location=location.belowbar, color=color.green, size=size.small, title="Long Signal")
plotshape(short_condition, style=shape.triangledown, location=location.abovebar, color=color.red, size=size.small, title="Short Signal")
plot(ma_fast, "Fast MA", color=color.new(color.blue, 0), linewidth=2)
plot(ma_slow, "Slow MA", color=color.new(color.red, 0), linewidth=2)
plot(strategy.position_size > 0 ? long_stop_price  : na, "Long Stop", color=color.new(color.red, 0), style=plot.style_linebr)
plot(strategy.position_size > 0 ? long_limit_price : na, "Long Target", color=color.new(color.green, 0), style=plot.style_linebr)
plot(strategy.position_size < 0 ? short_stop_price  : na, "Short Stop", color=color.new(color.red, 0), style=plot.style_linebr)
plot(strategy.position_size < 0 ? short_limit_price : na, "Short Target", color=color.new(color.green, 0), style=plot.style_linebr)

// D=====================================================Z
// 11. DASHBOARD: METRICS TABLE (Bottom-Left)=Z
// D=====================================================Z
var table dashboard = table.new(position.bottom_left, 2, 13, bgcolor=color.new(#000000, 29), border_color=color.rgb(80,80,80), border_width=1)
if barstate.islast
    table.cell(dashboard, 0, 0, "⚡(DAFE) AI Adaptive Regime™", text_color=color.rgb(96,8,118), text_size=size.small)
    modeStr = pause_trading ? "Paused" : "Active"
    table.cell(dashboard, 0, 1, "Mode:", text_color=color.white, text_size=size.small)
    table.cell(dashboard, 1, 1, modeStr, text_color=color.white, text_size=size.small)
    trendText = trend_dir == 1 ? "Bullish" : trend_dir == -1 ? "Bearish" : "Neutral"
    table.cell(dashboard, 0, 2, "Trend:", text_color=color.white, text_size=size.small)
    table.cell(dashboard, 1, 2, trendText, text_color=trend_dir == 1 ? color.green : trend_dir == -1 ? color.red : color.gray, text_size=size.small)
    table.cell(dashboard, 0, 3, "ATR:", text_color=color.white, text_size=size.small)
    table.cell(dashboard, 1, 3, str.tostring(atr_val, "#.##"), text_color=color.white, text_size=size.small)
    table.cell(dashboard, 0, 4, "ATR Avg:", text_color=color.white, text_size=size.small)
    table.cell(dashboard, 1, 4, str.tostring(atr_avg, "#.##"), text_color=color.white, text_size=size.small)
    table.cell(dashboard, 0, 5, "Volume Spike:", text_color=color.white, text_size=size.small)
    table.cell(dashboard, 1, 5, vol_spike ? "YES" : "NO", text_color=vol_spike ? color.green : color.red, text_size=size.small)
    table.cell(dashboard, 0, 6, "RSI:", text_color=color.white, text_size=size.small)
    table.cell(dashboard, 1, 6, str.tostring(rsi_val, "#.##"), text_color=color.white, text_size=size.small)
    rsiCondText = rsi_val < 30 ? "Oversold" : rsi_val > 70 ? "Overbought" : "Neutral"
    table.cell(dashboard, 0, 7, "RSI Cond:", text_color=color.white, text_size=size.small)
    table.cell(dashboard, 1, 7, rsiCondText, text_color=color.white, text_size=size.small)
    table.cell(dashboard, 0, 8, "HTF RSI:", text_color=color.white, text_size=size.small)
    table.cell(dashboard, 1, 8, str.tostring(htf_rsi, "#.##"), text_color=color.white, text_size=size.small)
    htfTrendText = htf_trend_bull ? "Bullish" : htf_trend_bear ? "Bearish" : "Neutral"
    table.cell(dashboard, 0, 9, "HTF Trend:", text_color=color.white, text_size=size.small)
    table.cell(dashboard, 1, 9, htfTrendText, text_color=htf_trend_bull ? color.green : htf_trend_bear ? color.red : color.gray, text_size=size.small)
    lastSignal = long_condition ? "Buy" : short_condition ? "Sell" : "None"
    table.cell(dashboard, 0, 10, "Last Signal:", text_color=color.white, text_size=size.small)
    table.cell(dashboard, 1, 10, lastSignal, text_color=long_condition ? color.green : short_condition ? color.red : color.white, text_size=size.small)
    table.cell(dashboard, 0, 11, "Regime:", text_color=color.white, text_size=size.small)
    table.cell(dashboard, 1, 11, regime_name, text_color=color.white, text_size=size.small)
    table.cell(dashboard, 0, 12, "Bull Score:", text_color=color.white, text_size=size.small)
    table.cell(dashboard, 1, 12, str.tostring(bull_score, "#.##"), text_color=color.white, text_size=size.small)

// D=====================================================Z
// REGIME CONDITIONS
// D=====================================================Z
var table debug_table = table.new(position.top_right, 2, 5, bgcolor=color.new(#000000, 50), border_color=color.rgb(80,80,80), border_width=1)
if barstate.islast
    table.cell(debug_table, 0, 0, "Regime Conditions", text_color=color.rgb(96,8,118), text_size=size.small)
    table.cell(debug_table, 0, 1, "ADX:", text_color=color.white, text_size=size.small)
    table.cell(debug_table, 1, 1, str.tostring(adx_val, "#.##"), text_color=color.white, text_size=size.small)
    table.cell(debug_table, 0, 2, "BB Width Ratio:", text_color=color.white, text_size=size.small)
    table.cell(debug_table, 1, 2, str.tostring(bb_width / bb_width_avg, "#.##"), text_color=color.white, text_size=size.small)
    table.cell(debug_table, 0, 3, "ATR Ratio:", text_color=color.white, text_size=size.small)
    table.cell(debug_table, 1, 3, str.tostring(atr_val / atr_avg, "#.##"), text_color=color.white, text_size=size.small)
    table.cell(debug_table, 0, 4, "Range Ratio:", text_color=color.white, text_size=size.small)
    table.cell(debug_table, 1, 4, str.tostring(range_ratio, "#.##"), text_color=color.white, text_size=size.small)

// --- Bollinger Bands Visuals ---Z
p_bb_basis = plot(bb_basis, title="BB Basis", color=color.new(#ffffff, 50), linewidth=1)
p_bb_upper = plot(bb_upper, title="BB Upper", color=color.new(#4caf4f, 45), linewidth=2)
p_bb_lower = plot(bb_lower, title="BB Lower", color=color.new(#ff5252, 45), linewidth=2)
fill(p_bb_upper, p_bb_lower, color=color.new(#423645, 65))

//D=================================================================Z
// DASHBOARD: WATERMARK LOGO (Bottom-Right)
//D=================================================================Z
var table watermarkTable = table.new(position.bottom_right, 1, 1, bgcolor=color.rgb(0,0,0,80), border_color=color.rgb(0,50,137), border_width=1)
if barstate.islast
    table.cell(watermarkTable, 0, 0, "⚡ Dskyz (DAFE) AI Adaptive Regime - Pro", text_color=color.rgb(96,8,118), text_size=size.normal)

// --- ALERTS ---Z
alertcondition(long_condition, title="Long Signal Alert", message="Enhanced Strategy Long Signal")
alertcondition(short_condition, title="Short Signal Alert", message="Enhanced Strategy Short Signal")