
概要
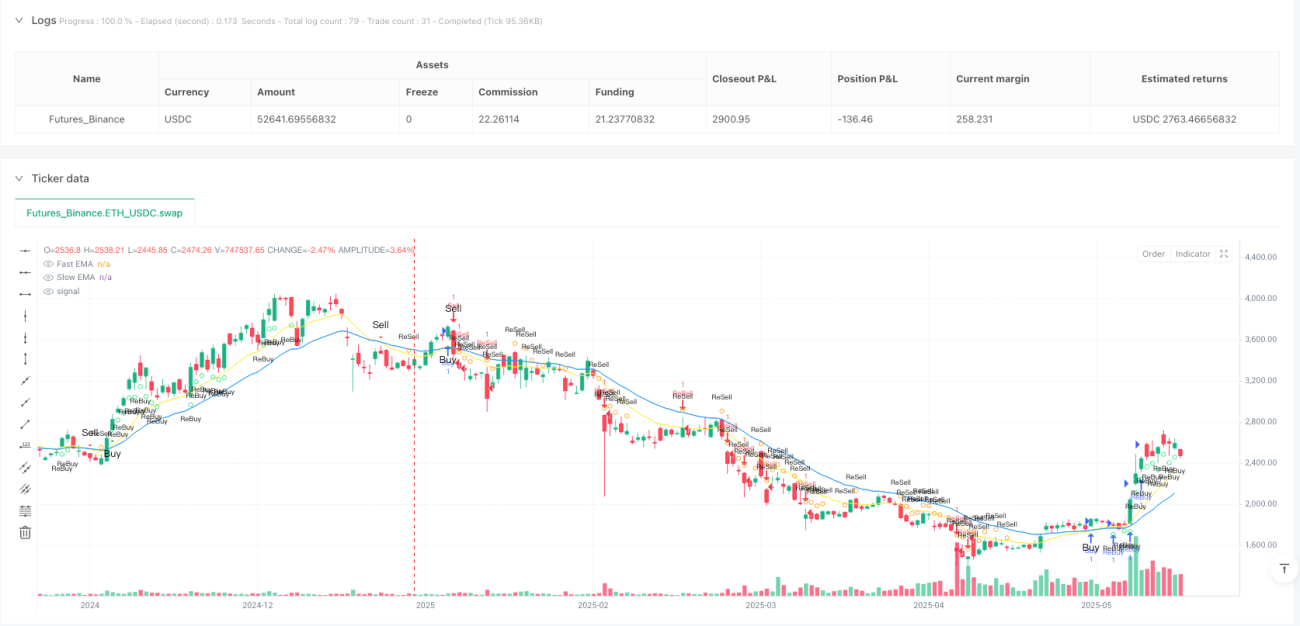
ダブル指数移動平均線出来高確認高頻度定量取引戦略は、EMA(指数移動平均線)のクロスと出来高確認に基づく高頻度取引戦略です。この戦略は主に短期EMAと長期EMAのクロスにより初期の売買シグナルを生成し、出来高確認を用いて既存トレンド中の押し目や戻り目を捉え、再エントリーシグナルを生成します。軽量で効率的な設計であり、速いペースの取引環境に適しており、特に短期トレーダーが多様な市場で応用するのに適しています。
戦略の原理
本戦略のコアロジックは、異なる期間の2本のEMA指標と出来高閾値の組み合わせに基づいています:
-
トレンド識別メカニズム:
- 14期間の短期EMAと28期間の長期EMAを使用して市場のトレンド方向を判断します。
- 短期EMAが長期EMAを上抜けた場合、上昇トレンドと識別します。
- 短期EMAが長期EMAを下抜けた場合、下降トレンドと識別します。
-
エントリーシグナルシステム:
- 初期買いシグナル:短期EMAが長期EMAを上抜ける。
- 初期売りシグナル:短期EMAが長期EMAを下抜ける。
- 再エントリー買いシグナル:上昇トレンド中に、価格が短期EMAより高く、かつ出来高が閾値を超える。
- 再エントリー売りシグナル:下降トレンド中に、価格が短期EMAより低く、かつ出来高が閾値を超える。
-
リスク管理フレームワーク:
- 10%の固定利確水準を採用。
- 1%のトレーリングストップを実施し、獲得した利益を保護します。
- 再エントリーメカニズムは未決済取引がない場合のみトリガーされ、過剰取引を回避します。
-
出来高確認:
- 出来高とその28期間SMAとの比率をフィルター条件として使用します。
- 現在の出来高がSMAの倍数(デフォルトは1倍)より大きい場合のみ、再エントリーシグナルが有効となります。
戦略の優位性
コードを詳細に分析した結果、本戦略には以下の顕著な利点があります:
-
応答速度が速い:SMAではなくEMAを使用するため、価格変動に対する反応が敏感で、速いペースの取引環境に適しています。
-
偽シグナルリスクの低減:出来高確認メカニズムを組み合わせることで、再エントリーシグナルの品質を高め、市場ノイズを効果的にフィルタリングします。
-
柔軟な資金管理:口座残高の割合に基づくポジション管理方式を採用し、取引規模を自動調整して資金管理リスクを低減します。
-
多次元のリスク管理:固定利確とトレーリングストップを同時に使用し、利益目標の達成と既得利益の保護を両立します。
-
トレンド内再エントリーメカニズム:初期シグナルを逃したトレーダーでも、トレンド継続中に高確率のエントリーポイントを見つけることができます。
-
可視化された取引シグナル:異なる形状や色のマーカーで各種取引シグナルを明確に表示し、戦略の可読性を高めます。
-
自動化サポート:アラート条件とメッセージ形式が内蔵されており、Webhookを介した取引自動化が容易です。
戦略のリスク
本戦略は精巧に設計されていますが、以下の潜在的なリスクがあります:
-
急反転リスク:高ボラティリティ市場では、EMAクロスが遅れる可能性があり、市場反転時にエントリーまたはストップが遅れることがあります。
- 解決策:ボラティリティフィルターを追加し、異常に高いボラティリティ時にパラメータを調整するか取引を一時停止することを検討。
-
過剰取引リスク:レンジ相場では、EMAが頻繁にクロスし、多くの取引シグナルが発生する可能性があります。
- 解決策:より長期のトレンド確認指標を追加するか、レンジ相場では取引を一時停止する。
-
固定パラメータの有効性低下リスク:固定のEMA期間や利確・ストップ比率は、すべての市場環境に適するとは限りません。
- 解決策:適応型パラメータ調整メカニズムを実装し、市場のボラティリティに応じて動的にパラメータを調整する。
-
出来高異常の影響:出来高確認に依存するため、低流動性市場や異常な出来高期間では効果が低下する可能性があります。
- 解決策:OBVや出来高ボラティリティ指標などの追加の出来高分析指標を導入することを検討。
-
単一技術指標への依存:EMAクロスに過度に依存することで、他の重要な市場シグナルを見落とす可能性があります。
- 解決策:RSIやMACDなどの他の技術指標を統合し、多因子取引モデルを構築する。
戦略の最適化の方向性
コードの分析に基づき、本戦略は以下の方向性で最適化できます:
-
パラメータ適応メカニズム:
- EMAパラメータを市場のボラティリティに応じて動的に調整し、異なるボラティリティ環境で自動的に最適化します。
- 理由:固定パラメータは市場環境によって効果が大きく異なり、適応型パラメータは戦略の安定性を向上させます。
-
マルチタイムフレーム分析:
- より長期のトレンド確認を統合し、大きなトレンド方向にのみ取引を実行します。
- 理由:マルチタイムフレームの共振により取引成功率が大幅に向上し、レンジ相場での偽シグナルを減少させます。
-
高度なストップロスメカニズム:
- ATRに基づく動的ストップロスを実装し、固定パーセンテージストップロスを置き換えます。
- 理由:市場のボラティリティは時期によって大きく異なり、ATRストップロスは市場状態により適応します。
-
エントリー最適化:
- サポート・レジスタンスブレイクアウト確認などのプライスアクションパターン認識を追加します。
- 理由:純粋な指標クロスは遅れる可能性があり、プライスアクションの組み合わせによりエントリータイミングの精度が向上します。
-
市場状態分類:
- 市場状態(トレンド、レンジ、激しい変動)を識別し、異なる市場状態に応じて異なるパラメータ設定を使用します。
- 理由:市場状態によって戦略のパフォーマンスは大きく異なり、対象を絞った最適化により全体効果が大幅に向上します。
-
出来高分析の強化:
- 出来高パターン分析を追加し、例えば出来高の増加がトレンド強度を確認するなどの要素を考慮します。
- 理由:現在の単純な出来高閾値では、重要な出来高構造情報を見落とす可能性があります。
まとめ
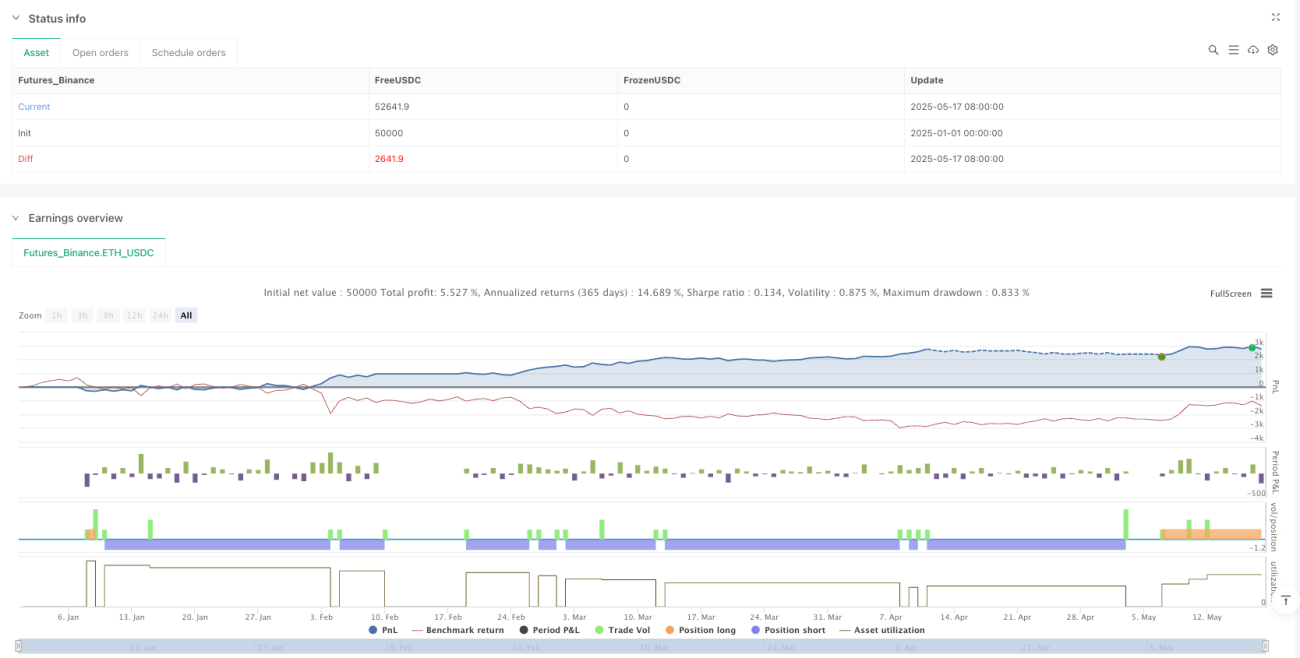
ダブル指数移動平均線出来高確認高頻度定量取引戦略は、精巧に設計されたEMAクロスシステムであり、出来高確認によりシグナル品質を高めています。本戦略はトレンドフォローと再エントリーシグナルにおいて優れた性能を発揮し、固定利確とトレーリングストップにより比較的完全なリスク管理を実現しています。
本戦略の最も際立った特徴は、初期トレンドエントリーとトレンド内再エントリーの二重メカニズムを組み合わせていることで、トレーダーが複数の価格ポイントで同一トレンドの利益機会を捉えることを可能にします。同時に、軽量設計と内蔵アラートシステムにより、高速取引や自動化システムとの統合に非常に適しています。
しかし、実際の取引で持続的に安定した効果を得るためには、本戦略は異なる市場環境に応じたパラメータ最適化と、適応型メカニズムや複数指標による確認の追加が必要です。特に高ボラティリティやレンジ相場では、追加のフィルター条件が偽シグナルや過剰取引のリスクを低減するのに役立ちます。
総じて、これは機能が充実しロジックが明確な短期取引戦略であり、経験豊富なトレーダーが実務でさらに最適化し応用するのに適しています。
- 1