多層フィボナッチ・トレンド追跡とヘッジ取引戦略システム

概要
多層フィボナッチトレンド追跡・ヘッジ取引戦略システムは、複数のテクニカル分析指標を統合した総合的な定量取引戦略です。本戦略はフィボナッチリトレースメント理論を核とし、指数移動平均線(EMA)、平均真実レンジ(ATR)、平均方向性指数(ADX)、方向性移動指標(DMI)などの複数のテクニカル指標を組み合わせることで、多面的な市場分析フレームワークを構築しています。伝統的なトレンド追跡機能に加え、リバウンド取引メカニズムとヘッジ機能も統合しており、様々な市場条件下で収益機会を捉え、リスクを効果的に管理することを目指しています。
本戦略の独自性は、多層的なリスク管理体制と柔軟な取引モードにあります。複数の利確目標(TP1、TP2)とATRベースの動的ストップロスメカニズムを設定することで、資本を保護しながら収益可能性を最大化します。さらに、内蔵されたヘッジ機能により戦略に追加のリスクバッファーが加わり、ボラティリティの高い市場環境でも比較的安定したパフォーマンスを維持できます。
戦略原理
戦略の核心ロジックは、フィボナッチリトレースメント理論とトレンド分析の組み合わせに基づきます。まず、指定期間内の最高値と最安値を計算し、23.6%、38.2%、50%、61.8%、78.6%、100%、161.8%などの主要なフィボナッチリトレースメント水準を決定します。これらの水準は重要なサポート・レジスタンスラインとして機能し、取引シグナル生成の重要な参考となります。
トレンドの識別においては、50期間指数移動平均線を主要なトレンド判断ツールとして採用します。価格が連続3本のローソク足でEMAの上に位置する場合、上昇トレンドとみなされます。逆に以下の場合は下降トレンドです。同時に、価格構造を分析し、より高い安値とより高い高値を識別することで強気構造を確認し、より低い高値とより低い安値で弱気構造を確認します。
ADXとDMIの導入により、トレンド強度の判断精度が向上します。ADX値が20より大きい場合、強いトレンドの基準とされ、+DIと-DIの相対的な強弱がトレンドの方向性を決定します。出来高分析も戦略の重要な構成要素であり、出来高が20期間平均の1.2倍を超える場合、有効な出来高確認とみなされます。
取引シグナルの生成には、複数の条件が同時に成立する必要があります:トレンド方向が明確、価格が重要なフィボナッチ水準に接近、トレンド強度が十分、方向性指標が確認、出来高が拡大。この多重フィルタリングメカニズムにより、シグナルの信頼性が大幅に向上し、偽シグナルの確率が低減されます。
戦略の優位性
本戦略には複数の顕著な優位性があります。まず、総合的なテクニカル分析フレームワークです。フィボナッチ理論、トレンド分析、モメンタム指標、出来高分析を統合することで、複数の視点から市場状況を評価し、より包括的で正確な取引シグナルを提供します。この多指標融合アプローチは、単一指標による誤ったシグナルの可能性を効果的に低減し、戦略全体の安定性と信頼性を向上させます。
戦略のリスク管理体制はもう一つの大きな優位点です。二重利確メカニズムにより、トレーダーは最初の目標到達時に一部の利益を確定しつつ、残りのポジションでより大きな利益を追求できます。ATRベースの動的ストップロス設定は、市場のボラティリティに応じてリスク管理水準を自動調整し、低ボラティリティ時にはストップロスを引き締めて利益を保護し、高ボラティリティ時にはストップロスを緩めて正常な変動による振り落としを防ぎます。
リバウンド取引機能は、戦略に追加の収益機会をもたらします。価格が重要なサポート・レジスタンス水準でリバウンドした際、戦略はこの短期逆転相場を迅速に識別して参加し、トレンド取引に加えてさらなる取引機会を提供します。この柔軟性により、強いトレンド市場やレンジ相場など、様々な市場条件に適応し、適切な取引機会を見つけることができます。
ヘッジ機能の統合は、本戦略の革新的な特徴です。ロングポジション保有中にショートシグナルが発生した場合、戦略はヘッジのためのショートポジションを開設します。逆も同様です。このメカニズムは、市場が急反転した際に追加の保護を提供し、潜在的な損失を軽減し、新たな収益機会に転換する可能性があります。
タイムフィルターの設定は、過剰取引を防止します。連続するシグナル間に少なくとも5本のローソク足の間隔を要求することで、短時間での頻繁なポジション開設を避け、取引コストを低減し、シグナルの品質を向上させます。
戦略リスク
本戦略には複数の利点がある一方、注意すべきリスク要因も存在します。まず、パラメーター依存性リスクです。戦略にはフィボナッチ周期、許容範囲、ATR倍率など、複数のパラメーター設定が含まれており、これらの選択は戦略のパフォーマンスに大きな影響を与えます。不適切なパラメーター設定は、過去データへの過適合や実市場での劣悪なパフォーマンスを招く可能性があります。そのため、十分なバックテストとパラメーター最適化を通じて、特定の市場と時間枠に最適なパラメーター組み合わせを見つける必要があります。
市場環境への適応性も潜在的なリスクです。本戦略は主にテクニカル分析に基づいており、ファンダメンタルズ主導の強い一方向相場など、特定の市場条件下ではパフォーマンスが低下する可能性があります。また、極度に低いボラティリティや高いボラティリティの市場環境では、シグナル生成頻度や精度が影響を受ける可能性があります。
スリッページと執行リスクも考慮すべきです。実際の取引では、特にボラティリティの高い市場条件下では、注文執行価格と期待価格に差が生じることがあります。このスリッページコストは戦略の理論的利益を侵食する可能性があり、特に頻繁に取引を行う戦略では顕著です。
ヘッジ機能は追加の保護を提供する一方、戦略の複雑さも増大させます。場合によっては、ヘッジ操作によりロング・ショート両方のポジションが損失を被ったり、手数料面で追加コストが発生する可能性があります。そのため、ヘッジ機能の実際の効果を慎重に評価し、特定の市場条件下で有効にするかどうかを検討する必要があります。
戦略最適化の方向性
戦略のパフォーマンスをさらに向上させるため、複数の方向性から最適化が可能です。まず、動的パラメーター調整メカニズムの導入です。市場のボラティリティ、トレンド強度などに応じて、フィボナッチ周期やATR倍率などの主要パラメーターを動的に調整できます。例えば、高ボラティリティ市場ではATR倍率を上げてストップロス幅を広げ、低ボラティリティ市場ではATR倍率を下げてリスクコントロールを引き締めます。
機械学習技術の統合も重要な最適化方向です。機械学習アルゴリズムを使用して最適なエントリータイミングを識別したり、過去データからパラメーター組み合わせの最適構成を学習できます。また、自然言語処理技術を用いて市場センチメントやニュースイベントが価格に与える影響を分析し、戦略にファンダメンタル分析の次元を追加することも可能です。
複数時間枠分析の統合は、より包括的な市場視点を提供します。より長い時間枠で大きなトレンド方向を確認し、より短い時間枠で正確なエントリーポイントを探すことができます。この複数時間枠の協調分析により、シグナル品質が向上し、逆張りトレードのリスクが低減されます。
資金管理の最適化も戦略パフォーマンス向上の重要な手段です。市場条件や戦略の確信度などに応じて、ポジションサイズを動的に調整できます。例えば、確信度の高いシグナルではポジションを増やし、確信度の低いシグナルではポジションを減らします。また、最大ドローダウン制御メカニズムを導入し、戦略が大きな損失を被った場合に自動的にポジションを減らしたり、取引を休止することも可能です。
利確・ストップロスのロジックをさらに精緻化することも検討に値します。トレーリングストップメカニズムを導入し、価格動向に応じてストップロス位置を動的に調整することで、より多くの利益を確保できます。同時に、市場構造の特徴に基づき、よりスマートな利確目標を設定することもできます。例えば、主要なレジスタンスライン付近で早期に利確します。
まとめ
多層フィボナッチトレンド追跡・ヘッジ取引戦略システムは、現代の定量取引技術における重要な発展方向を示しています。本戦略は複数の古典的なテクニカル分析ツールを巧みに統合し、堅牢かつ柔軟な取引フレームワークを構築しています。多重フィルタリングメカニズムによりシグナル品質を確保し、多層的なリスク管理体制により効果的な資本保護を提供し、ヘッジ機能により戦略に追加の安全余裕をもたらしています。
戦略を成功裏に実施するには、その基本原理と動作メカニズムを十分に理解し、取引環境に応じて適切なパラメーター調整と最適化を行う必要があります。理論上は良好な設計ですが、実際の適用では市場の微細構造、取引コスト、スリッページなどの現実要因を考慮する必要があります。
人工知能と機械学習技術の継続的な発展に伴い、本戦略にはさらなる最適化の余地があります。より高度なデータ分析技術と適応メカニズムを導入することで、戦略のパフォーマンスはさらに向上することが期待されます。定量トレーダーにとって、このような総合戦略は貴重な学習・改善プラットフォームを提供し、市場ダイナミクスとリスク管理の重要性への深い理解に貢献します。
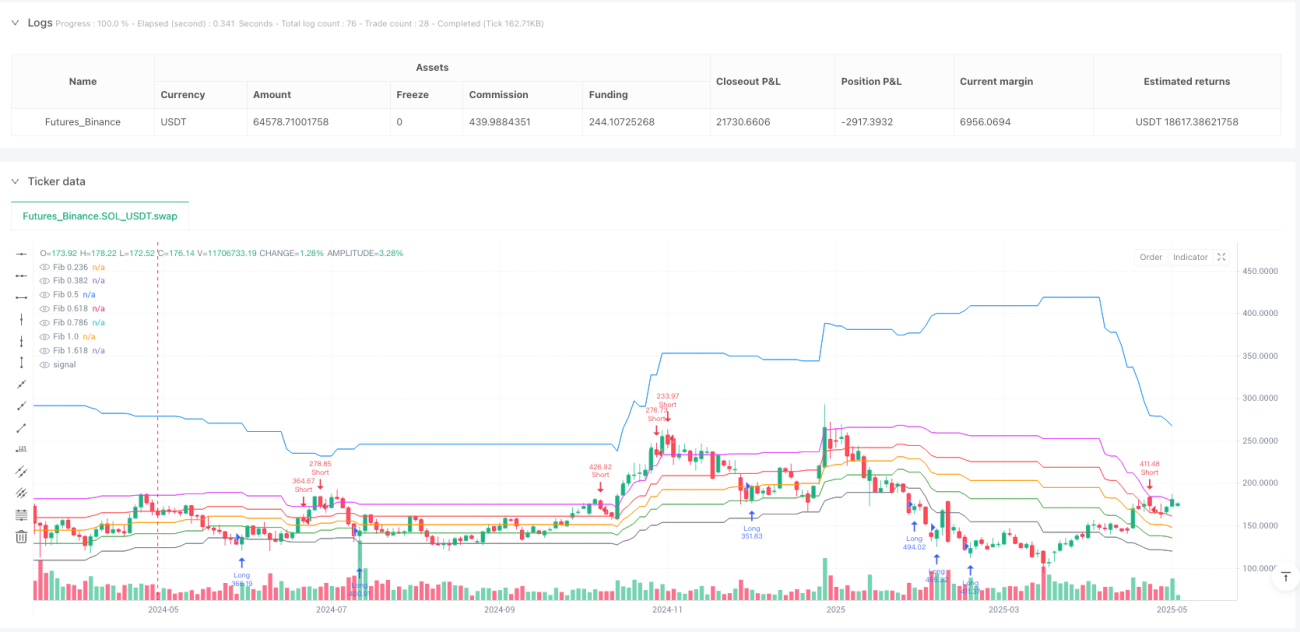
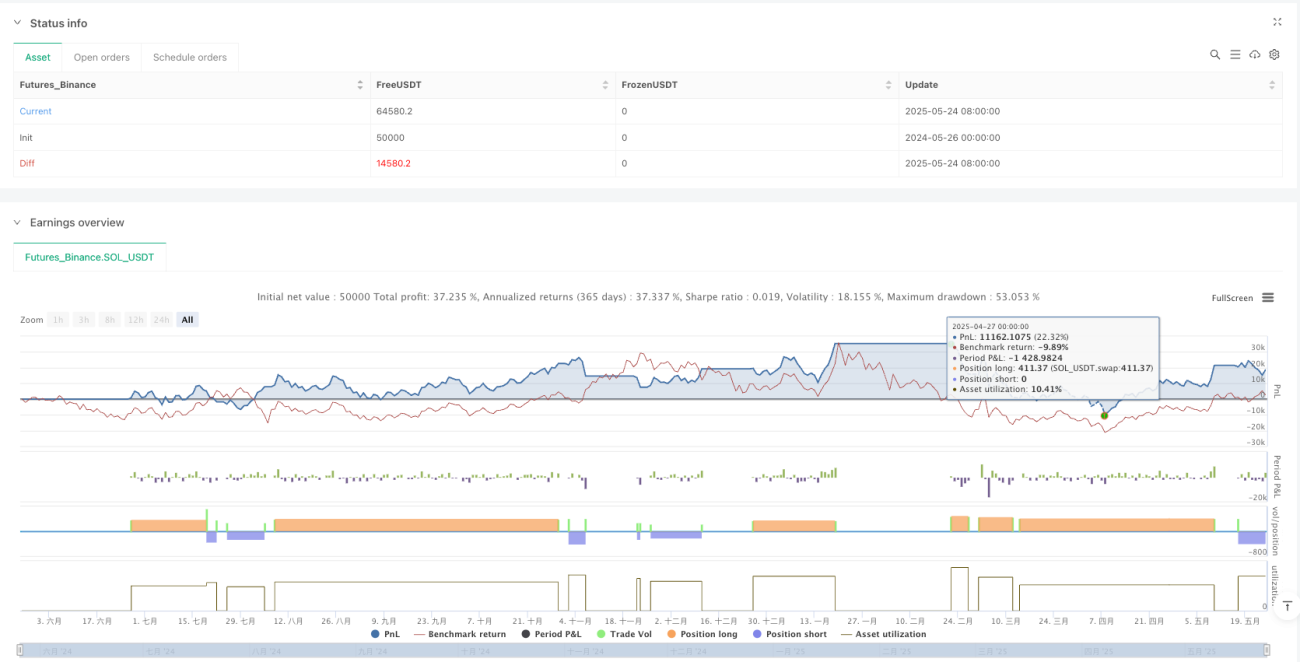
/*backtest
start: 2024-05-26 00:00:00
end: 2025-05-25 00:00:00
period: 2d
basePeriod: 2d
exchanges: [{"eid":"Futures_Binance","currency":"SOL_USDT"}]
*/

//@version=5
strategy("Fibonacci Trend v6.4 - TP/SL Labels", overlay=true, default_qty_type=strategy.percent_of_equity, default_qty_value=100)

// === Parameters ===- 1