
概要
ボラティリティ最適化RSI平均回帰取引戦略は、RSI(相対力指数)平均回帰シグナル、スマートマーケットフィルター、ボラティリティ適応型リスク管理を組み合わせた定量取引戦略です。この戦略は主に、RSIが極端な水準に達した際の高確率な反転機会(RSI≤30で売られ過ぎ、RSI≥70で買われ過ぎ)を識別しますが、平均回帰戦略に有利な市場条件でのみ取引を行います。コードを詳細に分析することで、この戦略の核はテクニカル指標と市場状態の分析を組み合わせ、取引判断を最適化し、さまざまな市場条件下でのパフォーマンスを最大化することにあることがわかります。
戦略の原理
ボラティリティ最適化RSI平均回帰取引戦略の原理は、以下の主要コンポーネントに基づいています。
-
RSIシグナルシステム:14期間のRSI指標を使用して市場の買われ過ぎ・売られ過ぎ状態を識別します。RSIが30を下回ると市場は売られ過ぎと見なされ、買いシグナルが発生します。RSIが70を上回ると市場は買われ過ぎと見なされ、売りシグナルが発生します。
-
トレンド分析:戦略は50期間の単純移動平均線(SMA)を使用して市場の方向性を判断します。価格が移動平均線を上回っている場合は上昇トレンド、下回っている場合は下降トレンドを示します。さらに重要なのは、戦略がトレンドの強さを計算し、強いトレンド市場(トレンド強度>25%)では取引を回避することです。これは、平均回帰戦略がこれらの条件下で通常うまく機能しないためです。
-
市場適応性分析:コードは直近期間のボラティリティを計算し、市場のボラティリティが平均回帰戦略をサポートするのに十分大きいこと(日次ボラティリティ>1%)を確認します。また、トレンド強度が許容範囲内(≤25%)であるかどうかをチェックします。これらの基準を満たした場合にのみ、戦略はエントリーを検討します。
-
リスク管理:戦略は20%のストップロスを実施し、ボラティリティの高い資産に十分な価格変動の余地を提供すると同時に、20%の利益目標を設定し、1:1のリスク/リワード比率を確保します。各取引では5%の資金を使用し、最大2ポジションまでのピラミッディングを許可することで、強いセットアップ時にポジションを拡大できます。
-
シグナル確認とエグジット:エントリーシグナルには、RSIが極値に達し、市場状況が適していることが必要です。エグジット条件には、RSIの反転(反対の極値に達する)、ストップロスのトリガー、または利益目標の達成が含まれます。
戦略の利点
コードを詳細に分析することで、この戦略は以下の顕著な利点を示します。
-
市場環境適応性:基本的なRSI戦略とは異なり、この戦略は市場状態分析を通じて取引シグナルをフィルタリングし、平均回帰戦略に適さない市場環境での取引を回避することで、シグナル品質を大幅に向上させます。
-
ボラティリティ適応型リスク管理:20%のストップロス水準を設定し、ボラティリティの高い資産向けに設計されているため、通常の市場変動による早期エグジットを防ぎつつ、適切な保護措置を提供します。
-
正確なエントリー条件:RSI極値、トレンド分析、ボラティリティチェックを組み合わせることで、高確率なセットアップでのみエントリーし、偽シグナルを削減します。
-
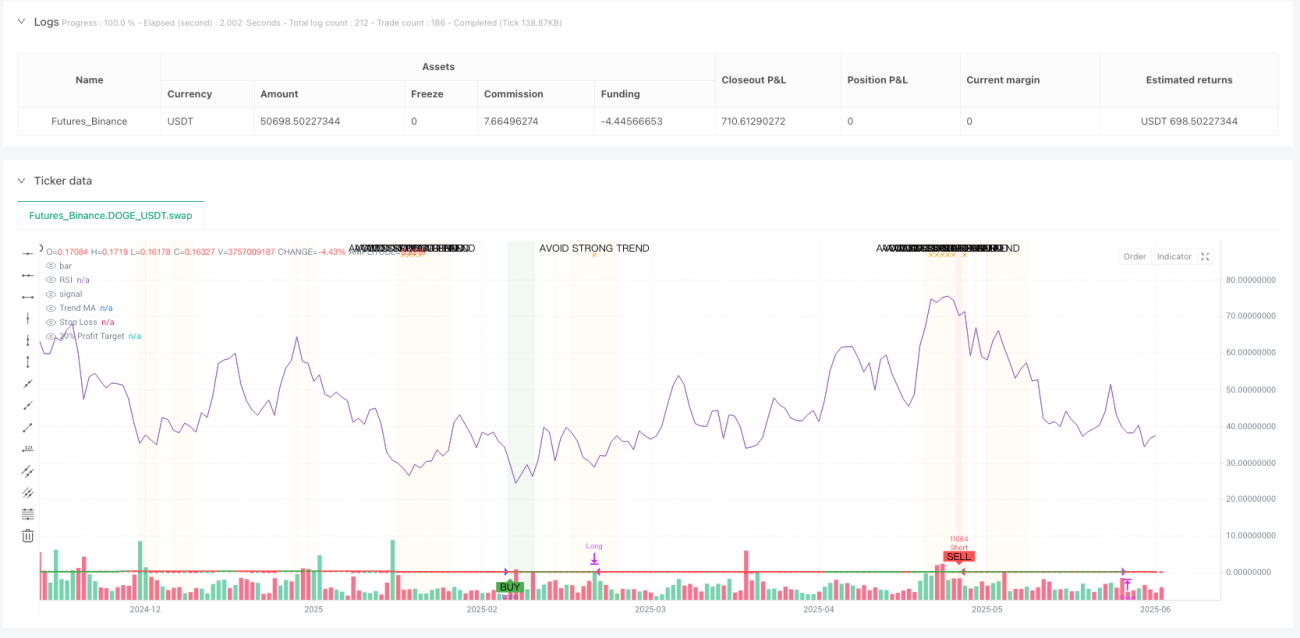
視覚的な判断サポート:戦略は背景色の変更(緑色の背景は購入に適した領域、赤色の背景は売りに適した領域を示す)と警告ラベル(オレンジ色の警告は強いトレンドが検出されたため取引を避けるべきことを示す)を提供し、取引判断の直感性を高めます。
-
自動化に親和性:完全なアラート条件システムが組み込まれており、自動取引実行をサポートするため、手動での市場監視は不要です。
-
動的情報テーブル:現在のRSI値、トレンド強度、ボラティリティ、市場適応性評価など、市場状況と取引状態をリアルタイムで表示し、トレーダーに包括的な市場視点を提供します。
戦略のリスク
この戦略は合理的に設計されていますが、いくつかの潜在的なリスクが存在します。
-
パラメータ感応性:戦略のパフォーマンスは、RSI期間、買われ過ぎ・売られ過ぎの水準、最大トレンド強度、ボラティリティ閾値などの入力パラメータに大きく依存します。市場環境が異なれば異なるパラメータ最適化が必要となる場合があり、誤ったパラメータは戦略のパフォーマンス低下につながる可能性があります。
-
極端な市場条件:市場の暴落や極端なボラティリティ時には、20%のストップロスを設定していても、スリッページリスクに直面し、実際の損失が予想を上回る可能性があります。
-
資金配分リスク:デフォルトでは各取引に5%の資金を使用し、最大2ポジション(合計10%)を許可していますが、これは一部のトレーダーにとって、特に市場のボラティリティが高い場合には過度にアグレッシブである可能性があります。
-
トレンド判断のタイムラグ:50期間の移動平均線を使用したトレンド判断は、ラグを生じさせ、トレンドが変化した直後に誤った判断を下す可能性があります。
-
過剰フィルタリングのリスク:厳格な市場適応性チェック(弱いトレンド+十分なボラティリティ)により、取引機会が過度にフィルタリングされ、特定の市場環境では取引頻度が低くなりすぎる可能性があります。
解決方法としては、以下のものがあります:市場や時間枠に応じたパラメータ最適化、極端な市場条件下での自動取引の停止、個人のリスク許容度に応じた資金配分比率の調整、トレンド判断のラグを減らすためのより短い期間の移動平均線の使用、取引頻度を増やすための市場適応性基準の適切な緩和。
戦略の最適化方向性
コード分析に基づき、この戦略は以下の方向性で最適化できます。
-
動的パラメータ調整:RSIの買われ過ぎ・売られ過ぎの閾値を動的変数として設計し、過去のボラティリティに基づいて自動調整します。低ボラティリティ環境ではより狭い閾値範囲(例:35/65)、高ボラティリティ環境ではより広い閾値範囲(例:25/75)を使用します。これにより、戦略はさまざまな市場状態によりよく適応できるようになります。
-
マルチタイムフレーム分析:マルチタイムフレーム確認メカニズムを追加します。例えば、より長い時間枠で市場状態を確認し、より短い時間枠でエントリーシグナルを探します。このアプローチにより、シグナル品質が向上し、偽のブレイクアウトが減少します。
-
動的ストップロス戦略:固定パーセンテージではなく、ATR(平均真の範囲)に基づいてストップロス水準を設定します。これにより、ストップロスが現在の市場ボラティリティ状況によりよく適応し、高ボラティリティ時にストップロスが近すぎる、または低ボラティリティ時に遠すぎることを防ぎます。
-
部分的な利益確定メカニズム:全ポジションを20%の利益目標でエグジットするのではなく、段階的な利益確定戦略を実施します。例えば、10%の利益で50%のポジションをエグジットし、20%の利益で残りのポジションをエグジットします。これにより、一部の利益を確定しつつ、残りのポジションがさらに大きな利益を得る可能性を残します。
-
季節性および市場サイクル分析:市場の季節性とサイクル分析を統合し、歴史的に平均回帰戦略が良好に機能した期間では取引頻度を上げ、トレンドが強い期間では取引頻度を下げるかパラメータを調整します。
-
機械学習による最適化:機械学習技術を使用して、現在の市場環境における平均回帰戦略の成功確率を動的に予測し、それに基づいてエントリー基準とポジションサイズを調整します。これにより、戦略は市場の変化によりインテリジェントに適応できるようになります。
まとめ
ボラティリティ最適化RSI平均回帰取引戦略は、包括的かつインテリジェントな取引システムであり、基本的なRSI戦略の主な欠点を解決し、市場コンテキスト分析とボラティリティ適応型リスク管理を追加することで、戦略のパフォーマンスを大幅に向上させています。この戦略は、特に日次ボラティリティが1%以上の資産、特にレンジ相場や弱いトレンド市場に適しています。
戦略の核心的な利点は、そのスマートな市場フィルタリングメカニズムにあり、平均回帰取引に適した市場条件下でのみシグナルを生成し、適切なリスク管理措置を通じて資金を保護します。同時に、完全な視覚化システムと情報テーブルは、明確な市場状態の概要を提供し、より賢明な取引判断をサポートします。
いくつかのリスクや最適化の余地はありますが、この戦略の基本設計は堅牢であり、提案された最適化の方向性を通じて、さまざまな市場環境での適応性とパフォーマンスをさらに向上させることができます。ボラティリティの高い市場で平均回収の機会を捉えようとするトレーダーにとって、これは価値のある戦略フレームワークです。
- 1