
概要
RSIとランダムなRSIの逆転取引戦略は,市場における重要な転換点を特定するために設計された高度な技術分析方法である.この戦略は,比較的強い指標 (RSI) とランダムな比較的強い指標 (SRSI) の力を組み合わせて,価格とこれらの動量指標の間の逆転を監視して潜在的トレンド変化を予測する.さらに,この戦略は,指数移動平均線 (EMA) をトレンドフィルターとして統合し,正確な振動距離フィルターを適用し,意味のある市場構造の変化を捕捉することを保証します.
戦略原則
この戦略の核心原則は,技術分析における偏差の概念に基づいている.偏差は,価格の動きが技術指標の動きと一致しないときに発生し,通常,現在の傾向が逆転する可能性があることを示している.この戦略は,4種類の偏差に焦点を当てている.
- 普段から目を見張る価格が低調に創新するが,RSIまたはSRSIが低調に創新できていない場合.これは下落の動力が弱まっていることを示し,上昇傾向の始まりを示唆する可能性があります.
- 典型的な下落から価格が高くなっているが,RSIまたはSRSIが高くなっていない場合,これは上昇力が弱まっていることを示し,下降傾向の始まりを示唆する可能性があります.
- 隠れた見張りの背き価格が前低値より高く,しかしRSIまたはSRSIが前低値より低い場合.これは通常,上昇傾向の逆戻りを示し,主要な上昇傾向が継続することを予兆する.
- 隠された下落価格が前高より下がっているが,RSIまたはSRSIが前高より上がっている場合.これは通常,下降傾向の反発を示し,主要な下降傾向が継続することを予兆する.
この戦略は,厳格なフィルタリング条件を用いて, 信号の質を保証します.
- 注目される変動点を検索するために,遡及期間 (デフォルトの40サイクル) を使用します.
- 微小な波動をフィルタリングするために最小の振動距離を要求します.
- 最小価格変動のパーセントの要求値と最後の変動点 (デフォルトは0.5%)
偏差が検出されたとき,戦略はグラフにタグと接続線を描画し,トレーダーにこれらの重要な信号を直感的に識別できるようにする.また,戦略は偏差の信号に基づいて,自動的に多行と空行の入場信号を生成する.
戦略的優位性
- 多層の承認: RSIとランダムなRSIを組み合わせることで,偽の信号の可能性を減らす二重確認が提供されます. 両方の指標が偏差を示している場合,信号はより信頼性が高くなります.
- 全面的な脱線検知この戦略は,常規の偏差を検知するだけでなく,隠された偏差を検知し,トレーダーに全局的な市場視点を提供します.
- ビジュアル表現: グラフ上の直観的な標識,タグと接続線を含む,離れて,トレーダーがより容易に認識し,信号を理解できるようにする.
- 適応性が高い: 戦略パラメータは,回帰期,最小振動距離,最小価格変動など,調整可能であり,異なる市場条件と時間枠に応じて戦略を最適化することができます.
- フィルタは騒音を減らす: 最小の振動距離と価格変化の<unk>値を実装することで,この戦略は市場騒音を効果的にフィルターし,意味のある価格構造の変化に焦点を当てます.
- トレンド 背景: 200期EMAを組み込むことで,より広範なトレンドの文脈を提供し,トレーダーが市場全体のトレンドにおける反動シグナルの位置を理解するのに役立ちます.
戦略リスク
- 偽りの背教: フィルターがあっても,特に波動が強い時や市場が整合しているときに,市場が偽の偏差信号を生じることがあります. これは,誤った取引決定と潜在的な損失につながる可能性があります.
- 時間が遅れた: 偏差信号は通常,価格が逆転し始めた後に形成されるため,特に急速な変動の市場では,入場地点が望ましくない可能性があります.
- パラメータ感度策略性能は,回帰期と最小振動距離などのパラメータ設定に大きく依存する.不適切なパラメータは,信号が多すぎたり少すぎたりする可能性がある.
- 指数制限RSIとSRSIは,特定の市場条件,特に長期トレンド市場または極端な変動環境下では,十分な信頼性を欠く可能性があります.
- リスクの抑制の欠如投資の減少のリスクを高めるため,現在実施されている戦略には,明確なストップ・ロスの策略が含まれておらず,
これらのリスクを軽減するために,以下のことをお勧めします.
- 信号を他の技術指標または分析方法,例えばサポート/レジスタンスレベル,<unk>落形状,または取引量分析と組み合わせて使用する
- 異なる市場条件でテストおよび最適化パラメータの設定
- 適切な資金管理と損失防止策を導入する
- 市場全体のトレンドの背景における脱却信号の意味を考慮する
戦略最適化の方向性
- ストップ・アンド・ストップの統合:現在の戦略にはリスク管理機能が欠けている.ATR ((平均リアルレンジ) に基づくダイナミックストップを追加するか,または重要なサポート/レジスタンス位置に基づく固定ストップを追加することで,戦略のリスク・リターン比率を大幅に高めることができます.同様に,価格目標または時間に基づくストップルルルを実施することで,利益をロックすることができます.
- トレンドフィルターを追加策略はEMAを参照として含んでいるが,取引をフィルターするためにそれを使用しない.例えば,価格が200日EMA以上である場合にのみ看板の偏差を考慮するか,または価格が200日EMA以下である場合にのみ看板の偏差を考慮するなどの条件を追加することができます.これは主要なトレンドと一致するのに役立ちます.
- 信号確認メカニズム: 交差量増加,転倒確認形状,または他の運動指標の交差などの追加の確認指標を導入することで,信号の信頼性を向上させることができる.
- 動態参数調整:市場変動に基づく自動調整後退期と<unk>値の振動距離を実現するメカニズム.例えば,高変動の市場でより大きな<unk>値を使用し,低変動の市場でより小さな<unk>値を使用する.
- 強度評価から離れる: 偏差の"強さ"を評価する評価システムを開発し,価格と指標の間の偏差の大きさ,偏差の形成の時間長さ,およびその他の関連要因に基づいて評価する.これは,トレーダーがより強い信号を優先させるのに役立ちます.
- 多時間枠分析: 複数のタイムフレームを統合する確認,例えば,より高いタイムフレームも同じ方向の偏移を示している場合にのみ信号を考慮する.これは偽信号を減らすことができる.
- 価格変動の検出を改善する:現在の戦略は,シンプルな高点/低点検出を使用する.より複雑な価格構造分析を実現する (例えば,複数の波動点を考慮するシーケンス) により,検出の偏差の精度が向上する.
- 市場環境への適応: 市場環境の分類機能を追加する (例えば,傾向,範囲,または高い変動性) と,検出された環境に応じて戦略行動を調整する.
要約する
RSIとランダムなRSI離散取引戦略は,価格と動向指標の間の不一致を識別することで,潜在的市場逆転とトレンド継続のシグナルを捉えるための複雑で強力な技術分析ツールである.この戦略は,常規と隠された離散検出を統合し,精密に設計されたフィルターを適用することで,高確率の取引機会を識別するための包括的な方法を提供します.
しかし,すべての技術分析方法と同様に,この戦略には制限とリスクがあります.リスク管理機構の追加,信号確認の改善,動的パラメータ調整の統合などの推奨の最適化を適用することにより,戦略の安定性と性能を大幅に向上させることができます.
最終的には,この戦略は,他の分析ツールと適切な資金管理の原則と組み合わせたより広範な取引システムの一部として最も適しています.技術分析と市場構造を理解するトレーダーにとって,この策略からの脱却は,高品質の取引設定を見つけるための貴重なツールとなることができます.
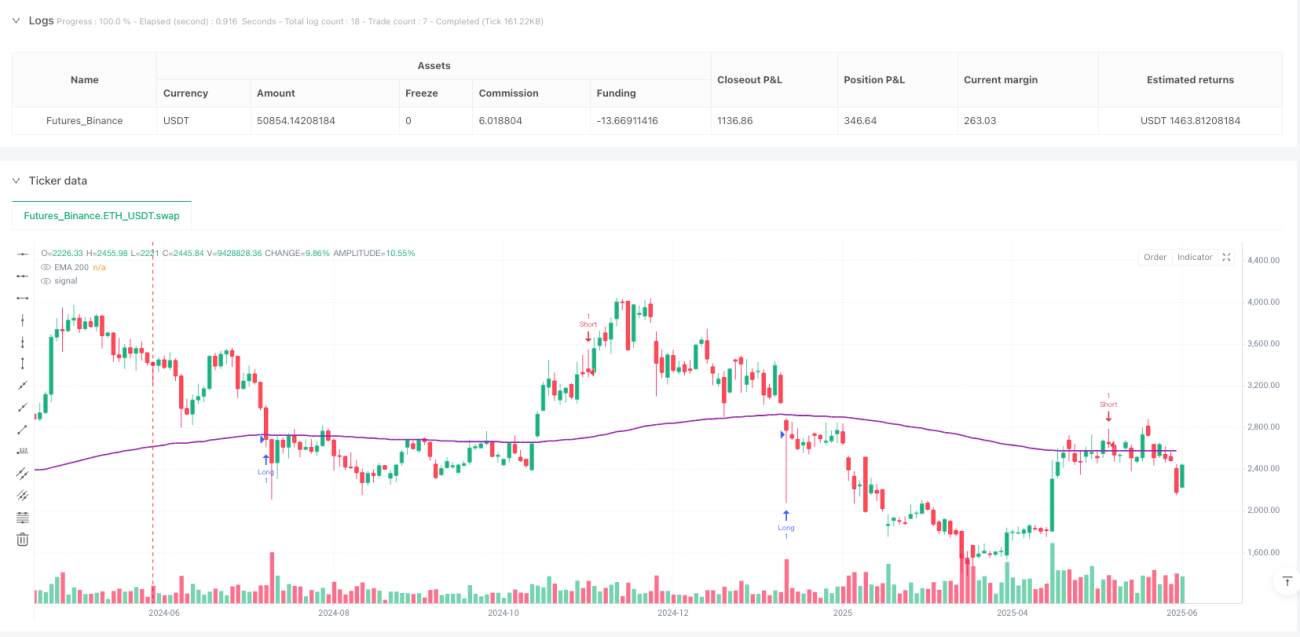
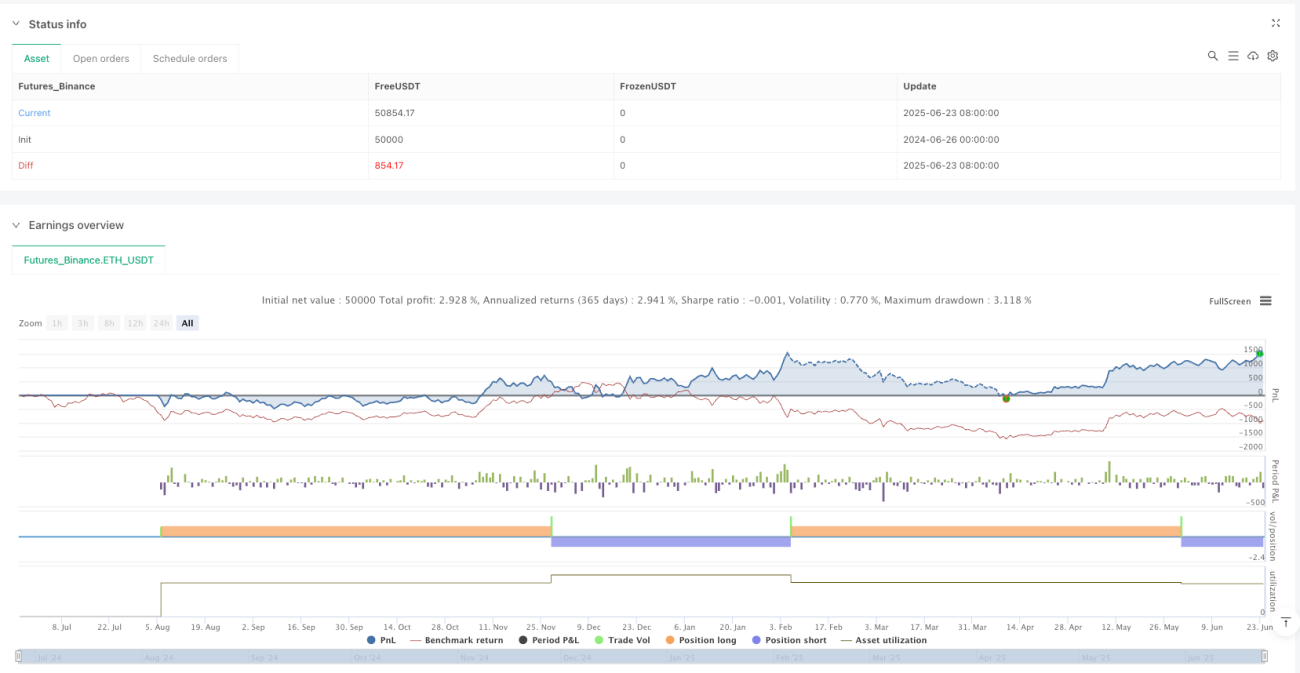
/*backtest
start: 2024-06-26 00:00:00
end: 2025-06-24 08:00:00
period: 2d
basePeriod: 2d
exchanges: [{"eid":"Futures_Binance","currency":"ETH_USDT"}]
*/

//@version=6
strategy("RSI Divergence Strategy", overlay=true)
//strategy("RSI & SRSI Divergence Strategy with EMA & Min Swing Filter + Price Chart Lines", overlay=true)
rsiLength = input.int(14, title="RSI Length")- 1