マルチ期間スーパートレンドEMAモメンタムフィルター戦略

概要
本戦略は、スーパートレンドインジケーターと複数のモメンタムフィルターを組み合わせた高度なトレンドフォローシステムであり、強いトレンドを捉えるために設計されています。その核は、ATR(平均真のレンジ)によって動的に調整されるスーパートレンドインジケーターに、EMA(指数移動平均)とDEMA(二重指数移動平均)をトレンド確認ツールとして組み合わせ、さらにRSI(相対力指数)と出来高フィルターを統合することでエントリーシグナルの信頼性を高めています。本戦略にはATRベースのストップロス、利確、トレーリングストップのメカニズムが組み込まれており、複数の時間枠に対応したプリセットパラメーターが用意され、さまざまなトレーディングスタイルに適応します。特筆すべきは、上昇トレンド中の押し目を捉えるインテリジェントな再エントリーロジックを備え、連続的な上昇相場を捉えられる点です。
戦略の原理
本戦略の核となる原理は、多層のシグナル確認メカニズムに基づいて構築された包括的なトレーディング判断フレームワークです。
-
スーパートレンドコアシグナルシステム:ATRを使用して動的なトレンドバンドを計算し、終値が下限バンドを突破すると買いシグナル(上方転換)、上限を突破すると売りシグナル(下方転換)を生成します。ATR期間と乗数は調整可能で、異なる市場環境のボラティリティに対応します。
-
モメンタム確認フィルター:価格が短期EMA(デフォルト21期間)と長期DEMA(デフォルト200期間)の上にあることを要求し、取引方向が主要トレンドと一致することを保証し、逆張りを回避します。
-
シグナル強度検証:RSI(デフォルトで>50)による価格モメンタムの確認、および出来高がそのEMA(デフォルト20期間)より大きいことによる市場参加度の確認を通じて、エントリーシグナルの品質を高めます。
-
インテリジェント再エントリーメカニズム:確認された上昇トレンドにおいて、価格が調整後にEMAを再び上回り、かつ他の条件を満たした場合、戦略は再度エントリーし、トレンド継続中のチャンスを効果的に捉えます。
-
リスク管理システム:
- ストップロスはエントリー価格の下方1ATR(デフォルト)に設定
- 利確はエントリー価格の上方3ATRに設定(オプション)
- 利益が1ATRを超えるとトレーリングストップが作動し、一部の利益を確保
-
マルチタイムフレームパラメータープリセット:
- "Auto-1H/4H":ATR期間10、乗数3、短期スイングトレード向け
- "Auto-1D":ATR期間14、乗数3、日足トレンドフォロー向け
- "Auto-1W":ATR期間20、乗数4、長期トレンド捕捉向け
戦略の優位性
本戦略は詳細な分析を経ており、以下の顕著な利点を持っています。
-
適応性が高い:スーパートレンドインジケーターはATRに基づいて動的に調整されるため、市場のボラティリティ変化に自動的に適応し、様々な市場環境で有効性を維持します。
-
多層確認による偽シグナルの低減:EMA、DEMA、RSI、出来高による多重検証により、偽りのシグナルのリスクを大幅に低減し、取引品質を向上させます。
-
インテリジェント再エントリーによる継続相場の捕捉:革新的な再エントリーロジックにより、上昇トレンド中の押し目後に再エントリーが可能となり、トレンド中の変動を効果的に活用し、資金効率を高めます。
-
完全なリスク管理体制:ATRベースのストップロス、利確、トレーリングストップメカニズムを内蔵し、単一取引の損失を制限するだけでなく、獲得した利益を効果的に保護し、ドローダウンリスクを低減します。
-
複数時間枠プリセットで操作を簡略化:異なる時間枠向けのプリセットパラメーターにより、戦略を様々な取引サイクルで容易に実装でき、トレーダーの時間的嗜好に適応します。
-
視覚的補助が直感的で明確:色の塗りつぶしで上昇・下降トレンドを区別し、明確な売買シグナルマークと組み合わせることで、市場状態が一目でわかり、取引判断を容易にします。
-
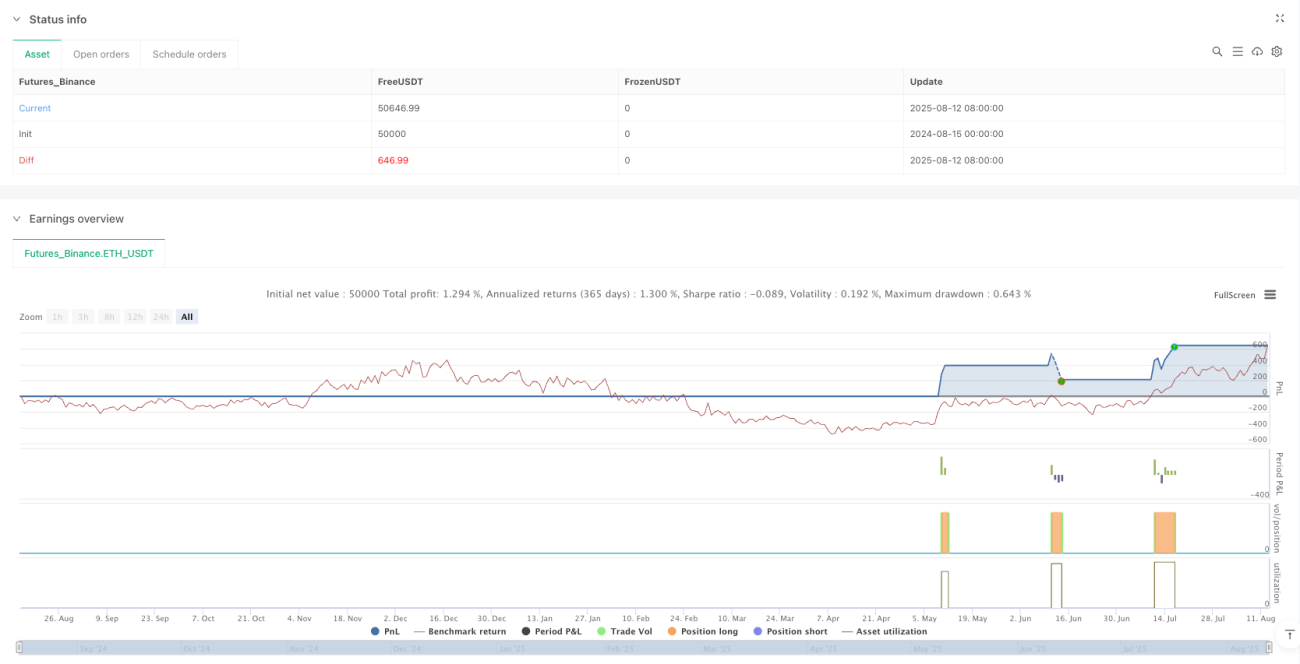
実践的なバックテスト検証済み:日足周期で約60%の勝率と4以上のプロフィットファクターを示し、特にトレンドが明確な市場環境に適しています。
戦略のリスク
本戦略は包括的に設計されていますが、以下の潜在的なリスクが存在します。
-
レンジ相場でのパフォーマンス低下:明確なトレンドがないボックス相場では、ストップロスが頻発し、連続した小幅損失が累積する可能性があります。解決策としては、市場構造が不明瞭な場合は取引を停止するか、ATR乗数を増やしてシグナルの感度を下げることが考えられます。
-
フィルター条件により一部の機会を逃す可能性:多重フィルター条件はシグナル品質を高めますが、初期トレンドの機会を逃す原因にもなり得ます。トレーダーは個人のリスク選好に応じてフィルター条件の厳格さを調整することを検討できます。
-
パラメーター感度:ATR期間と乗数の設定は戦略パフォーマンスに顕著な影響を与え、市場環境によって異なるパラメーターが必要となる場合があります。特定市場向けのパラメーター設定をバックテストで最適化することを推奨します。
-
ドローダウンリスク:全ポジションで取引した場合のバックテストでは、大きなドローダウン(最大100%以上)が発生する可能性があります。厳格な資金管理を徹底し、1回の取引リスクを1~2%以内に抑える必要があります。
-
過去データの限界:戦略は主に特定の市場と期間でバックテストされており、オーバーフィッティングのリスクがあります。実際の取引に適用する前に、より広範な市場と期間でのテストを行うべきです。
-
極端な市場条件下でのテスト不足:戦略は市場の急激な変動や流動性危機などの極端な状況でテストされていない可能性があり、そのような状況でのパフォーマンスは未知です。
最適化の方向性
コードの詳細分析を通じて、本戦略は以下の方向で最適化が可能です。
-
適応的パラメーター調整:市場のボラティリティに基づいてATR乗数と期間を動的に調整するメカニズムを開発し、戦略が市場状態の変化に自動的に適応できるようにします。例えば、ボラティリティが上昇した場合はATR乗数を増やし、低下した場合は減らします。
-
市場状態分類の統合:市場状態認識モジュール(ボリンジャーバンド幅やADXなど)を導入し、市場がトレンド相場かレンジ相場かに応じて戦略パラメーターを自動調整したり、取引を一時停止したりします。
-
マルチタイムフレーム分析フレームワーク:マルチタイムフレーム分析機能を追加し、より上位の時間枠のトレンドが現在の時間枠と一致する場合のみ取引を実行することで、トレンド判断の精度を高めます。
-
再エントリーロジックの最適化:再エントリー条件を精緻化し、フィボナッチリトレースメントレベルや重要なサポートラインの確認を追加することで、再エントリーポイントの精度を向上させます。
-
資金管理の最適化:市場のボラティリティ、口座純資産、連続損益状況に基づいてポジションサイズを動的に調整する機能を実装し、資金曲線のパフォーマンスを最適化します。
-
市場センチメント指標の追加:VIX指数(ボラティリティ指数)や出来高変化率などの市場センチメント指標を統合し、市場がパニックや過度な楽観を示した場合に戦略の振る舞いを調整します。
-
機械学習による最適化:機械学習アルゴリズムを活用してパラメーター選択とエントリータイミングを最適化し、過去データから最適な取引パラメーターの組み合わせを予測するモデルをトレーニングします。
まとめ
マルチタイムフレームスーパートレンドEMAモメンタムフィルター戦略は、スーパートレンドインジケーターと複数のモメンタムフィルターを組み合わせた包括的な取引判断フレームワークを構築した、よく設計されたトレンドフォローシステムです。その中核的な強みは、高い適応性、多層確認による偽シグナルの低減、インテリジェント再エントリーによる継続相場の捕捉、そして完全なリスク管理体制にあります。本戦略は特にトレンドが明確な市場環境に適しており、日足周期で良好なバックテスト結果を示しています。
しかし、本戦略はレンジ相場ではパフォーマンスが低下する可能性があり、パラメーター感度や潜在的なドローダウンリスクも存在します。戦略のロバスト性をさらに高めるには、適応的パラメーター調整の開発、市場状態分類の統合、マルチタイムフレーム分析フレームワークの構築、再エントリーロジックの最適化、資金管理方法の改善、市場センチメント指標の追加、機械学習技術の適用などが考えられます。
最終的に、本戦略はテクニカル指標が厳格でリスク管理が整ったトレンドフォロー取引のフレームワークを提供しますが、使用する際は常にリスク管理の重要性を念頭に置き、1回の取引リスクを受容可能な範囲に制限し、個人の取引スタイルや市場環境に応じて戦略パラメーターを適宜調整する必要があります。
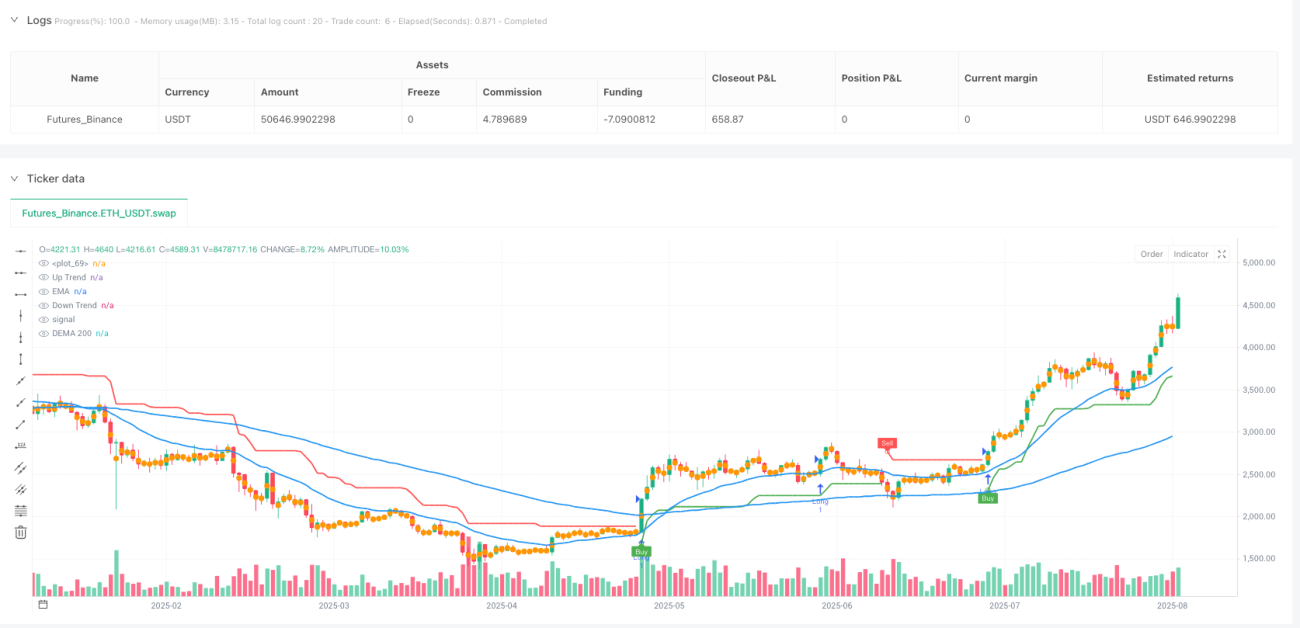
/*backtest
start: 2024-08-15 00:00:00
end: 2025-08-13 08:00:00
period: 1d
basePeriod: 1d
exchanges: [{"eid":"Futures_Binance","currency":"ETH_USDT"}]
*/

//@version=5
strategy("Supertrend EMA Strategy _V29", overlay=true, format=format.price, precision=2, initial_capital=1000)
// Inputs
tf_preset = input.string("Manual", title="Timeframe Preset", options=["Manual", "Auto-1H/4H", "Auto-1D", "Auto-1W"])- 1