自動トレンドラインチャネルブレイクアウト定量取引戦略

概要
自動トレンドラインチャネルブレイクアウト量子化取引戦略は、価格チャネルブレイクアウトの原理に基づいた自動化取引システムです。本戦略は、市場の高値と安値を動的に識別して価格チャネルを構築し、価格がチャネル境界を突破した際に取引シグナルを生成します。戦略の中核は、過去の価格変動を利用してサポートとレジスタンスの水準を特定し、適切な利確・損切り比率を設定することでリスクを管理することです。本戦略は特にボラティリティが高い市場に適しており、トレンド性のブレイクアウト相場を捉えて収益を獲得します。
戦略の原理
本戦略の核心は価格チャネルブレイクアウト理論に基づいており、具体的な実装ロジックは以下の通りです:
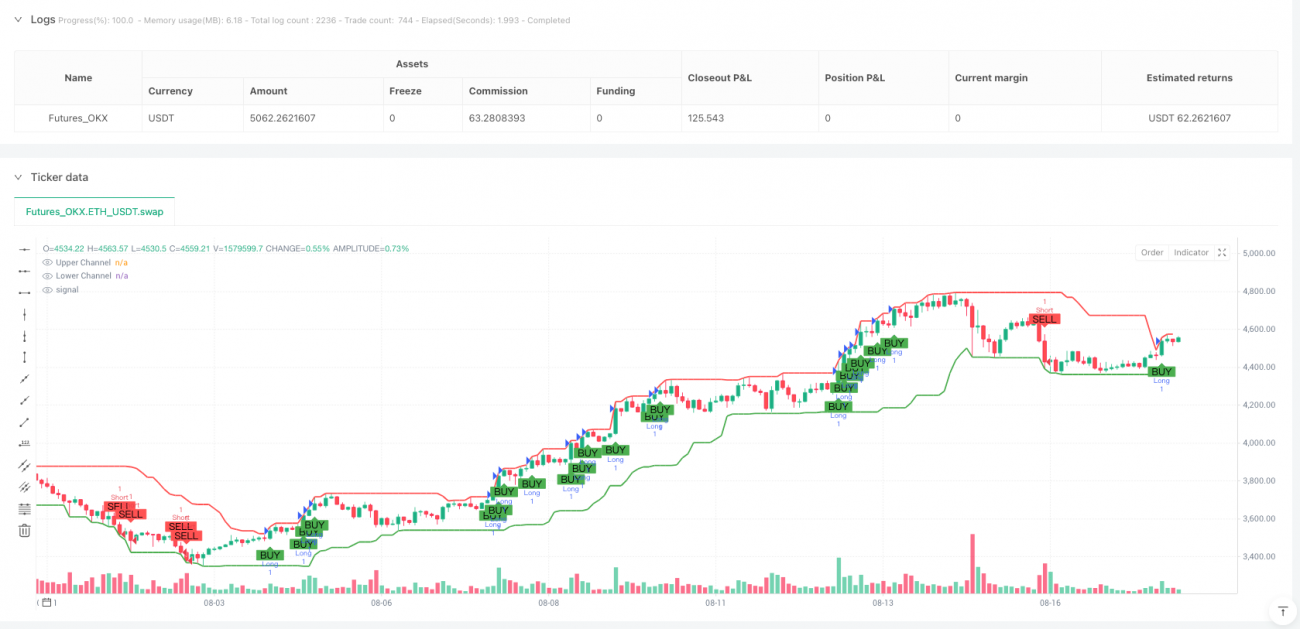
- 指定された期間(デフォルト20本のローソク足)を遡り、市場の高値(HH)と安値(LL)を識別します。これらの価格水準がトレンドチャネルの基盤となります。
- 高値と安値を基に、一定割合のチャネル幅(デフォルト0.5%)を外部に拡大して、上下のチャネル線を形成します。上チャネル線はレジスタンス、下チャネル線はサポートとなります。
- 取引シグナルの生成ルール:
- 終値が上チャネル線を突破した場合、買いシグナルが発生
- 終値が下チャネル線を下回った場合、売りシグナルが発生
- 戦略は動的な利確・損切りメカニズムを採用:
- 買いの場合、利確はエントリー価格の上方0.5%、損切りはエントリー価格の下方0.3%に設定
- 売りの場合、利確はエントリー価格の下方0.5%、損切りはエントリー価格の上方0.3%に設定
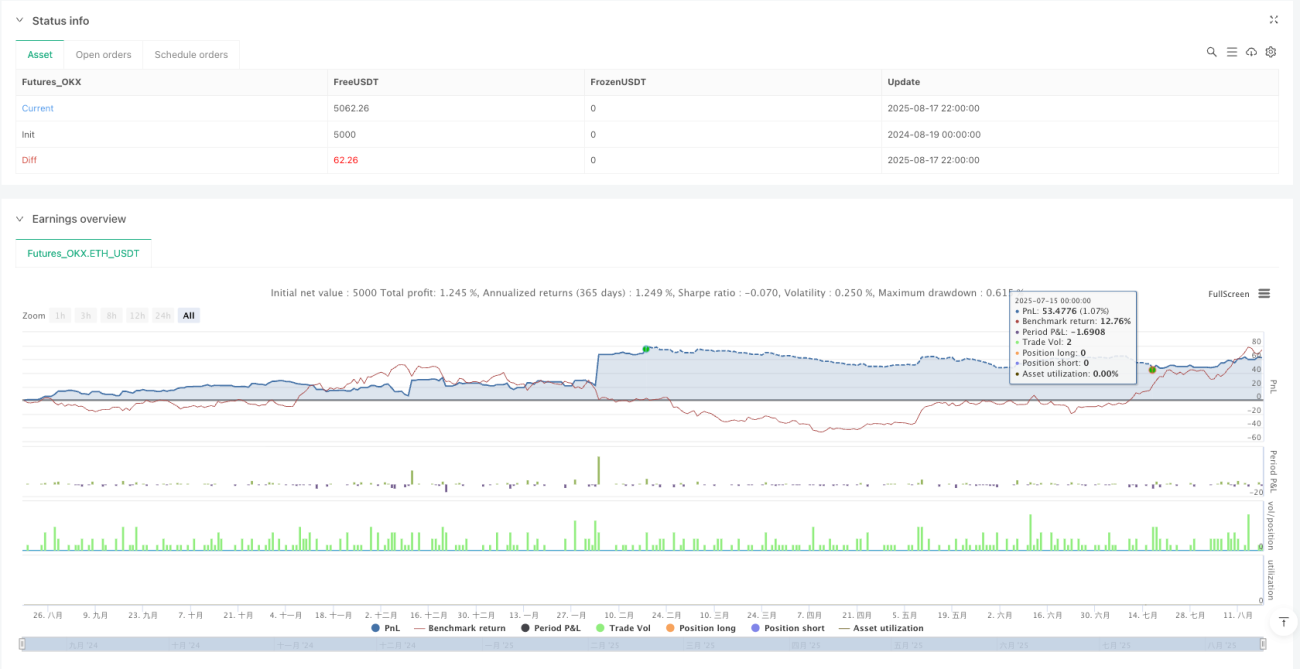
- 資金管理は口座純資産のパーセンテージ方式を採用し、デフォルトでは取引ごとに口座資金の10%を使用し、一回の取引リスクが過大にならないようにします。
戦略の本質は、価格が過去の変動レンジを突破する瞬間を捉えることであり、市場の慣性原理に基づき、価格がいったん所定のレンジを突破すると、その突破方向に沿って進み続ける傾向があります。
戦略の優位性
- 市場変化への適応力:高値と安値を動的に計算することで、チャネルが異なる市場環境に自動的に適応し、パラメータを手動で調整する必要がありません。
- 明確な取引シグナル:売買シグナルが明確で、主観的な判断要素を減らし、システム化された実行に適しています。
- 内蔵されたリスク管理:利確・損切りメカニズムが組み込まれており、各取引に事前に設定されたリスクリワード比があり、一回の取引リスクを効果的に制御します。
- 合理的な資金管理:口座のパーセンテージ方式でポジションを管理し、口座規模の変化に応じて取引量が自動調整され、過剰取引を防ぎます。
- 可視化された取引シグナル:チャート上に売買シグナルとチャネル線を表示し、取引ロジックを直感的に示すため、トレーダーが理解・監視しやすくなります。
- アラート機能:取引シグナルアラート機能が組み込まれており、重要なタイミングでトレーダーに通知するため、常時チャート監視が不要です。
- パラメータ調整可能性:遡り期間、チャネル幅、利確・損切り比率など主要パラメータはカスタマイズ可能で、異なる市場環境に合わせて最適化できます。
戦略のリスク
- 偽ブレイクアウトのリスク:市場が一時的にブレイクした後に戻る可能性があり、偽シグナルが取引を誘発し、その後価格が元のレンジに戻ることで不必要な損失が発生します。解決策:連続する2本のローソク足の終値がともにチャネル線を突破した場合のみ取引をトリガーするなど、確認メカニズムを追加することを検討します。
- レンジ相場には不向き:横ばいのレンジ相場では、価格が頻繁にチャネル境界に触れるが有効なトレンドが形成されず、頻繁な取引と高い損切りトリガー率が発生します。解決策:ボラティリティ指標などの市場状態フィルターを追加し、市場のボラティリティが一定レベルに達した場合のみ取引を許可します。
- 固定比率の利確・損切りの柔軟性不足:市場環境によって最適な利確・損切り比率は異なり、固定比率では一部の市場環境で利確が早すぎたり、損切りが遅すぎたりする可能性があります。解決策:ボラティリティに基づいて利確・損切り比率を動的に調整することを検討します。
- トレンドフィルターの欠如:大きなトレンド方向を区別していないため、メイントレンドが下降中に買いシグナルが発生する可能性があり、その逆もあり得ます。解決策:長期移動平均線をトレンドフィルターとして追加し、トレンド方向が一致した場合のみ取引を行います。
- パラメータ敏感性:戦略のパフォーマンスは遡り期間やチャネル幅などのパラメータに敏感であり、パラメータ選択が不適切だと戦略のパフォーマンスが低下する可能性があります。解決策:十分なパラメータ最適化とバックテストを実施し、対象市場に最適なパラメータ組み合わせを見つけます。
戦略の最適化方向性
- トレンドフィルターの追加:長期移動平均線やその他のトレンド指標を追加し、大きなトレンド方向とシグナル方向が一致した場合のみ取引を実行します。これにより逆張り取引のリスクを大幅に低減し、全体の勝率を向上させます。具体的には、50日または200日移動平均線をトレンド判断の基準として追加することを検討します。
- シグナル確認メカニズムの最適化:ブレイクアウト確認ロジックを追加し、価格がチャネルを突破した後、連続して2本以上のローソク足がチャネル外側に留まった場合にのみ取引をトリガーします。これにより偽ブレイクアウトによる損失を効果的に減らせます。
- ボラティリティに基づくパラメータの動的調整:チャネル幅と利確・損切り比率を市場のボラティリティに連動させ、高ボラティリティ環境ではより広いチャネルと大きな利確・損切り比率を使用し、低ボラティリティ環境ではその逆とします。これにより様々な市場環境にうまく適応できます。
- 時間フィルターの追加:取引時間に制限を設け、重要な経済指標の発表時間や流動性の低い時間帯を避け、異常な変動によるリスクを低減します。
- 出来高確認の追加:出来高分析を組み合わせ、出来高が増加した場合のみブレイクアウトシグナルを確認し、ブレイクアウトの有効性を高めます。
- 機械学習の導入による最適化:機械学習アルゴリズムを使用して最適なパラメータ組み合わせを動的に予測し、最近の市場特性に応じて戦略パラメータを自動調整し、より賢い取引判断を実現します。
- マルチタイムフレーム分析:複数の時間足のシグナルを統合し、複数時間足のシグナルが一致した場合のみ取引を実行して、シグナルの質を高めます。
以上の最適化方向性は、戦略の堅牢性と適応性を向上させ、偽シグナルを減少させトレンド捕捉能力を強化することで、様々な市場環境で安定したパフォーマンスを維持することを目的としています。
まとめ
自動トレンドラインチャネルブレイクアウト量子化取引戦略は、テクニカル分析の原理に基づいたシステム化取引手法であり、価格チャネルブレイクアウトを識別して市場トレンドの変化を捉えます。本戦略の主な強みは、適応性が高く、シグナルが明確で、リスク管理が充実していることであり、中長期のトレンド取引に適しています。しかし、偽ブレイクアウトのリスクやレンジ相場でのパフォーマンス低下などの課題もあります。
トレンドフィルターの追加、シグナル確認メカニズムの最適化、ボラティリティに応じたパラメータの動的調整などを導入することで、戦略の堅牢性と収益性を大幅に向上させることができます。将来的には機械学習技術を組み合わせて、パラメータ選択とシグナル品質をさらに最適化することも検討できます。
トレーダーにとって、本戦略はシステム化され規律ある取引フレームワークを提供し、感情的要因の影響を低減するため、中長期トレンド捕捉ツールとして適しています。ただし、実運用前に十分なパラメータ最適化とバックテスト検証を実施し、個人のリスク選好に応じて資金管理設定を調整することを推奨します。
- 1