
🚀 この戦略はどれほどすごいのか?
ご存知ですか?この戦略は、あなたのトレードに「火眼金睛(火の目・金の瞳)」を装着するようなものです!1分足と5分足の超短期トレードに特化して設計されており、最も強力な5つのテクニカル指標(ファスト&スローEMA、RSI、MACD、ボリンジャーバンド、出来高フィルター)を組み合わせています。簡単に言えば、市場の小さな変動のたびに正確にチャンスを捉えることができるのです!
💡 ポイント!このコンビネーション攻撃の使い方
想像してみてください。この戦略は、まるで超厳しい「面接官」のようなものです。複数の条件を同時に満たすトレード機会だけが選別を通過できます。
買いシグナルの条件:価格がファストEMAより上にある、MACDがゴールデンクロスかつ正の値、ボリンジャーバンドの上部バンドを突破、RSIが50~80の範囲内、さらに十分な出来高の裏付けが必要です。これはまるで「見た目も良く、才能もあり、性格も良い」という厳しい条件を同時に求めるようなものです!
売りシグナルはその逆:すべての条件が反対方向で満たされる必要があり、各トレードが十分なテクニカル的裏付けを持つことを保証します。
⚡ 避けるべき落とし穴:なぜ超短期トレードを選ぶのか?
この戦略の最も賢い点は、そのリスク管理にあります!ストップロスは0.5%、テイクプロフィットは1.0%に設定され、リスクリワード比は1:2です。「小遣い程度の遊びで気分良く」を完璧に体現しており、毎回の損失は小さいですが、利益は倍になります!
さらに、親切な設計があります。1分足チャートでは自動的にローソク足パターン認識が無効になります。超短期のローソク足ではノイズが多すぎて判断を誤りやすいからです。これは、騒がしい環境で自動的にノイズを低減するかのようにスマートです!
🎯 実戦応用:この戦略はどんな問題を解決できるのか?
適した人:暗号通貨市場でデイトレードを行いたい方、特に小さいながらも頻繁なトレードで利益を積み重ねたいトレーダー向けです。
解決する悩み:単一指標による誤ったシグナルの悩みから解放されます!多重確認メカニズムにより、シグナルの信頼性が大幅に向上します。同時に、厳格なリスク管理により、たとえ判断を誤っても損失は管理可能な範囲に抑えられます。
覚えておいてください。この戦略は精密なメスのようなもので、流動性の高い暗号通貨ペアで最も効果を発揮します。適切な資金管理と組み合わせることで、トレード武器庫の頼もしい助っ人となるでしょう!
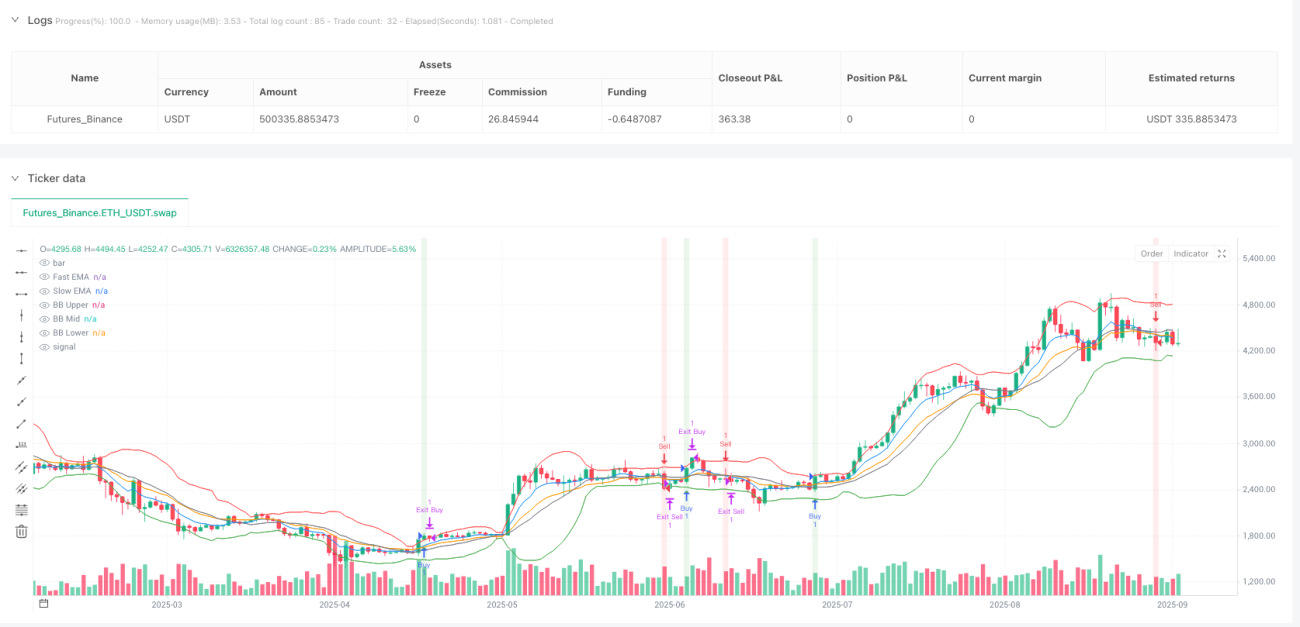
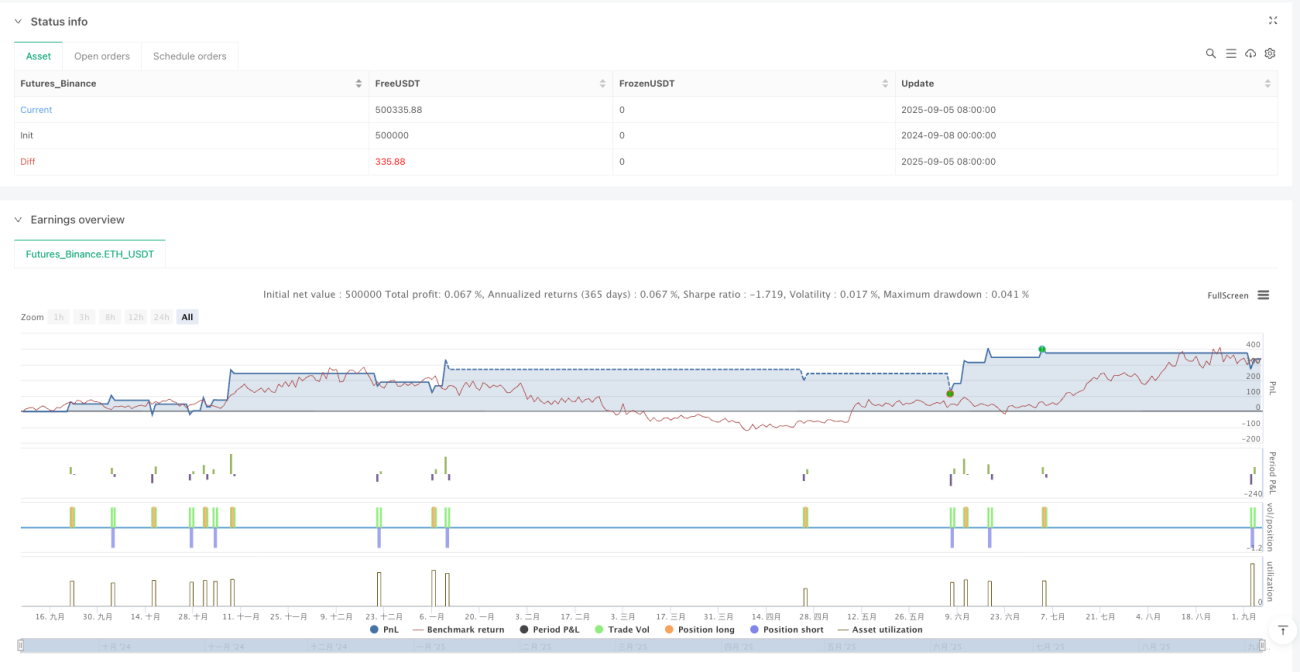
/*backtest
start: 2024-09-08 00:00:00
end: 2025-09-06 08:00:00
period: 1d
basePeriod: 1d
exchanges: [{"eid":"Futures_Binance","currency":"ETH_USDT","balance":500000}]
*/

//@version=5
strategy("Advanced Crypto Scalping Strategy - 1 & 5 Min Charts", overlay=true, margin_long=100, margin_short=100)

// Inputs for customization (optimized for 1-min and 5-min timeframes)- 1