ビットコイン半減期サイクル戦略

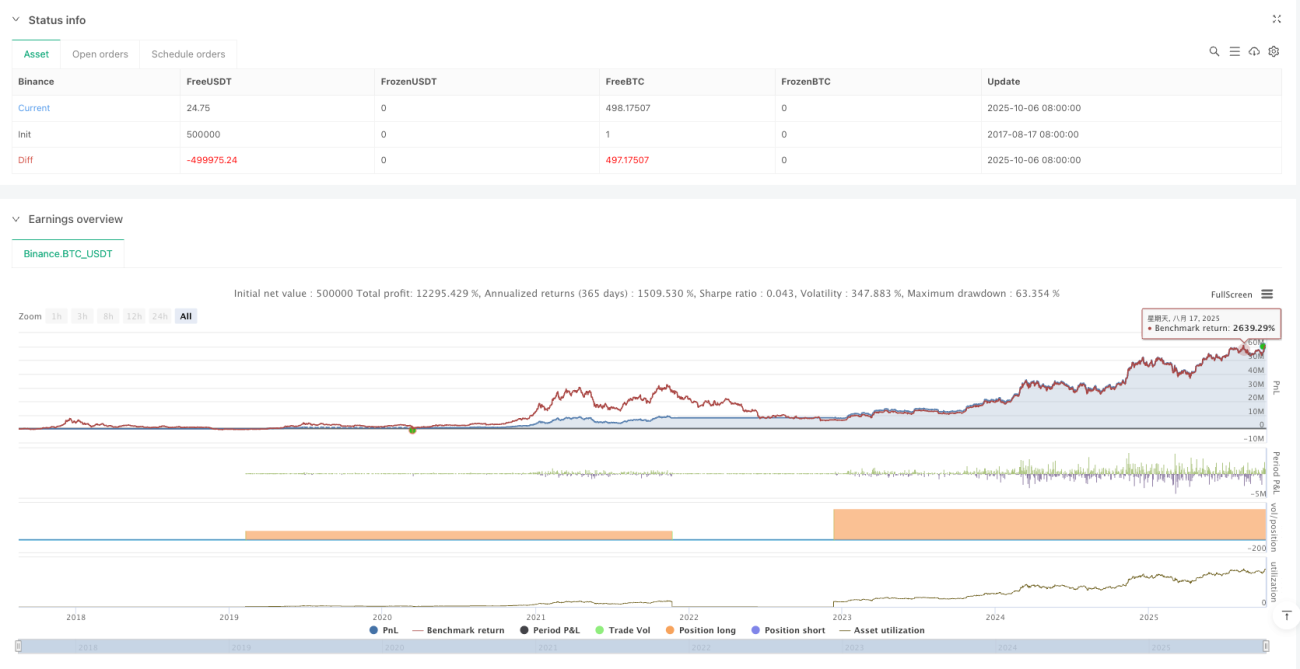
半減期サイクル戦略:過去データは平均リターン1000%超を示す
これはまた別のテクニカル分析戦略ではなく、ビットコインの4年ごとの半減期サイクルに基づいた長期投資フレームワークです。バックテストデータによると、半減期のタイミングを厳密に守って売買を行った場合、単一サイクルで最大2000%以上のリターンを達成可能です。ただし、すぐに興奮しないでください。この戦略には極めて強い実行力とリスク許容度が必要です。
中核ロジックはシンプルで大胆です:半減期時に購入し、40〜80週後に分割して利益確定、135週後に再度ポジションを構築します。聞くのは簡単ですが、実行するには鋼の意志が必要です。
3段階の運用フレームワーク:従来のドルコスト平均法より正確なタイミング選択
フェーズ1:半減期購入期(0〜40週)
半減期イベント発生直後にポジションを構築。これが戦略全体の核となるエントリーポイントです。過去データでは、半減期後の40週間が最適な蓄積期であり、この時期は市場心理がまだ供給減少の影響を完全に織り込んでいないことが一般的です。
フェーズ2:利益確定期(40〜80週)
半減期後40〜80週は、歴史的にビットコイン価格が爆発的に上昇するゴールデンウィンドウです。2016年の半減期後78週でビットコインは3000%以上上昇し、2020年の半減期後も同様の動きが見られました。この時間枠は推測ではなく、需給ファンダメンタルズに基づく数学的導出です。
フェーズ3:弱気相場でのポジション構築期(135週以降)
半減期後135週以降は通常、深い弱気相場に突入するため、この時点でDCA戦略を開始します。このタイミング選択は、強気相場の高値での無駄な投資を避けられるため、盲目的なドルコスト平均法より優れています。
リスク管理:絶対に勝てる戦略ではないため、厳格な規律が必要
最大のリスク:実行力不足
戦略の最大の敵は市場変動ではなく、人間の心理です。半減期での購入は市場が悲観的な時に逆行する行動が必要であり、利益確定は熱狂の中で冷静さを保つ必要があります。歴史的に90%の人は完全に実行できていません。
資金管理の要件
単一サイクルで80%以上のドローダウンに直面する可能性があるため、1回の投入は総資産の20%を超えないように推奨します。2018年の弱気相場では2万ドルから3200ドルまで下落し、たとえ「正しい」タイミングで購入しても大きな含み損に耐える必要がありました。
市場環境変化のリスク
戦略は過去3つの完全なサイクルデータに基づいていますが、ビットコイン市場は成熟化しつつあります。機関投資家の資金流入やETF承認などの要因が従来のサイクルパターンを変える可能性があります。過去の実績は将来のリターンを保証するものではありません。これは単なる決まり文句ではありません。
パラメータ設定:主観的判断ではなく数学モデルに基づく
40週の利益確定開始点:過去の半減期後の需給均衡点に基づいて計算。早すぎる利益確定はメインの上昇局面を逃す可能性があり、遅すぎると高値で掴むリスクがあります。
80週の利益確定終了点:過去データでは半減期後80週が価格天井の高確率ゾーンであり、この時点で分割してポジションを減らし始める必要があります。最後の上昇幅に執着しないでください。
135週のDCA開始点:弱気相場の底値エリアにおける統計的最適解であり、この時点でドルコスト平均法を開始するリスクリターン比が最も優れています。
実戦アドバイス:長期投資家向け、短期トレーダーには不向き
この戦略は5年以上の投資期間を想定した資金に適しており、急な資金が必要な投資家やリスク許容度が低い投資家には向いていません。単一サイクルで2〜3年の含み損期間に耐える必要があり、心理的負担は非常に大きいです。
戦略の勝率は短期的な価格予測ではなく、長期的な需給サイクルを捉えることにあります。ビットコインの半減期は確定的なイベントですが、価格反応の時期と規模には依然として不確実性が伴います。
重要な注意事項:これは高リスクの投資戦略であり、元本全額を失う可能性があります。過去のバックテストデータは将来のリターンを保証するものではありません。投資前にご自身のリスク許容度を十分に評価してください。
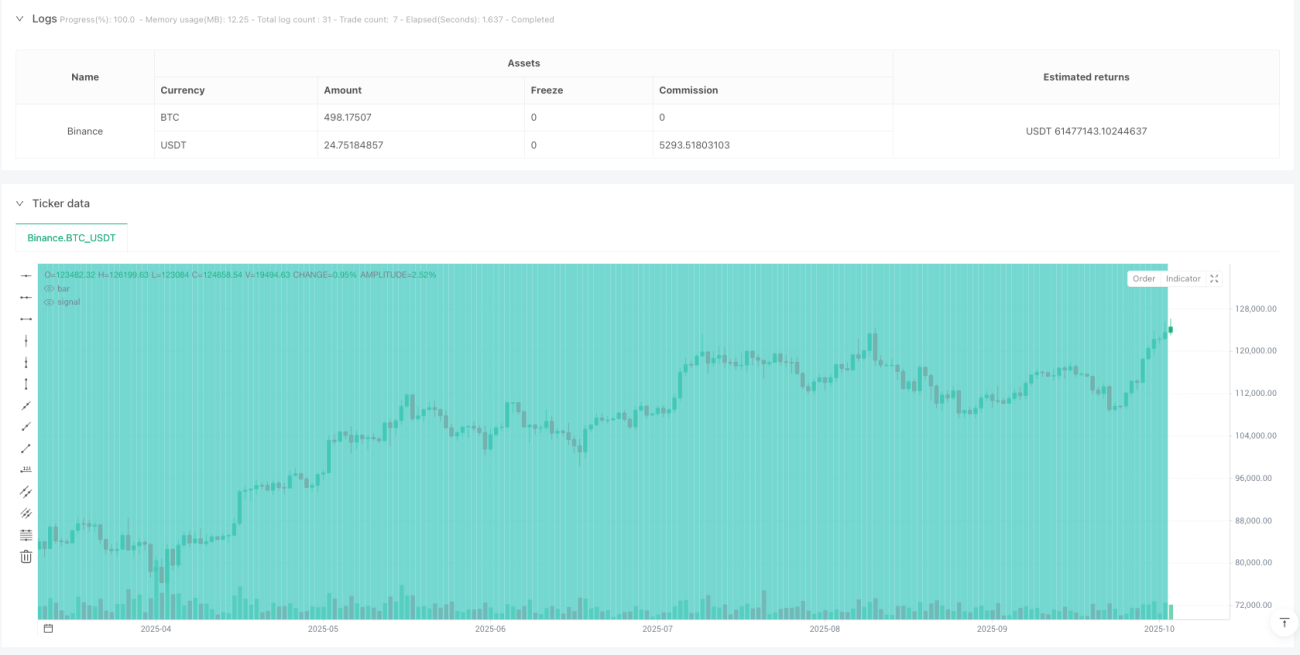
/*backtest
start: 2017-08-17 08:00:00
end: 2025-10-07 08:00:00
period: 1d
basePeriod: 1d
exchanges: [{"eid":"Binance","currency":"BTC_USDT","balance":500000}]
*/

//@version=6
strategy(title='Bitcoin Halving Cycle Profit - Backtesting', shorttitle='BTC Halv', overlay=true, default_qty_type=strategy.percent_of_equity, default_qty_value=100, initial_capital=10000, commission_type=strategy.commission.percent, commission_value=0.1)

// ════════════════════════════════════════════════════════════════════════════════════════════════- 1