バイポーラ・スムーズ・オシレーター戦略

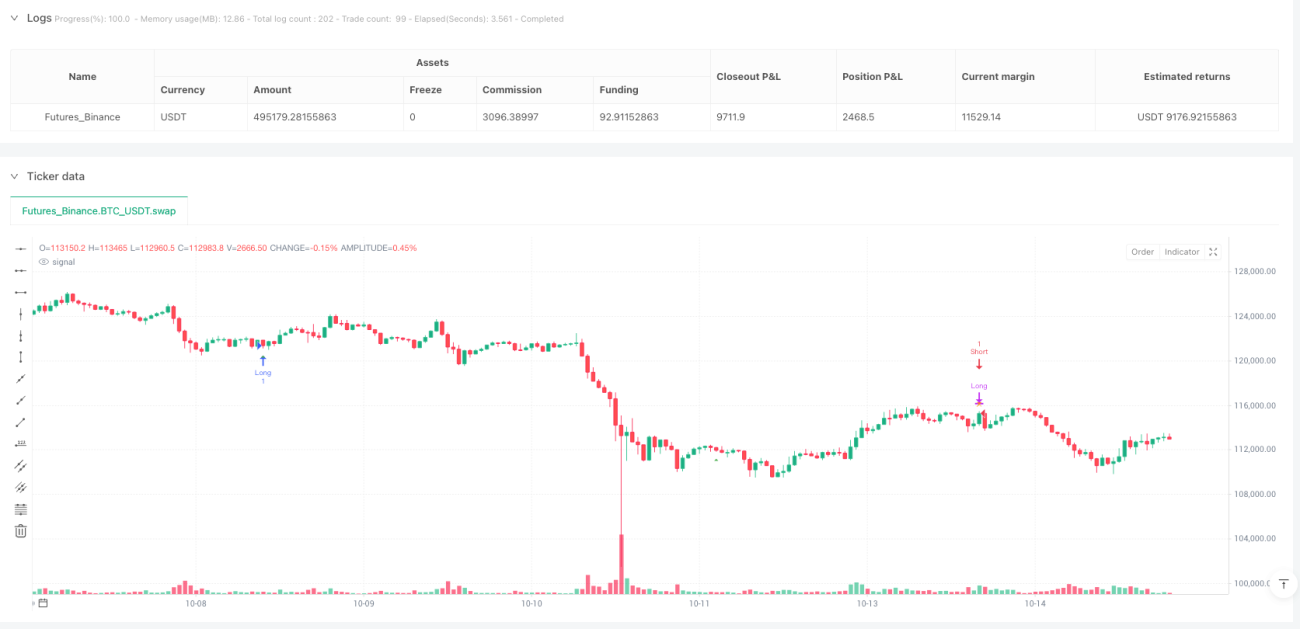
🎯 これはどんな神戦略?
ご存知ですか?この戦略はまるで市場に「感情探知機」を取り付けたようなものです!📡 バイポーラスムースオシレーターを通じて市場の「喜怒哀楽」を感知し、市場が過度に興奮(買われすぎ)したり、過度に落ち込んだ(売られすぎ)ときに取引シグナルを発します。ポイント!これは普通のオシレーターではなく、「二重美顔」処理を施したハイレベルバージョンで、市場ノイズを効果的に除去し、本当のトレンド方向を見極めることができます。
💡 動作原理の大公開
想像してみてください。この戦略はまるで超敏感な「市場体温計」のようです🌡️。まず、価格が25期間移動平均線からどれだけ乖離しているかを計算し、標準化処理を行います(まるで異なる身長の人を標準身長比率に換算するようなもの)。次に、肝心の「二重スムージング」プロセスがあり、写真に2回連続で美顔フィルターをかけるように、シグナルをよりクリアで信頼性の高いものにします。オシレーターが設定したしきい値を突破すると、戦略は断固として行動を起こします!
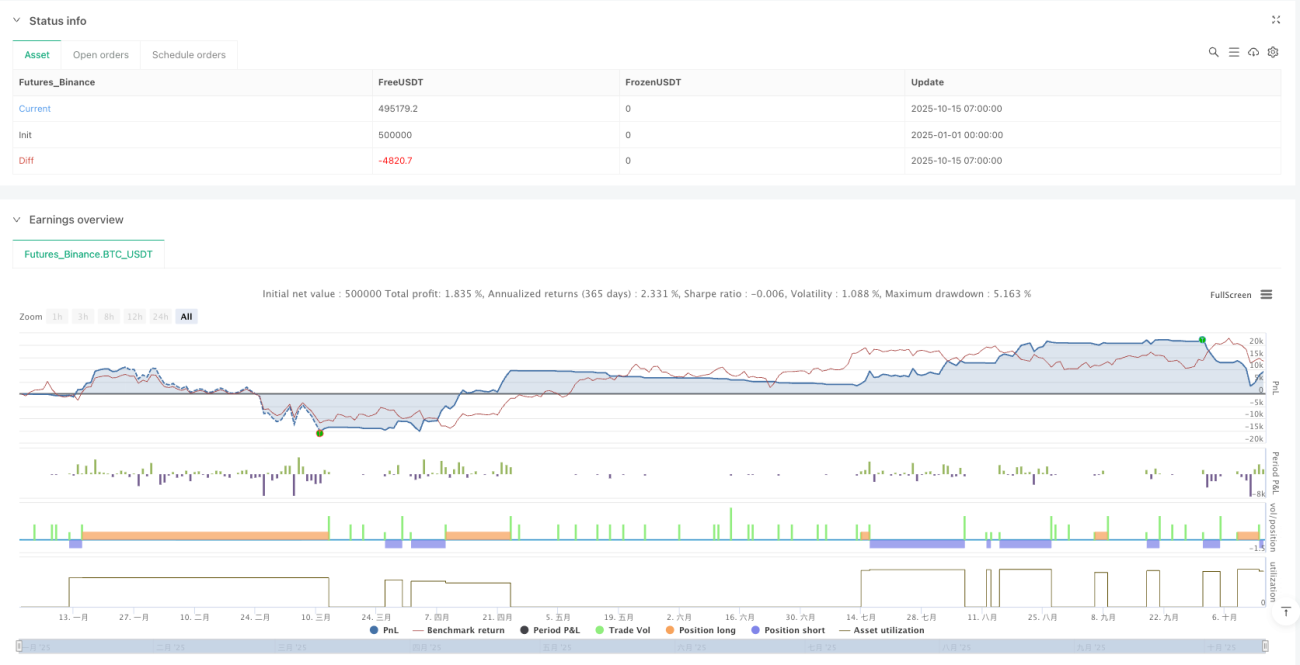
⚡ この戦略のスーパーパワー
失敗回避ガイドです!この戦略の最も優れている点は「逆シグナルでの手仕舞い」メカニズムです。まるで運転中に赤信号を見たら即座にブレーキを踏むような賢さです!🚦 逆のシグナルが出現すると、即座にポジションを閉じ、無理に耐え続けることはありません。同時に5期間固定ストップロスが備わっており、資金に「エアバッグ」を追加したようなものです。最も心強いのは、完全な取引統計機能が内蔵されており、いつでも戦略のパフォーマンスを把握できることです!
🚨 リスク注意は欠かせません
ポイント!この戦略は優秀ですが、万能ではありません。強いトレンド相場では、オシレーターが「迷子」になる可能性があります。まるで高速道路で市街地用のナビを使うのと同じで、適切ではありません。固定しきい値の設定は、異なる市場環境ではうまく適合しない可能性があり、実際の状況に応じて柔軟に調整する必要があります。どんな戦略も適切なリスク管理と組み合わせる必要があり、すべての卵を一つのカゴに盛ってはいけません!
- 1