ゴールド流動性ハンター戦略

🎯 この戦略は一体何をしているのか?
ご存知ですか? 市場には「賢いお金」と呼ばれる集団がいて、彼らは常に重要なポジションに罠を仕掛けるのが大好きです! この戦略は、まるで経験豊富なハンターのように、そうした罠を見抜いて逆の行動を取ります。簡単に言うと、価格が意図的に重要なサポート・レジスタンスラインを「偽のブレイク」した後、急速に戻ってきた時に、大口資金のリズムに乗ってエントリーするのです!
📊 三重のフィルタリングシステムの秘密
重要ポイント! この戦略は三重の防御網を採用しています:
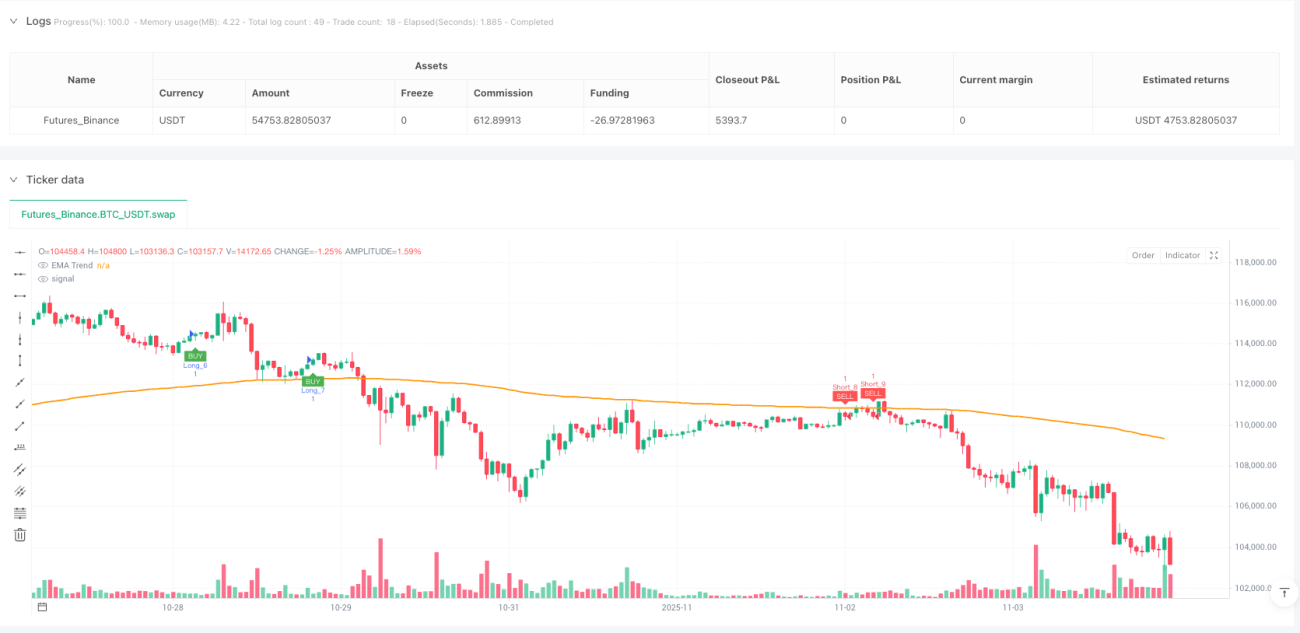
🔸 トレンドフィルター:200期間EMAがまるでベテランドライバーのように、現在が上り坂か下り坂かを教えてくれます
🔸 重要ポイントの識別:「兵家必争の地」であるサポート・レジスタンスラインを自動的に見つけ出します
🔸 流動性スイープ検出:大口資金が仕掛ける「フェイクムーブ」を捉えます
まるで釣りのように、魚がどこにいるか、どんな餌を使うか、いつ竿を上げるかを知る必要があります!
🎪 流動性スイープの不思議な魅力
想像してみてください:あなたがタピオカミルクティーを買うために列に並んでいると、突然誰かが「無料配布!」と叫びます。みんながそれに殺到しますが、それは偽物だとわかります。しかし、賢い人たちはその混乱に乗じて前に割り込んでいます。
市場も同じです! 価格がまず「偽装」してサポートラインを割り込み(ストップロス注文をスイープ)、その後急速に戻ってきます。その時が最も理想的なエントリーポイントです。この戦略は0.6倍ATRのバッファを設定し、本当に「スイープ」であって本物のブレイクではないことを確認します。
⚡ リスク管理:1:2の黄金比
注意点ガイド:多くのトレーダーはシートベルトを締めずに運転するような取引をしていますが、この戦略は1:2のリスクリワード比を強制します!
- ストップロスは重要ポイントの0.5倍ATR下に設定
- 利確はストップロスの2倍の距離
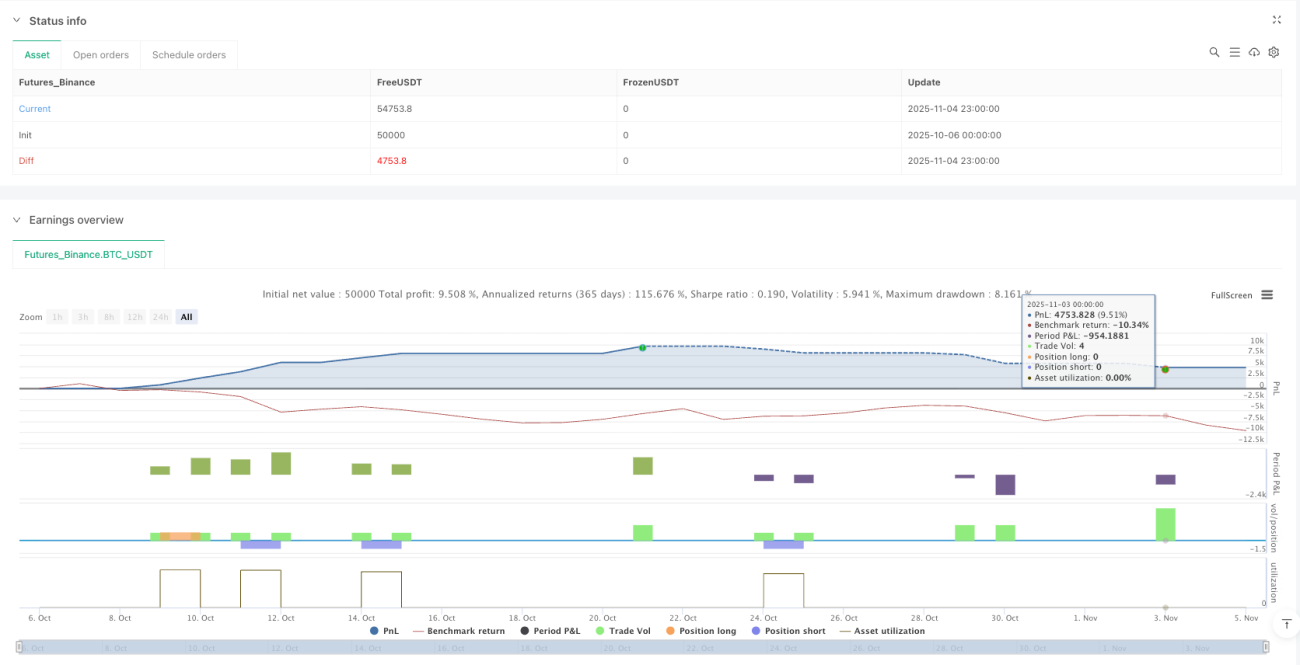
- 勝率が40%でも、長期的に利益を出せます!
🚀 実戦応用のコツ
この戦略は15分足のゴールド取引に最適です。なぜなら、ゴールド市場は流動性が高く、フェイクブレイク現象が顕著で、15分足はノイズを適度にフィルタリングできるからです。
覚えておいてください:欲張ってはいけません! 戦略が良いポジションを見つけてくれたら、後は市場と時間に任せましょう~
/*backtest
start: 2025-10-06 00:00:00
end: 2025-11-05 00:00:00
period: 1h
basePeriod: 1h
exchanges: [{"eid":"Futures_Binance","currency":"BTC_USDT"}]
*/

//@version=6
strategy("Gold 15m: Trend + S/R + Liquidity Sweep (RR 1:2)", overlay=true, default_qty_type=strategy.fixed, default_qty_value=1, commission_type=strategy.commission.percent, commission_value=0.0)

// ---------------------- INPUTS ----------------------- 1