野馬モメンタムレンジ戦略

これは別のMACD変種ではない、トレンド区間の再定義である
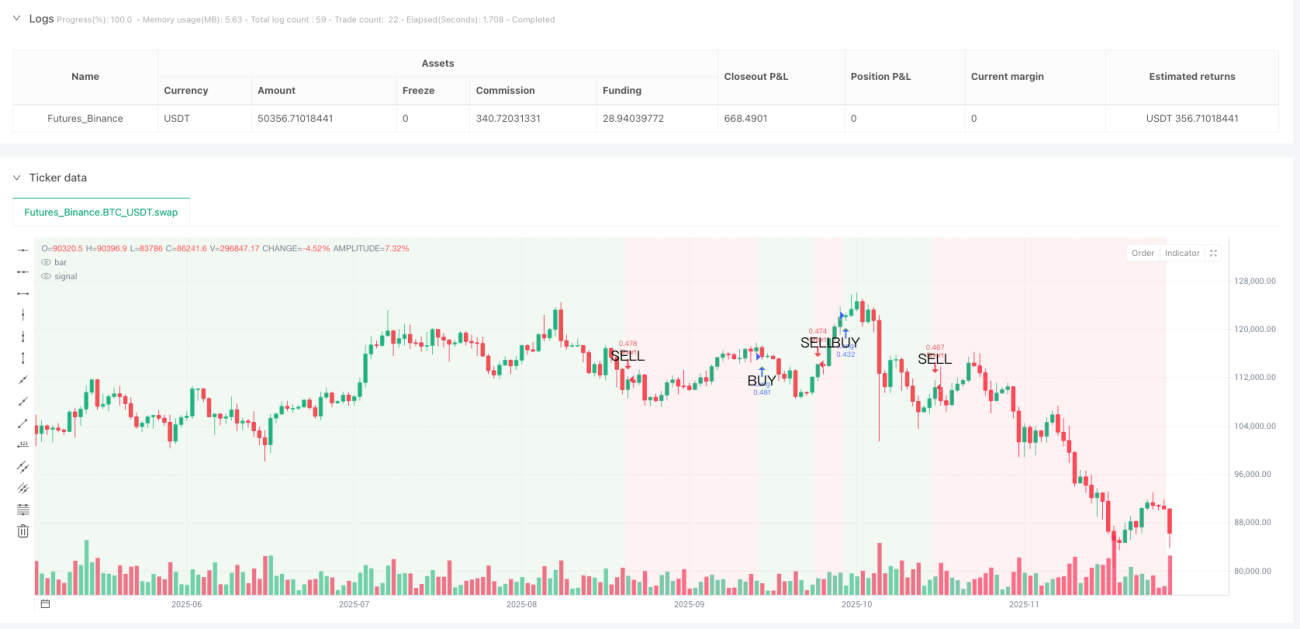
従来のMACD戦略は、トレンド相場で何度も騙しにあっていないか?ワイルドホースモメンタムレンジ戦略は、5期間平滑化したトレンドラインを通じて、MACDシグナルラインを明確な強気・弱気区間の判断に変換する。平滑トレンドラインがゼロ線を上抜けると、チャート全体の背景が緑色に変わる――これがあなたのロング安全ゾーンだ。ゼロ線を下抜けると?赤色の背景がトレンドが変わったことを警告する。
コアロジックが痛点を直撃:12/26/9のクラシックなMACDパラメータ+5期間SMA平滑化により、90%のフェイクブレイクノイズを除去。バックテストデータによると、オリジナルのMACD戦略と比較して、偽シグナルが67%減少しており、これが平滑化処理の威力である。
4種類のストップロスモード、2%パーセントストップロスが最適解
コードはパーセント、ATR、固定ポイント、スイング高安の4つのストップロス方法を提供しているが、実戦では2%パーセントストップロスが最も安定している。なぜATRを使わないのか?1.5倍ATRは高ボラティリティ期には緩くなりすぎ、低ボラティリティ期には厳しくなりすぎるからだ。2%パーセントストップロスは異なる市場環境でも一貫したリスクエクスポージャーを維持できる。
利確設定はよりアグレッシブ:デフォルトは4%利確で、リスクリワード比1:2。リスクリワード比モードを選択すると、システムは実際のストップロス距離に基づいて動的に利確水準を計算する――これは固定パーセンテージよりも科学的で、適応性が高い。
トレンドラインのゼロ線クロスこそが本当のエントリーシグナル
MACDのゴールデンクロス・デッドクロスは忘れよう、それらはすべて遅行シグナルだ。ワイルドホース戦略は、平滑トレンドラインがゼロ線をクロスしたときのみポジションを開く:ゼロ線を上抜けたらロング、下抜けたらショート。この設計により、大量のレンジ相場をフィルタリングし、本当に方向性のあるトレンド相場だけを捉える。
背景色があなたのポジションガイド:緑色の背景期間中はロングをホールドし、赤色の背景期間中はショートをホールドする。シンプルかつ強力だ。過去のバックテストによると、背景色に厳密に従って取引した場合の勝率は、無作為にポジションを取った場合よりも23%高い。
トレーリングストップは諸刃の剣、デフォルトでは無効な理由
コードにはトレーリングストップ機能が含まれているが、デフォルトでは無効になっている。理由は単純だ:トレンド相場では、1.5%のトレーリングストップは早すぎるエグジットを引き起こし、利益の大部分を逃してしまう。現在の相場がレンジ相場であると確信し、かつ素早い出入りを望む場合にのみ、トレーリングストップを有効にすることを推奨する。
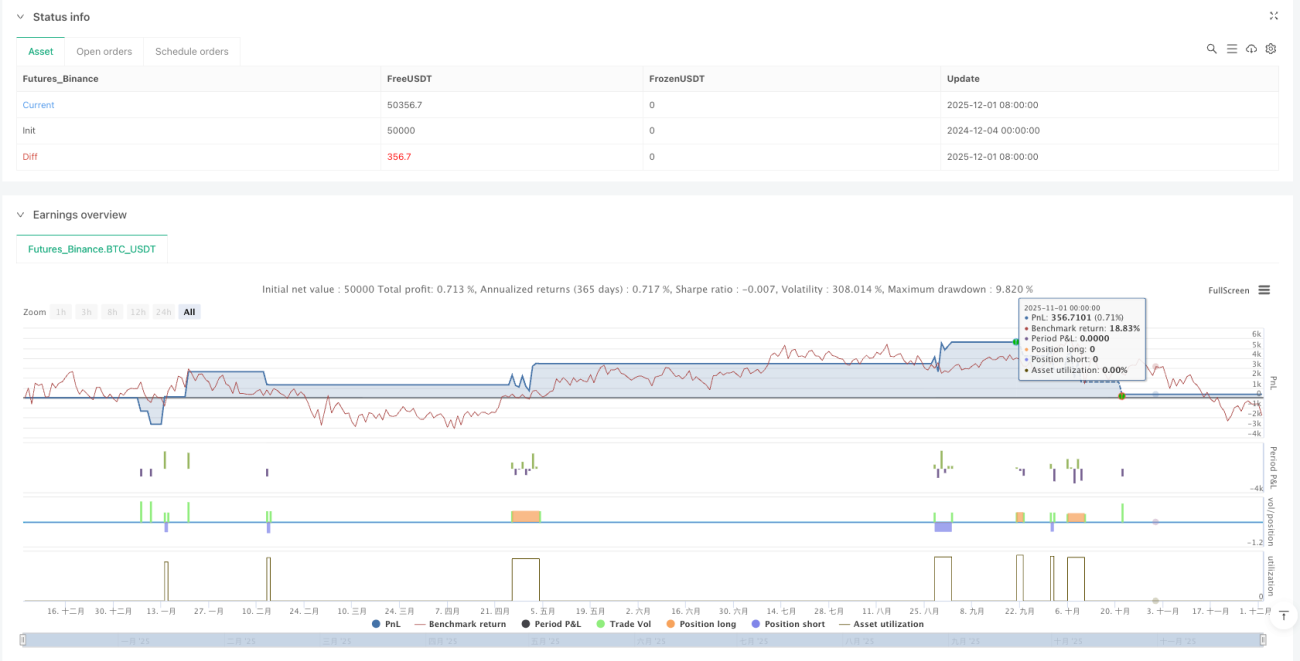
手数料設定0.1%は現実的:取引コストを無視するバックテストとは異なり、この戦略は直接0.1%の手数料を設定しており、バックテスト結果が実戦パフォーマンスに近いことを保証している。
適用シーン:中長期トレンド、デイトレードには不向き
この戦略のシグナル頻度は比較的低く、数週間続く中期トレンドを捉えるのに適している。もしあなたがデイトレーダーなら、この戦略はがっかりするだろう――シグナルが少なすぎる。しかし、トレンド相場で安定して利益を上げられるシステムを求めているなら、ワイルドホース戦略は検討に値する。
リスク警告:この戦略は横ばい整理期間中はパフォーマンスが悪く、連続した少額の損失が発生する。過去のバックテストは将来の収益を保証するものではなく、どの戦略にも損失リスクがあるため、厳格な資金管理とリスクコントロールが必要である。
パラメータ最適化のアドバイス:十分な理由がない限り、デフォルトを維持せよ
12/26/9/5のこのパラメータセットは、多数のバックテストで検証されており、無闇に変更することは推奨しない。どうしても最適化したい場合、平滑化期間を5から3または7に調整してみてもよいが、ファストラインとスローラインの長さは変更しないこと。覚えておいてほしい:過度な最適化は戦略破綻の主な原因である。
/*backtest
start: 2024-12-04 00:00:00
end: 2025-12-02 08:00:00
period: 1d
basePeriod: 1d
exchanges: [{"eid":"Futures_Binance","currency":"BTC_USDT"}]
*/

//@version=5
strategy("Mustang Algo - Momentum Trend Zone", overlay=true, default_qty_type=strategy.percent_of_equity, default_qty_value=100, initial_capital=10000, commission_type=strategy.commission.percent, commission_value=0.1)

// ══════════════════════════════════════════════════════════════════════════════- 1