키워드, 문법, 설정 설명
코드 구조
Pine의 코드가 따르는 일반적인 구조는:
<version>
<declaration_statement>
<code>
참고
FMZ의 파인 언어 지원 코멘트 기호: 단일 라인 코멘트//<unk>: 여러 줄의 주석/* */예를 들어, 아래의 예제에서 코멘트를 쓰면:
pine
[macdLine, signalLine, histLine] = ta.macd(close, 12, 26, 9) // 计算MACD指标
/*
plot函数在图表上画出指标线
*/
plot(macdLine, color = color.blue, title='macdLine')
plot(signalLine, color = color.orange, title='signalLine')
plot(histLine, color = color.red, title='histLine')
버전
다음과 같은 형태의 컴파일러 명령어들은 컴파일러에게 스크립트가 어떤 버전의 Pine로 작성되었는지 알려줍니다:
            pine

            //@version=5
기본 v5 버전으로, 코드에서 제외할 수 있습니다.//@version=5。
선언문
선언 문장은 스크립트의 유형을 결정하며, 이것은 그 안에 무엇이 허용되는지, 그리고 어떻게 사용되고 실행되는지를 결정한다. 스크립트의 핵심 속성을 설정한다. 예를 들어, 그것의 이름, 그것이 차트에 추가되었을 때, 그것이 어디에 나타날지, 그것이 보여주는 값의 정밀도와 형식, 그리고 그것이 실행될 때 특정 행동을 관리하는 값, 예를 들어, 그것이 차트에 표시될 최대 그림 개체 수. 전략에 있어, 속성에는 초기 자본, 수수료, 슬라이드 포인트 등과 같은 역량을 제어하는 매개 변수가 포함된다.indicator()또는strategy()声明声明.
코드
스크립트의 코멘트나 컴파일러 명령어가 아닌 줄은 문장이며, 그것은 스크립트의 알고리즘을 구현한다. 문장은 이 중 하나일 수 있다.
문장은 여러 가지 방식으로 구성될 수 있습니다.
- 어떤 문장은 한 줄로 표현할 수 있는데, 예를 들어 대부분의 변수 선언은 하나의 함수 호출 줄만 포함하고, 또는 단일 라인 함수 선언이다. 다른 것들은, 구조와 같이, 항상 여러 줄이 필요하기 때문에, 그것들은 한 지역 블록이 필요하다.
- 스크립트의 전체 범위에 속하는 문장 (즉, 지역 블록에 속하지 않는 부분) 은
空格또는制表符(tab 키) 시작 <unk> 그들의 첫 번째 문자는 또한 이 줄의 첫 번째 문자가 되어야 한다 <unk> 줄의 첫 번째 위치에서 시작하는 줄은, 정의에 따라 스크립트의 전체 범위의 일부가 된다 <unk> - 구조 또는 다중 행 함수 선언은 항상
local block。 한 로컬 블록은 하나의 표기符 또는 네 개의 빈 공간으로 축소되어야 한다. 그렇지 않으면, 이전 라인의 연산 코드로 해독되며, 즉, 이전 라인의 코드의 연속으로 판단된다. 각 로컬 블록은 다른 로컬 범위를 정의한다. - 여러 개의 단행 문장은 쉼표 ((,) 를 사용하여 분리자 (separator) 로 한 줄에 연쇄될 수 있다.
- 한 줄에는 코멘트가 포함될 수도 있고, 그냥 코멘트일 수도 있다.
- 이 문장은 문장과 문장 사이를 두 번 묶을 수 있습니다.
예를 들어, 세 개의 로컬 블록을 포함하고, 사용자 정의 함수 선언에서 하나, 변수 선언에서 두 개가 if 구조를 사용하며, 다음과 같은 코드입니다:
            pine

            indicator("", "", true)             // 声明语句(全局范围),可以省略不写

barIsUp() =>                        // 函数声明(全局范围)
    close > open                    // 本地块(本地范围)

plotColor = if barIsUp()            // 变量声明 (全局范围)
    color.green                     // 本地块 (本地范围)
else
    color.red                       // 本地块 (本地范围)

runtime.log("color", color = plotColor)  // 调用一个内置函数输出日志 (全局范围)
코드 변경
긴 줄은 여러 줄로 나눌 수 있고, 또는 "포직"될 수 있다. 포직된 줄은 4의 배수가 아닌 한, 임의의 수의 공백으로 축소되어야 한다. (이러한 경계들은 부분 블록으로 축소하기 위해 사용된다.)
            pine

            a = open + high + low + close
이렇게 포장할 수 있습니다 (각 줄에 축소되는 빈 공간의 수는 4의 배수가 아니라는 점에 유의하십시오):
            pine

            a = open +
      high +
          low +
             close
하나의 긴 plot ((() 호출은 <unk>으로 포장될 수 있다.
            pine

            close1 = request.security(syminfo.tickerid, "D", close)      // syminfo.tickerid 当前交易对的日线级别收盘价数据系列
close2 = request.security(syminfo.tickerid, "240", close)    // syminfo.tickerid 当前交易对的240分钟级别收盘价数据系列
plot(ta.correlation(close, open, 100),                       // 一行长的plot()调用可以被包装
   color = color.new(color.purple, 40),
   style = plot.style_area,
   trackprice = true)
사용자 정의 함수 선언의 문장도 패키지 될 수 있다. 그러나, 지역 블록은 문법적으로 축소수로 시작해야 하기 때문에 ((4개의 빈 공간 또는 1개의 기호를 만드는), 다음 줄로 분할할 때, 문장의 계속되는 부분은 하나 이상의 축소수로 시작해야 한다 (((4개의 빈 공간의 곱과 같지 않다). 예를 들어:
            pine

            test(c, o) =>
    ret = c > o ?
       (c > o+5000 ?
          1 :
              0):
       (c < o-5000 ?
          -1 :
              0)

a = test(close, open)
plot(a, title="a")
시간계열
시간계열은 데이터 타입이나 형식이 아니라, 시간계열은 PINE 언어의 기본 구조 개념이다. 시간적으로 연속적으로 변화하는 값을 저장하기 위해 사용되며, 각 값은 하나의 시간점과 일치한다. 시간계열이 이러한 개념의 구조는 시간이 지남에 따라 변화하는 일련의 데이터를 처리하고 기록하는 데 적합하다.
내장 변수open예를 들어,open내장된 변수는 K선 BAR의 개시값을 기록합니다.open5분 K선주기의 데이터입니다.open변수에는 5분마다 K선 BAR (대항) 의 오프닝값이 기록되어 있습니다.open즉, 현재 K선 BAR의 개장값을 인용한다. 시간계열의 이전 값을 인용하기 위해, 우리는[]역사 연산자 (history operator) 는, 어떤 K선 BAR에 정책이 실행될 때,open[1]즉, 현재 K선 BAR의 이전 K선 BAR의 오프닝 가격을 참조한다.
하지만시간계열"배열"이라는 데이터 구조를 떠올리는 것은 쉽지만, PINE 언어에도 배열 타입이 있다. 하지만 그것들은 시간계와 완전히 다른 개념이다.
PINE 언어는 이렇게 설계된 시퀀스를 사용하여 정책 코드에서 클로즈값의 누적값을 쉽게 계산할 수 있으며, for와 같은 순환 구조를 사용하지 않고 PINE 언어의 내장 함수를 사용하여 사용할 수 있습니다.ta.cum(close)또 하나의 예로, 우리는 마지막 14개의 K선 BAR (code execution 시 현재 시점의 가장 가까운 14개의 K선 BAR) 의 최대값과 최소값의 평균값을 계산해야 합니다.ta.sma(high - low, 14)
시간열에서 함수를 호출하는 결과는 시간열에 흔적을 남길 수 있습니다.[]역사 연산자는 이전 값을 참조한다. 예를 들어, 현재 K 선 BAR의 마감값이 마지막 10 K 선 BAR의 최고값의 최대값을 초과하는지 테스트한다. (현재의 K 선 BAR을 제외한다.)breach = close > ta.highest(close, 10)[1]"이봐, 이봐, 이봐"breach = close > ta.highest(close[1], 10)그래서ta.highest(close, 10)[1]그리고ta.highest(close[1], 10)그리고 그 다음에는
다음 코드로 확인할 수 있습니다.
            pine

            strategy("test pine", "test", true)

a = ta.highest(close, 10)[1]
b = ta.highest(close[1], 10)

plotchar(true, title="a", char=str.tostring(a), location=location.abovebar, color=color.red)
plotchar(true, title="b", char=str.tostring(b), location=location.belowbar, color=color.green)
위의 테스트 코드는 a와 b를 각 BAR에 대해 대응하는 시간 순서에서의 값을 출력합니다. a와 b의 값이 항상 같다는 것을 볼 수 있으므로 두 표현 방법은 동등합니다.
역사 데이터 인용 (history-referencing)
트레이딩 뷰에는 역사 데이터 인용에 대한 최대 항목 제한이 있습니다. 예를 들어, 다음과 같은 코드:
            pine

            //@version=6
indicator("test")

ema = ta.ema(close, 10000)      // 报错:Error on bar 0: The 'ema'->'sum' function references too many historical candles (10000), the limit is 5000.
plot(ema, "ema")

// pre10000 = ema[10000]        // 报错:Invalid number of bars back specified in the history-referencing operator. It accepts a value between 0 and 5000.
// plot(pre10000, "pre10000")
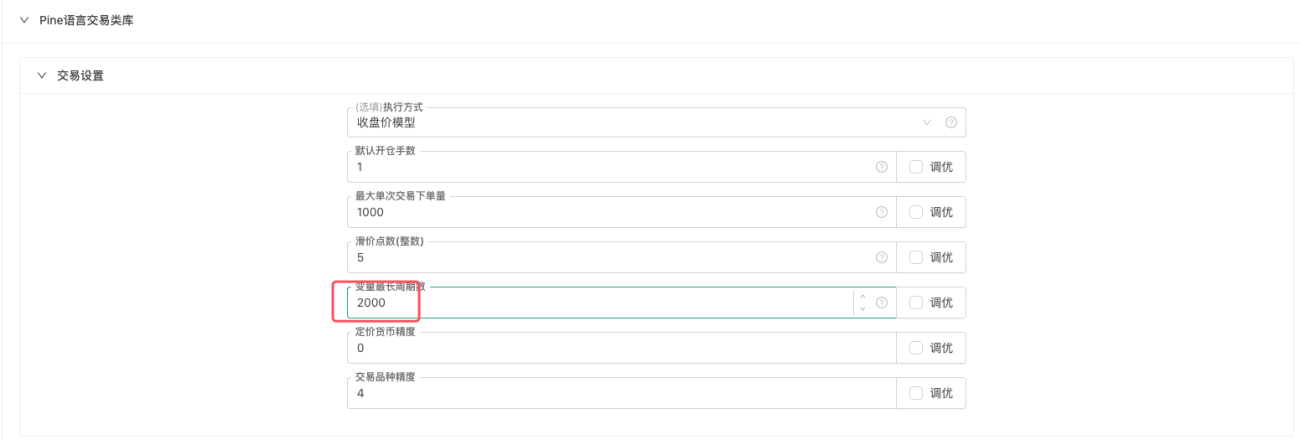
FMZ에서 PINE 언어 정책을 사용하는 Pine 언어 거래 클래스 라이브러리의 "거래 설정", 파라미트: "변수의 가장 긴 주기 수" 특정 설정 참조 가능한 데이터의 최대 항목.
            pine

            indicator("test")

ema = ta.ema(close, 1000)  // ema = ta.ema(close, 3000) 则报错:Invalid number 3000 of bars back specified in the history-referencing operator. It accepts a value between 0 and 2000.
plot(ema, "ema")
변수 최장주기수 (variable longest cycle number) 는 너무 커 설정되어서는 안되며, 적절한 정책에서 데이터 참조 범위는 <unk>.
Pine 언어 거래 클래스 라이브러리 모드 버전 변수
PINE 정책의 내장된 템플릿 "Pine 언어 거래 클래스 라이브러리"의 파라미트 설정 설명 <unk>
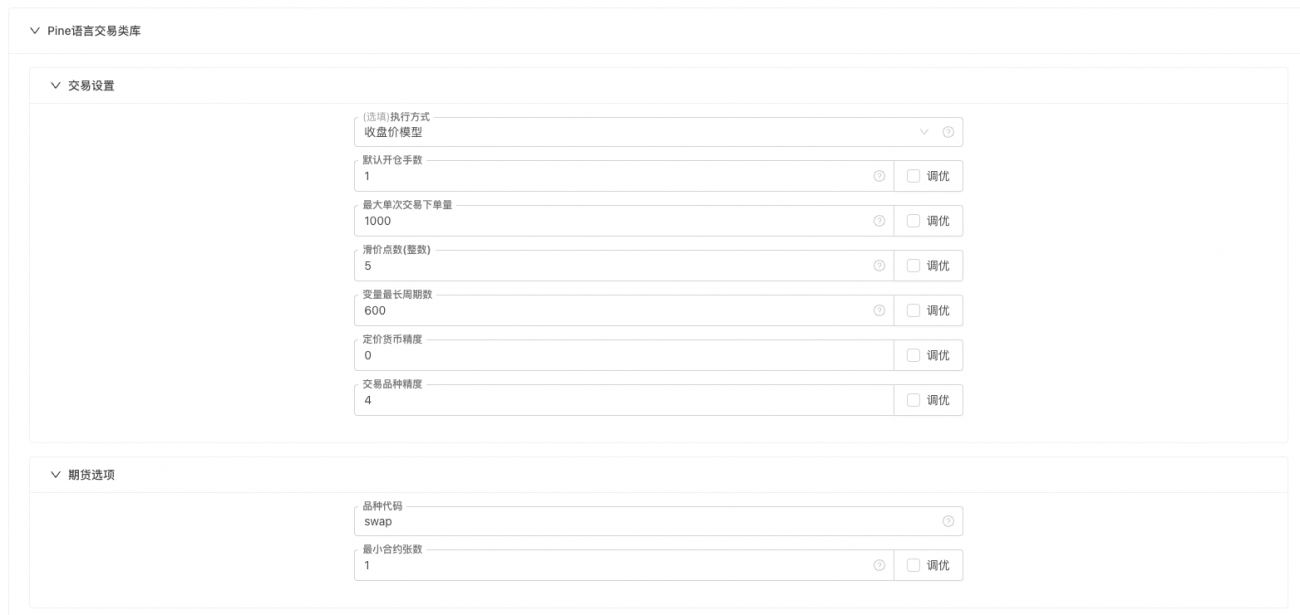
거래 설정
- 실행
클로즈 가격 모델: 현재 BAR가 끝나면 모델을 실행하고, 하위 BAR가 시작될 때 거래를 실행한다.
실시간 가격 모델: 가격의 변화마다 모델을 실행하고, 신호가 있으면 즉시 거래를 실행한다. - 기본 포지션 수: 거래 명령이 거래 수를 지정하지 않으면, 해당 설정의 수에 따라 거래를 실행하십시오.
- 최대 단일 거래 단위: 실제 상장량에 따라, 이 파라미터 설정과 함께, 매 매 주문의 최대 수를 결정하여 상장면을 충격을 피하십시오.
- 점유율의 점유율:
定价货币精度매개 변수와 매개 변수는 주문 시의 미끄러운 가격을 결정한다. 예를 들어, 가격화폐의 정밀도는 2로 설정되어 있고, 0.01으로 정확하다. 미끄러운 점수는 0.01의 가격 단위를 나타냅니다. 미끄러운 점수는 5로 설정되어 있으며, 주문 시의 미끄러운 가격은 0.05이다. 미끄러운 가격은 주문 시의 미끄러운 가격을 나타냅니다. - 변수의 최장주기 수: 그래프 K 라인 BAR의 수와
javascript전략에서 호출SetMaxBarLen함수는 동일하다.
선물 옵션
- 품종 코드: 계약 코드, 거래소 객체가 비현실 거래소 객체일 때만 설정해야 한다.
- 최소 계약 수: 주문할 때, 계약의 최소 거래량
실제 옵션
- 자동 복귀 진행: 자동으로 마지막 전략이 중단되기 전의 상태로 복귀한다.
- 주문 재시험 수: 주문이 거래되지 않으면 주문을 취소하고 거래를 시도하기 위해 다시 주문합니다. 이 매개 변수는 최대 재시험 수를 제한하는 데 사용됩니다.
- 네트워크 설문 조사 간격 ((밀리 초): REST 프로토콜에만 유효하며, 네트워크 요청 간격을 제어하여 거래소 제한을 초과하는 너무 빈번한 요청을 피한다.
- 계정 동기화 시간 (초): 계정 데이터를 동기화 하는 시간 주기.
- 포지션 개시 후 포지션 동기화 시간 ((밀리 초): 일부 거래소 데이터 지연으로 인한 반복 개시 포지션에만 적용되며, 동기화 시간을 더 크게 설정하면 이러한 문제를 완화 할 수 있습니다.
- 레버리 배수: 레버리 배수를 설정한다.
현금 거래, 다른 설정
- 일회용 거래량: 기본 일회용 거래량은 현금 거래에만 적용됩니다.
- 최소 거래량: 최소 거래량
- 가격의 정확성: 가격의 정확성, 즉 가격의 소수점.
- 거래 품종 정확도: 다음 주문량 정확도, 즉 다음 주문량 소수점.
- 수료: 이 설정에 따라 일부 데이터에 대해 계산하면, 0.002는 천분의 2을 나타냅니다.
- 손실 통계 간격: 실 디스크에서만 손실 통계 사용.
- 실패 재시험 ((밀리초): 네트워크 요청이 실패했을 때 재시험 간격.
- 에이전트 사용: REST 프로토콜에서만 유효하다.
- 일반적인 네트워크 오류를 숨기기: 로그 영역에서 일반적인 오류를 숨기기
- 스위치 베이스 주소: REST 프로토콜에서만 유효하다.
- 포스트 알림: 메세지를 포스트 박스에 포스트하는 것 등
주문하기
지점을 열기
            pine

            strategy(title = "open long example", pyramiding = 3)                                // pyramiding 允许的同方向下单的次数
strategy.entry("long1", strategy.long, 0.01)                                         // 市价开多仓,指定分组标签为long1
strategy.entry("long2", strategy.long, 0.02, when = close > ta.ema(close, 10))       // 条件触发,执行下单,市价开多仓
strategy.entry("long3", strategy.long, 0.03, limit = 30000)                          // 指定(较低的)价格,计划下买单订单,等待成交开仓,限价开仓
평지
            pine

            strategy(title = "close long example", pyramiding = 2)                              // pyramiding 允许的同方向下单的次数
strategy.entry("long1", strategy.long, 0.1)                                         // 市价开多仓,指定分组标签为long1
strategy.entry("long2", strategy.long, 0.1)                                         // 市价开多仓,指定分组标签为long2
strategy.close("long1", when = strategy.position_size > 0.1, qty_percent = 50, comment = "close buy entry for 50%")   // 平仓,指定平掉分组标签为long1的仓位的50%持仓
strategy.close("long2", when = strategy.position_size > 0.1, qty_percent = 80, comment = "close buy entry for 80%")   // 平仓,指定平掉分组标签为long2的仓位的80%持仓
거래 메커니즘
PINE 언어의 포지션 보유 메커니즘은 일방 포지션 보유와 유사하다. 예를 들어, 다방향 포지션을 보유할 때, 만약 판매하는 작업의 주문, 계획표 등이 있다 할 때 포지션 보유 방향에 대해 반대 방향의) 주문이 트리거 실행될 때, 이때 먼저 다방향 포지션을 평면화하고, 다음으로 트리거를 실행한다. 포지션 보유 방향에 대해 반대 방향의) 주문이 실행된다.
계획표
주문 명령어를 사용하여 주문할 때, 어떤 가격도 지정하지 않으면, 시가 요금이 기본으로 설정된다. 시가 요금 이외에도 계획 요금으로 주문할 수 있으며, 계획 요금은 즉시 주문을 실행하지 않는다.실판/회복시간 상태 정보 (즉, 전략이 실행되는 상태 <unk>) 의 "계획 주문" 란 칸에서 볼 수 있습니다. 시장 실시간 가격이 조건을 충족할 때 이러한 계획 주문을 유발할 때 시스템이 실제로 주문합니다. 따라서 이러한 주문은 거래 가격에 약간의 오차가있는 것이 정상적인 상황입니다.strategy.entry함수가 주문할 때, 우리는limit、stop변수
            var isTrade = false
if not barstate.ishistory and not isTrade
    isTrade := true
    strategy.entry("test 1", strategy.long, 0.1, stop=close*1.3, comment="test 1 order")                     // stop
    strategy.entry("test 2", strategy.long, 0.2, limit=close*0.7, comment="test 2 order")                    // limit
    strategy.entry("test 3", strategy.short, 0.3, stop=close*0.6, limit=close*1.4, comment="test 3 order")   // stop-limit
-
제한 주문
주문의 한계 가격을 설정합니다.
direction매개변수는 다음과 같습니다strategy.long), 오더는 현재 시장 가격이 그 가격보다 낮을 때만 트리거됩니다.
주문은 판매요금 (예:direction매개변수는 다음과 같습니다strategy.short), 오더는 현재 시장 가격이 그 가격보다 높을 때만 트리거됩니다. -
정지 명령
주문의 스톱 손실 가격을 설정합니다. 주문이 구매가 될 때, 주문은 시장의 현재 가격이 그 가격보다 높을 때만 트리거됩니다.
주문이 판매 주문일 때, 시장의 현재 가격이 그 가격보다 낮으면 주문이 트리거됩니다. -
stop-limit 주문
동시에 설정할 수 있습니다.
limit、stop매개 변수, 주문이 가장 먼저 합격한 가격에 트리거된다.
지분 비율
            pine

            //@version=5
strategy("Percent of Equity Order", overlay=true, default_qty_type=strategy.percent_of_equity, default_qty_value=100)

// 简单的均线交叉策略
longCondition = ta.crossover(ta.sma(close, 14), ta.sma(close, 28))
shortCondition = ta.crossunder(ta.sma(close, 14), ta.sma(close, 28))

// 如果均线交叉条件满足,则买入或卖出
if (longCondition)
    strategy.entry("Long", strategy.long)

if (shortCondition)
    strategy.entry("Short", strategy.short)
지정된default_qty_type=strategy.percent_of_equity후, 설정default_qty_value백분율 수로 ((0~100), 1은 1%이다. 계좌에 있는 평가 통화 수에 따라 주문을 계산한다. 예를 들어: 현재 계좌에 10000 USDT가 있고, 1%의 주문을 설정한다. 즉 100 USDT 규모의 주문을 사용한다.
선언, 논리 구조 키워드
var
var은 배분 및 일회성 초기화 변수에 사용되는 키워드이다.
일반적으로, 키워드 var을 포함하지 않는 변수 부여 문법은 데이터 업데이트를 할 때마다 변수의 값을 덮어 둡니다. 반대로, 키워드 var을 사용하여 변수를 할당할 때, 데이터 업데이트에도 불구하고, 그들은 상태 <unk>을 계속 유지할 수 있으며, if-expressions의 조건을 충족시킬 때만 변경됩니다.
var variable_name = expression
설명:
variable_name- 파인 스크립트에서 허용되는 사용자 변수의 이름들 중 하나인 (((는 대문자와 소문자의 라틴 문자, 숫자, 하위 선을 포함할 수 있습니다._), 하지만 숫자로 시작하지 마세요) <unk>expression- 어떤 수학적 표현도, 정규 변수를 정의하는 것과 같다. 표현을 계산하고 변수에 한번만 할당한다.
예를 들어
            pine

            // Var keyword example
var a = close
var b = 0.0
var c = 0.0
var green_bars_count = 0
if close > open
    var x = close
    b := x
    green_bars_count := green_bars_count + 1
    if green_bars_count >= 10
        var y = close
        c := y
plot(a, title = "a")
plot(b, title = "b")
plot(c, title = "c")
변수 'a'는 일련의 각 기둥의 첫 기둥의 종결값을 유지한다.
변수 'b'는 시리즈의 첫 번째 ?? 녹색 ?? 가격 막대의 종료 가격을 유지한다.
변수 'c'는 시리즈의 10번째 <unk>그린<unk>의 종전 가격을 유지한다.
FMZ에서는 실시간 가격 모델과 종결 가격 모델로 구분되어 있습니다.var、varip우리는 다음과 같은 코드를 사용하여 선언 변수를 테스트합니다.
            pine

            strategy("test pine", "test 1", true)

// 测试 var varip
var i = 0
varip ii = 0

// 将策略逻辑每轮改变的i、ii打印在图上
plotchar(true, title="ii", char=str.tostring(ii), location=location.abovebar, color=color.red)
plotchar(true, title="i", char=str.tostring(i), location=location.belowbar, color=color.green)

// 每轮逻辑执行都给i、ii递增1
if true
    i := i + 1
    ii := ii + 1
-
실시간 가격 모델
위의 테스트 코드는 실행 시 두 단계로 나뉘어져 있습니다: 1 , 역사 K 라인 단계 ◦ 2 , 실제 K 라인 단계 ◦var、varip선언된 변수 i, ii는 정책 코드의 각 라운드 실행에 따라 증가 동작을 수행합니다.if true따라서 반드시 해당 조건 코드 블록을 실행한다) ᄒ 그래서 K선 BAR에 표시되는 숫자가 각각 1을 증가하는 것을 볼 수 있다. 역사 K선 단계가 끝나면 실시간 K선 단계가 시작된다.var、varip선언된 변수는 다른 변화가 시작된다. 실시간 가격 모델이기 때문에, K선 BAR 내의 가격 변화마다 전략 코드가 실행되고,i := i + 1그리고ii := ii + 1모두 한 번 실행한다。 차이점은 ii가 매번 수정한다。 i는 매번 수정되기도 하지만, 다음 라운드 실행 전략 논리시 이전값을 복원한다. 현재 K선 BAR가 지나가기 전까지는 i의 값을 새로 결정한다. 따라서 i의 값은 다음 라운드 실행 전략 논리시 이전값을 복원하지 않는다. 따라서 i의 값은 여전히 각 BAR 1이 증가하는 것을 볼 수 있다。 하지만, ii의 값은 각 BAR에 몇 번씩 누적된다。 -
종가 모델
종결 가격 모형은 K선 BAR가 끝나면 한 번의 전략 논리를 수행한다. 따라서 종결 가격 모형에서는 역사적인 K선 단계와 실시간 K선 단계,var、varip선언된 변수는 위의 예제에서 증가하는 성능을 완전히 일치합니다. K줄마다 BAR 증가 1 <unk>이다.
varip
varip ((var intrabar persist) 는 배분 및 일회성 초기화 변수의 키워드이다. 이는 var 키워드와 비슷하지만, varip 선언을 사용하는 변수는 실시간 K선 업데이트 사이에 값을 유지한다.
varip variable_name = expression
설명:
variable_name- Pine 스크립트에서 허용되는 사용자 변수의 이름들 중 하나인 ((는 대문자 및 소문자 라틴 문자, 숫자 및 밑줄을 포함할 수 있습니다))_), 하지만 숫자로 시작하지 마세요) <unk>expression- 어떤 수학적 표현도, 정규 변수를 정의할 때와 마찬가지로. 첫 번째 K 선에서, 표현은 한 번만 계산되고 변수에 한 번만 할당된다.
예를 들어
            pine

            // varip
varip int v = -1
v := v + 1
plot(v)
var을 사용하면, 그림이 bar_index의 값을 반환한다. varp를 사용하면, 역사 K선에서 동일한 동작이 발생하지만, 실시간 K선에서는 그림이 각 tick에 대해 1을 증가시키는 값을 반환한다.
참고 사항
float,int,bool,string와 같은 간단한 타입과 이러한 타입의 배열과 함께만 사용할 수 있습니다.
true
부르 타입의 변수의 값을 나타내거나, 표현식에서 사용할 때비교또는논리연산자에서 계산할 수 있는 값
참고 사항
또한 참조비교연산자와논리연산자의 설명
이 부분도 참조하십시오.
bool
false
부르 타입 변수의 값을 나타내며, 비교 동작, 논리 동작의 결과를 나타낸다.
참고 사항
또한 참조비교연산자와논리연산자의 설명
이 부분도 참조하십시오.
bool
if
If 문장은 표현식 조건을 충족할 때 실행해야 하는 문장 블록을 정의한다. 4 버전의 파인 스크립트 언어는 ?? else if ?? 문법을 사용하도록 허용한다.
일반 코드는 다음과 같습니다:
            var_declarationX = if condition
    var_decl_then0
    var_decl_then1
    ...
    var_decl_thenN
    return_expression_then
else if [optional block]
    var_decl_else0
    var_decl_else1
    ...
    var_decl_elseN
    return_expression_else
else
    var_decl_else0
    var_decl_else1
    ...
    var_decl_elseN
    return_expression_else
참고 사항
var_declarationX- 이 변수는 if 문장의 값을 가져옵니다.
condition- 조건이 true라면, 문장 블록을 사용한다.then이 논리는var_decl_then0,var_decl_then1만약 조건이 false라면, 문장 블록을 사용한다.else if또는else이 논리는var_decl_else0,var_decl_else1<unk> <unk>
return_expression_then , return_expression_else- 모듈의 마지막 표현식 또는 블록else의 표현식은 문장의 최종값을 반환한다. 변수의 선언이 마지막에 있다면, 그 값은 결과값이 된다.
if 문장의 반환값의 종류는return_expression_then그리고return_expression_else타입。TradingView에서 실행할 때, 그들의 타입은 일치해야 한다: else 블록에 문자열 값이 있을 때, then 문장 블록에서 정수 값을 반환하는 것은 불가능하다。 FMZ에서 실행할 때, 다음 예제는 오류를 발생시키지 않으며, y 값이 "open"을 받을 때, plot 도면할 때 값은 n/a。
예를 들어
            pine

            // This code compiles
x = if close > open
    close
else
    open

// This code doesn’t compile by trading view
// y = if close > open
//     close
// else
//     "open"
plot(x)
제외할 수 있습니다.else블록. 이 경우, 조건이 false 인 경우, var_declarationX 변수에 <unk>empty <unk>값을 할당합니다:
예를 들어
            pine

            // if
x = if close > open
    close
// If current close > current open, then x = close.
// Otherwise the x = na.
plot(x)
여러 개의 <unk>else if<unk> 블록을 사용할 수 있거나 전혀 사용하지 않습니다. <unk>then<unk>, <unk>else if<unk>, <unk>else<unk>의 블록은 다음과 같이 네 개의 빈 공간으로 이동됩니다:
예를 들어
            pine

            // if
x = if open > close
    5
else if high > low
    close
else
    open
plot(x)
무시할 수 있습니다.if문장의 결과값은 ((<unk>var_declarationX=<unk>를 생략할 수 있습니다) ᅲ). 표현의 부작용이 필요한 경우에 유용할 수 있습니다. 예를 들어, 전략 거래에서:
예를 들어
            pine

            if (ta.crossover(high, low))
    strategy.entry("BBandLE", strategy.long, stop=low)
else
    strategy.cancel(id="BBandLE")
If 문장은 서로 포함될 수 있습니다:
예를 들어
            pine

            // if
float x = na
if close > open
    if close > close[1]
        x := close
    else
        x := close[1]
else
    x := open
plot(x)
for
'for' 구조는 여러 문장을 반복적으로 실행할 수 있게 해줍니다.
            [var_declaration =] for counter = from_num to to_num [by step_num]
    statements | continue | break
    return_expression
var_declaration- 선택 가능한 변수 선언으로 return_expression의 값으로 지정됩니다.
counter- 회전 카운터 값의 변수를 저장하고, 회전의 각 반복에서 1 또는 step_num 값을 증가/감소한다.
from_num- 카운터의 시작값 <unk>series int/float <unk>값/표현을 사용할 수 있습니다 <unk>series int/float <unk>값/표현을 사용할 수 있습니다 <unk>series int/float <unk>값/표현을 사용할 수 있습니다
to_num- 카운터의 최종값. 카운터가 to_num보다 크거나 from_num > to_num의 경우 to_num보다 작으면 순환이 중단된다. <unk>series int/float <unk>값/표현을 사용할 수 있지만, 그것들은 순환의 첫 번째 반복 시에만 평가된다.
step_num- 카운터의 증가/감소값. 그것은 선택적입니다. 기본값은 +1 또는 -1입니다. 이는 from_num 또는 to_num 중 가장 큰 값에 따라 다릅니다.
statements | continue | break- 임의의 수의 문장, 또는 'continue' 또는 'break' 키워드를 4개의 공백 또는 1개의 탭으로 축소하십시오.
return_expression- 루프의 반환값은, 존재한다면, var_declaration의 변수에 할당된다. 만약 루프가 <unk>continue<unk> 또는 <unk>break<unk> 키워드 때문에 종료된다면, 루프의 반환값은 루프가 종료되기 전에 할당된 값의 마지막 변수의 반환값이다.
continue- 회귀에서만 사용할 수 있는 키워드. 이는 회귀의 다음 반복이 실행되도록 한다.
break- 회로에서 탈퇴하는 키워드.
예를 들어
            pine

            // Here, we count the quantity of bars in a given 'lookback' length which closed above the current bar's close
qtyOfHigherCloses(lookback) =>
    int result = 0
    for i = 1 to lookback
        if close[i] > close
            result += 1
    result
plot(qtyOfHigherCloses(14))
for...in
for...in구조는 배열의 각 요소에 대해 반복적으로 여러 문장을 실행할 수 있다. 그것은 임의의 인수와 함께 사용될 수 있다:array_element, 또는 두 개의 변수와 함께 사용한다:[index, array_element]。 두 번째 형태는 순환의 기능을 영향을 주지 않는다。 그것은 모형의 첫 번째 변수에서 현재 반복의 인덱스를 추적한다。
            [var_declaration =] for array_element in array_id
    statements | continue | break
    return_expression

[var_declaration =] for [index, array_element] in array_id
    statements | continue | break
    return_expression
var_declaration- 선택 가능한 변수 선언, 순환하는 것에 부여됩니다return_expression값은
index- 현재 연대된 인덱스의 선택 변수를 추적한다. 인덱스는 0에서 시작된다. 변수는 순환체에서 변하지 않는다.array_element<unk>의 모형 중
array_element- 순환에서 처리될 각 연속 배열 요소의 변수를 포함한다. 이 변수는 순환체에서 변하지 않는다.
array_id- 회전 모의의 배열 ID.
statements | continue | break- 임의의 수의 문장, 또는 'continue' 또는 'break' 키워드를 4개의 공백 또는 1개의 탭으로 축소하십시오.
return_expression- 루프의 반환값은var_declaration속의 변수, 만약 존재한다면. 루프가 'continue' 또는 'break' 키워드 때문에 종료되면, 루프의 반환 값은 루프가 종료되기 전에 마지막으로 부여된 변수이다.
continue- 회귀에서만 사용할 수 있는 키워드. 이는 회귀의 다음 반복이 실행되도록 한다.
break- 회로에서 탈퇴하는 키워드.
루프 내에서 배열의 요소 또는 크기를 변경할 수 있습니다.
여기, 우리는for...in각각의 K 선에서, K 선의 OHLC 값이 'close' 값의 SMA보다 얼마나 큰지를 결정하기 위한 단일 변수 형태:
예를 들어
            pine

            // Here we determine on each bar how many of the bar's OHLC values are greater than the SMA of 'close' values
float[] ohlcValues = array.from(open, high, low, close)
qtyGreaterThan(value, array) =>
    int result = 0
    for currentElement in array
        if currentElement > value
            result += 1
        result
plot(qtyGreaterThan(ta.sma(close, 20), ohlcValues))
여기, for...in의 두 가지 변수를 사용해서isPos란 값이 있습니다.true우리한테 왔을 때valuesArray배열의 대응값은 정시입니다:
예를 들어
            pine

            // for...in
var valuesArray = array.from(4, -8, 11, 78, -16, 34, 7, 99, 0, 55)
var isPos = array.new_bool(10, false)

for [index, value] in valuesArray
    if value > 0
        array.set(isPos, index, true)

if barstate.islastconfirmedhistory
    runtime.log(str.tostring(isPos))
이 부분도 참조하십시오.
for while array.sum array.min array.max
while
while이 문장은 로컬 코드 블록의 조건 반복을 허용한다.
            variable_declaration = while boolean_expression
    ...
    continue
    ...
    break
    ...
    return_expression
설명:
variable_declaration- 선택 가능한 변수 선언.return expression이 변수에 대해 초기화 값을 제공할 수 있다.
boolean_expression- 만약 true라면 실행while문장의 로컬 블록. false라면while문장과 문장 뒤에 계속 스크립트를 실행하십시오.
continue - continue키워드는 순환을 다음 번으로 이어지게 합니다.
break - break키워드가 루프를 종료한다.while문장 후 복귀.
return_expression- 제공while문장값을 반환하는 옵션 행
예를 들어
            pine

            // This is a simple example of calculating a factorial using a while loop.
int i_n = input.int(10, "Factorial Size", minval=0)
int counter   = i_n
int factorial = 1
while counter > 0
    factorial := factorial * counter
    counter   := counter - 1

plot(factorial)
참고 사항
초창기while행 뒤에 있는 로컬 코드 블록은 4개의 빈 공간이나 1개의 기호로 축소되어야 합니다. 종료합니다.while순환,while다음 Boolean 표현은 결국 false로 바뀌어야 합니다.break。
switch
switch 연산자는 조건과 표현식의 값에 따라 제어권을 몇 개의 문장 중 하나에 이양한다.
            [variable_declaration = ] switch expression
    value1 => local_block
    value2 => local_block
    ...
    => default_local_block

[variable_declaration = ] switch
    boolean_expression1 => local_block
    boolean_expression2 => local_block
    ...
    => default_local_block
"switch"라는 표현이 있습니다.
예를 들어
            pine

            // Switch using an expression

string i_maType = input.string("EMA", "MA type", options = ["EMA", "SMA", "RMA", "WMA"])

float ma = switch i_maType
    "EMA" => ta.ema(close, 10)
    "SMA" => ta.sma(close, 10)
    "RMA" => ta.rma(close, 10)
    // Default used when the three first cases do not match.
    => ta.wma(close, 10)

plot(ma)
표현이 없는 스위치:
예를 들어
            pine

            strategy("Switch without an expression", overlay = true)

bool longCondition  = ta.crossover( ta.sma(close, 14), ta.sma(close, 28))
bool shortCondition = ta.crossunder(ta.sma(close, 14), ta.sma(close, 28))

switch
    longCondition  => strategy.entry("Long ID", strategy.long)
    shortCondition => strategy.entry("Short ID", strategy.short)
값을 반환합니다.
실행되는 로컬 시트먼트 블록의 마지막 표현의 값
참고 사항
실행할 수 있습니다.local_block예를 들어default_local_block첫 번째.default_local_block단지=>마크가 함께 도입되고, 이전 블록이 실행되지 않은 경우에만 실행됩니다.switch문장의 결과는 변수에 할당되고 지정되지 않습니다.default_local_block실행되지 않으면,local_block, 이 문장이 반환됩니다.na<unk>switch문장의 결과가 변수에 할당되면, 모든local_block이 인스턴스는 같은 타입의 값을 반환해야 합니다.
series
series는 데이터 시리즈의 유형을 나타내는 키워드이다.series키워드는 보통 불필요합니다.
연산자
=
변수에 값을 부여하는 데 사용되지만 변수를 선언할 때만 사용된다.
:=
부여 연산자, 왼쪽 변수에 부여하는 값. 이전 선언된 변수에 부여하는 값이다.
!=
≠ ≠ ≠ ≠ ≠ ≠ ≠ ≠ ≠ ≠ ≠ ≠ ≠ ≠ ≠ ≠ ≠ ≠
expr1 != expr2
값을 반환합니다.
부르값, 또는 부르값의 일련
%
모형수 ((整数余数) <unk>. 숫자 표현에 적용된다.
expr1 % expr2
값을 반환합니다.
실수 또는 부동소수점 값, 또는 일련의 값
참고 사항
파인 스크립트에서, 정수의 여분의 계산을 할 때, 상자는 단절된다. 즉, 최소 절대값으로 둥글게 둥글게 둥글게 둥글게 둥글게 둥글게 둥글게 둥글게 둥글다.
예: -1 % 9 = -1 - 9 * truncate ((-1/9) = -1 - 9 * truncate ((-0.111) = -1 - 9 * 0 = -1 △
%=
모들리얼 지명. 숫자 표현에 적용된다.
expr1 %= expr2
예를 들어
            pine

            // Equals to expr1 = expr1 % expr2.
a = 3
b = 3
a %= b
// Result: a = 0.
plot(a)
값을 반환합니다.
실수 또는 부동소수점 값, 또는 일련의 값
*
곱셈. 숫자 표현에 적용된다.
expr1 * expr2
값을 반환합니다.
실수 또는 부동소수점 값, 또는 일련의 값
*=
곱셈을 지정한다. 숫자 표현에 적용한다.
expr1 *= expr2
예를 들어
            pine

            // Equals to expr1 = expr1 * expr2.
a = 2
b = 3
a *= b
// Result: a = 6.
plot(a)
값을 반환합니다.
실수 또는 부동소수점 값, 또는 일련의 값
+
덧셈 또는 1인칭 기호. 숫자 표현식이나 문자열에 적용된다.
expr1 + expr2
+ expr
값을 반환합니다.
문자열의 이진성+expr1과 expr2의 합성을 반환합니다.
숫자는 전체 숫자 또는 플래잉 포인트 값을 반환합니다. 또는 일련의 값:
이진법 '+'은 expr1 더하기 expr2 을 반환한다.
1元<unk>+<unk>은 expr를 반환한다 ((1元 연산자의 대칭에 아무 것도 추가하지 않는다) <unk>
참고 사항
숫자와 변수들의 수를 가진 수학적 연산자를 사용할 수 있다. 수를 사용하는 경우, 연산자는 요소에 적용된다.
+=
덧셈 지명 <unk>은 숫자 표현식이나 문자열에 적용된다.
expr1 += expr2
예를 들어
            pine

            // Equals to expr1 = expr1 + expr2.
a = 2
b = 3
a += b
// Result: a = 5.
plot(a)
값을 반환합니다.
문자열의 경우, expr1과 expr2의 연속성을 반환한다. 숫자의 경우, 정수 또는 부동소수점 값을 반환한다. 또는 일련의 값을 반환한다.
참고 사항
숫자와 변수들의 수를 가진 수학적 연산자를 사용할 수 있다. 수를 사용하는 경우, 연산자는 요소에 적용된다.
-
빼기법 또는 일인수 음수 ᄂ. 숫자 표현식에 적용된다.
expr1 - expr2
- expr
값을 반환합니다.
전체 숫자 또는 플래잉 포인트 값을 반환합니다.
이진법 '+'은 expr1 빼기 expr2을 반환한다.
1원-expr의 부정식을 반환한다.
참고 사항
숫자와 변수들의 수를 가진 수학적 연산자를 사용할 수 있다. 수를 사용하는 경우, 연산자는 요소에 적용된다.
-=
빼기법 지명. 숫자 표현에 적용된다.
expr1 -= expr2
예를 들어
            pine

            // Equals to expr1 = expr1 - expr2.
a = 2
b = 3
a -= b
// Result: a = -1.
plot(a)
값을 반환합니다.
실수 또는 부동소수점 값, 또는 일련의 값
/
예외: 숫자 표현에 적용된다.
expr1 / expr2
값을 반환합니다.
실수 또는 부동소수점 값, 또는 일련의 값
/=
<unk>除法指派。 숫자 표현식에 적용한다。
expr1 /= expr2
예를 들어
            pine

            // Equals to expr1 = expr1 / expr2.
a = 3
b = 3
a /= b
// Result: a = 1.
plot(a)
값을 반환합니다.
실수 또는 부동소수점 값, 또는 일련의 값
<
미만 △는 숫자 표현에 적용된다.
expr1 < expr2
값을 반환합니다.
부르값, 또는 부르값의 일련
<=
이보다 작거나 같다는 것은 숫자 표현에 적용된다.
expr1 <= expr2
값을 반환합니다.
부르값, 또는 부르값의 일련
==
모든 종류의 표현에 적용된다.
expr1 == expr2
값을 반환합니다.
부르값, 또는 부르값의 일련
=>
'=>' 연산자는 사용자 정의 함수 선언과switch문장에서 <unk>
함수 선언 문법은 다음과 같습니다.
            <identifier>([<parameter_name>[=<default_value>]], ...) =>
    <local_block>
    <function_result>
하나<local_block>0개 또는 그 이상의 파인 문장이다.
<function_result>변수, 표현식 또는 모형이다.
예를 들어
            pine

            // single-line function
f1(x, y) => x + y
// multi-line function
f2(x, y) =>
    sum = x + y
    sumChange = ta.change(sum, 10)
    // Function automatically returns the last expression used in it
plot(f1(30, 8) + f2(1, 3))
참고 사항
사용자 설명서의 선언 함수 및 스크립트 라이브러리 페이지에서 사용자 정의 함수에 대한 자세한 정보를 얻을 수 있습니다.
>
△보다 크다. 숫자 표현에 적용된다.
expr1 > expr2
값을 반환합니다.
부르값, 또는 부르값의 일련
>=
이보다 크거나 같다. 숫자 표현에 적용된다.
expr1 >= expr2
값을 반환합니다.
부르값, 또는 부르값의 일련
?:
삼위 조건 연산자 △
expr1 ? expr2 : expr3
예를 들어
            pine

            // Draw circles at the bars where open crosses close
s2 = ta.cross(open, close) ? math.avg(open,close) : na
plot(s2, style=plot.style_circles, linewidth=2, color=color.red)

// Combination of ?: operators for 'switch'-like logic
c = timeframe.isintraday ? color.red : timeframe.isdaily ? color.green : timeframe.isweekly ? color.blue : color.gray
plot(hl2, color=c)
값을 반환합니다.
만약 expr1이 true로 평가된다면, expr2가, 그렇지 않으면 expr3이다. 0값 ((0과 NaN+, Infinity,-Infinity) 은 false로 간주되며, 다른 값들은 true이다.
참고 사항
필요 없는 경우, na를 <unk>else<unk>의 지점으로 사용하십시오.
두 개 이상의?: 연산자를 결합하여 ?? switch ?? 와 같은 문장을 구현할 수 있습니다. ( 위의 예제를 참조하십시오.)
숫자와 변수들의 수를 가진 수학적 연산자를 사용할 수 있다. 수를 사용하는 경우, 연산자는 요소에 적용된다.
이 부분도 참조하십시오.
na
[]
일련의 하위 <unk> expr1 시리즈의 이전 값에 대한 액세스를 제공합니다 expr2는 지난 k 줄의 수이며, 값이어야 합니다 <unk> 플로잉은 아래로 둥글게 둥글게 둥글게 둥글게 둥글게 둥글게 둥글게 둥글게 둥글게 둥글게 둥글게 둥글게 둥글게 둥글게 둥글게 둥글게 둥글게 둥글게 둥글게 둥글게 둥글게 둥글게 둥글게 둥글게 둥글게 둥글게 둥글게 둥글게 둥글게 둥글게 둥글게 둥글게 둥글게 둥글게 둥글게 둥글게 둥글게 둥글게 둥글게 둥글게 둥글게 둥글게 둥글게 둥글게 둥글게 둥글게 둥글게 둥글게 둥글게 둥글게 둥글게 둥글게 둥글게 둥
expr1[expr2]
예를 들어
            pine

            // [] can be used to "save" variable value between bars
a = 0.0 // declare `a`
a := a[1] // immediately set current value to the same as previous. `na` in the beginning of history
if high == low // if some condition - change `a` value to another
    a := low
plot(a)
값을 반환합니다.
일련의 값들
이 부분도 참조하십시오.
math.floor
and
논리 AND <unk>은 <unk> 표현식에 적용된다.
expr1 and expr2
값을 반환합니다.
부르값, 또는 부르값의 일련
or
논리 OR。는 부어 표현에 적용된다。
expr1 or expr2
값을 반환합니다.
부르값, 또는 부르값의 일련
not
논리 역설 ((NOT) ᄋ) ᄂ) ᄂ) ᄂ) ᄂ) ᄂ) ᄂ) ᄂ) ᄂ) ᄂ) ᄂ) ᄂ) ᄂ) ᄂ) ᄂ) ᄂ) ᄂ) ᄂ) ᄂ)
not expr1
값을 반환합니다.
부르값, 또는 부르값의 일련
데이터 타입 키워드
bool
명시적으로 선언하는 변수 또는 변수들의 bool () () () () () 류의 키워드. "Bool" 변수의 값은 true, false 또는 na이 될 수 있다.
예를 들어
            pine

            // bool
bool b = true    // Same as `b = true`
b := na
plot(b ? open : close)
참고 사항
변수 선언에서 타입을 명시적으로 언급하는 것은 선택적입니다, 만약 na로 초기화되지 않는다면. 타입 시스템의 사용자 설명서 페이지에서 Pine 타입에 대한 더 많은 정보를 참조하십시오.
이 부분도 참조하십시오.
var varip int float color string true false
int
<unk>int<unk> ((整数) 타입의 키워드, <unk>int<unk> () () () () () () () () () () () () () () () () () () () () () () () () () () () () () () () () () () () () () () () () () () () () () () () () () () () () () () () () () () () () () () () () () () () () () () () () () () () () () () () () () () () () () () () () () () () () () () () () () () () () ()
예를 들어
            pine

            // int
int i = 14    // Same as `i = 14`
i := na
plot(i)
참고 사항
변수 선언에서 타입을 명시적으로 언급하는 것은 선택적입니다, 만약 na로 초기화되지 않는다면. 타입 시스템의 사용자 설명서 페이지에서 Pine 타입에 대한 더 많은 정보를 참조하십시오.
이 부분도 참조하십시오.
var varip float bool color string
float
<unk>float<unk> ((플로잉 포인트) 타입의 키워드, <unk>float<unk> ((플로잉 포인트)) 타입의 키워드, <unk>float<unk> ((플로잉 포인트)) 타입의 키워드.
예를 들어
            pine

            // float
float f = 3.14    // Same as `f = 3.14`
f := na
plot(f)
참고 사항
변수 선언에서 유형을 명시적으로 언급하는 것은 선택적입니다.
이 부분도 참조하십시오.
var varip int bool color string
string
"string" 타입의 키워드로서, 변수나 변수를 명시적으로 선언한다.
예를 들어
            pine

            // string
string s = "Hello World!"    // Same as `s = "Hello world!"`
// string s = na // same as ""
plot(na, title=s)
참고 사항
변수 선언에서 타입을 명시적으로 언급하는 것은 선택적입니다, 만약 na로 초기화되지 않는다면. 타입 시스템의 사용자 설명서 페이지에서 Pine 타입에 대한 더 많은 정보를 참조하십시오.
이 부분도 참조하십시오.
var varip int float bool str.tostring str.format
color
"color" 타입의 키워드를 사용하여 변수나 변수를 명시적으로 선언합니다.
예를 들어
            pine

            // color
color textColor = color.green
if barstate.islastconfirmedhistory
    runtime.log("test", textcolor = textColor)
참고 사항
컬러 문자에는 다음과 같은 형식이 있습니다: #RRGGBB 또는 #RRGGBBAA. 문자 쌍은 00에서 FF까지의 16진법값을 나타냅니다 ((10진법 0에서 255까지), 여기서 RR, GG 및 BB 쌍은 색상의 빨간색, 녹색 및 파란색 분량의 값입니다. AA는 색상의 투명성 (또는 알파 분량) 의 선택값입니다.
변수 선언에서 타입을 명시적으로 언급하는 것은 선택적입니다, 만약 na로 초기화되지 않는다면. 타입 시스템의 사용자 설명서 페이지에서 Pine 타입에 대한 더 많은 정보를 참조하십시오.
이 부분도 참조하십시오.
var varip int float string color.rgb color.new
array
명시적으로 변수 또는 변수를 선언하는 <unk> 배열 <unk> 타입의 키워드 <unk>. 사용할 수 있다array.new<type>,array.from함수는 배열 객체 ((또는 ID) 를 만듭니다.
예를 들어
            pine

            // array
array<float> a = na
a := array.new<float>(1, close)
plot(array.get(a, 0))
참고 사항
배열의 대상은 항상 <unk> 시리즈 <unk> 형태이다.
이 부분도 참조하십시오.
var array.new array.from
Objects
PINE 언어의 Objects 객체는 사용자 정의 타입 (UDT) 의 예이며, 무방법 클래스로 이해될 수 있으며, 사용자가 정책에서 사용자 정의 타입을 만들어 하나의 엔티티에 다른 값을 조직할 수 있도록 해준다.
유형 정의
주문 정보를 저장하기 위해 'order type'를 정의해 봅시다.
            pine

            type order
    float price
    float amount
    string symbol
- 사용
type키워드 선언 유형 - type 키워드 뒤에 type 이름이다.
- 첫 번째 줄 type는 타입 이름을 정의한 후, 네 개의 공백으로 스커닝하여 타입이 포함된 필드를 정의합니다.
- 각 필드는 int,float,string 등의 데이터 타입을 명시해야 합니다.
객체 생성
선언된 타입을 사용하여 호출new()함수 생성 객체:
            pine

            order1 = order.new()
            pine

            order1 = order.new(100, 0.1, "BTC_USDT")
            pine

            order1 = order.new(amount = 0.1, symbol = "BTC_USDT", price = 100)
빈 오브젝트를 만들 수도 있습니다.
            pine

            order order1 = na
여기 실제 사례가 있습니다.
            pine

            type order
    float price
    float amount
    string symbol

if strategy.position_size == 0 and open > close
    strategy.entry("long", strategy.long, 1)

order1 = order.new(strategy.opentrades.entry_price(strategy.opentrades - 1), strategy.opentrades.size(strategy.opentrades - 1), syminfo.ticker)
// runtime.log(order1)   // 输出 {"data":{"price":46002.8,"amount":1,"symbol":"swap"},"_meta":0,"_type":"order"}
예를 들면,
            pine

            order1 = order.new(strategy.opentrades.entry_price(strategy.opentrades - 1), strategy.opentrades.size(strategy.opentrades - 1), syminfo.ticker)
이 문서는 다음과 같은 형태로 작성될 수 있습니다.
            pine

            order order1 = na
order1 := order.new(strategy.opentrades.entry_price(strategy.opentrades - 1), strategy.opentrades.size(strategy.opentrades - 1), syminfo.ticker)
객체 타입 var 키워드에 대한 사용
            pine

            //@version=5
indicator("Objects using `var` demo")

//@type A custom type to hold index, price, and volume information.
type BarInfo
    int   index = bar_index
    float price = close
    float vol   = volume

//@variable A `BarInfo` instance whose fields persist through all iterations, starting from the first bar.
var BarInfo firstBar = BarInfo.new()
//@variable A `BarInfo` instance declared on every bar.
BarInfo currentBar = BarInfo.new()

// Plot the `index` fields of both instances to compare the difference.
plot(firstBar.index, "firstBar")
plot(currentBar.index, "currentBar")
var 키워드 선언을 사용하여 사용자 정의 타입의 객체의 변수를 할당할 때, 그 키워드는 자동으로 그 객체의 모든 필드에 적용된다. 이것은 var 키워드 선언을 통해 선언된 객체가 각 반복 사이에 그 상태를 유지한다는 것을 의미하며, 각각의 반복에서 그 필드 값을 다시 초기화할 필요가 없다.
- firstBar 객체는 var 키워드를 사용하여 선언되었으므로, 그 필드 (index, price, vol) 는 첫 번째 항목에서 시작하여 마지막 항목이 끝날 때까지 모든 반복에서 그 값을 유지합니다.
- currentBar 객체는 var 키워드 선언을 사용하지 않으므로, 그 필드는 각 항목에 다시 초기화되고, 각각의 연동에 새로운 객체가 존재합니다.
두 개체의 인덱스 필드를 매핑하여 그 사이의 차이를 비교할 수 있습니다. firstBar.index는 각 반복에서 이전 설정된 값을 유지하며, currentBar.index는 각 반복에서 현재 항목의 bar_index 값으로 다시 초기화됩니다.
객체 타입 varip 키워드 사용
            pine

            //@version=5
indicator("Objects using `varip` fields demo")

//@type A custom type that counts the bars and ticks in the script's execution.
type Counter
    int       bars  = 0
    varip int ticks = 0

//@variable A `Counter` object whose reference persists throughout all bars.
var Counter counter = Counter.new()

// Add 1 to the `bars` and `ticks` fields. The `ticks` field is not subject to rollback on unconfirmed bars.
counter.bars  += 1
counter.ticks += 1

// Plot both fields for comparison.
plot(counter.bars, "Bar counter", color.blue, 3)
plot(counter.ticks, "Tick counter", color.purple, 3)
파인에서, varip 키워드를 사용하면 스크립트 실행 내내 객체의 필드가 계속 존재하도록 지시할 수 있으며, 확인되지 않은 칼럼 내에 돌아가지 않습니다.
카운터 타입의 선언에서, bars 필드는 varp 키워드를 사용하지 않아서, 확인되지 않은 각 열에 대해 회전한다. ticks 필드는 varp 키워드를 사용해서, 확인되지 않은 열에 대해 회전하지 않는다.
counter 오브젝트는 var 키워드를 사용하여 선언되었으므로 스크립트 실행 내내 지속됩니다.
각 연산에서 bars 필드와 ticks 필드가 증가한다. bars 필드는 확인되지 않은 각 기둥에서 회전하지만 ticks 필드는 회전하지 않는다.
마지막으로 counter.bars와 counter.ticks 필드를 그리면서 그 사이의 차이를 비교할 수 있다. counter.bars의 값은 각 확인되지 않은 열 안에 돌아가는 반면 counter.ticks의 값은 스크립트 실행이 끝날 때까지 계속 증가한다.
필드 값을 수정합니다.
            pine

            type order
    float price
    float amount
    string symbol

if strategy.position_size == 0 and open > close
    strategy.entry("long", strategy.long, 1)

order1 = order.new(strategy.opentrades.entry_price(strategy.opentrades - 1), strategy.opentrades.size(strategy.opentrades - 1), syminfo.ticker)

if strategy.position_size != 0
    runtime.log(order1)
    order1.price := 999
    order1.amount := 100
    runtime.log(order1)
    runtime.error("stop")
사용할 수 있습니다:=재배치 연산자는 객체 필드의 값을 변경한다.
객체 집합
예를 들어, 사용자가 정의한 order 타입의 객체를 저장하는 null 배열을 선언합니다:
            pine

            type order
    float price
    float amount
    string symbol

arrOrder = array.new<order>()

order1 = order.new(99, 1, "BTC_USDT")
order2 = order.new(100, 2, "ETH_USDT")

array.push(arrOrder, order1)
array.push(arrOrder, order2)

runtime.log(arrOrder)
runtime.error("stop")
또는
            pine

            type order
    float price
    float amount
    string symbol

var array<order> arrOrder = na
arrOrder := array.new<order>()

order1 = order.new(99, 1, "BTC_USDT")
order2 = order.new(100, 2, "ETH_USDT")

array.push(arrOrder, order1)
array.push(arrOrder, order2)

runtime.log(arrOrder)
runtime.error("stop")
복제 대상
파인에서는, 객체는 참조로 할당된다. 기존의 객체가 새로운 변수에 할당될 때, 둘 다 동일한 객체를 가리킨다.
            pine

            //@version=5
indicator("")
type pivotPoint
    int x
    float y
pivot1 = pivotPoint.new()
pivot1.x := 1000
pivot2 = pivot1
pivot2.x := 2000
// Both plot the value 2000.
plot(pivot1.x)
plot(pivot2.x)
아래의 예제에서, 우리는 pivot1 객체를 생성하고, 그 x 필드를 1000로 설정한다. 그리고, 우리는 pivot2가 그 pivot1 객체에 대한 참조를 포함하는 변수를 선언하고, 따라서 둘 다 같은 인스턴스를 가리키고 있다. 따라서, pivot2.x를 변경하면 pivot1.x도 변경된다, 왜냐하면 둘 다 x 같은 객체의 필드를 가리키고 있기 때문이다.
원본 객체로부터 독립된 복사본을 만들기 위해, 이 경우 우리는 내장된 copy() 방법을 사용할 수 있습니다. 이 예제에서, 우리는 pivot2가 pivot1 객체의 복제 인스턴스의 변수를 참조한다고 선언합니다. 이제, pivot2.x를 변경하면 pivot1.x가 변경되지 않습니다, 왜냐하면 그것은 x가 개별 객체의 필드를 참조하기 때문입니다:
            pine

            //@version=5
indicator("")
type pivotPoint
    int x
    float y
pivot1 = pivotPoint.new()
pivot1.x := 1000
pivot2 = pivotPoint.copy(pivot1)
pivot2.x := 2000
// Plots 1000 and 2000.
plot(pivot1.x)
plot(pivot2.x)
참고로, TradingView의 copy 메소드는 간접 복사이다. 만약 객체가 특별한 타입의 필드 (array 등) 를 가지고 있다면, 그 객체의 간접 복사 속의 필드들은 그 객체와 동일한 인스턴스를 가리키게 된다.
FMZ 플랫폼은 Deep Copy를 직접 구현하고 추가적인 처리가 필요하지 않습니다.
더 깊이 복사
            pine

            //@version=5

indicator("test deepCopy")

type orderInfo
    float price
    float amount

type labelInfo
    orderInfo order
    string labelMsg

labelInfo1 = labelInfo.new(orderInfo.new(100, 0.1), "test labelInfo1")
labelInfo2 = labelInfo.copy(labelInfo1)

labelInfo1.labelMsg := "labelInfo1->2"    // 修改 labelInfo1 的基础类型字段,看是否影响 labelInfo2
labelInfo1.order.price := 999             // 修改 labelInfo1 的复合类型字段,看是否影响 labelInfo2

runtime.log(labelInfo1)
runtime.log(labelInfo2)
runtime.error("stop")
테스트 결과, labelInfo.copy ((labelInfo1) 가 실행될 때 심복으로, labelInfo1의 어떤 필드를 변경하는 것은 labelInfo2에 영향을 미치지 않는다.
Methods
파인 언어의 메소드 (Methods) 는 특정 인스턴스의 내장 또는 사용자 정의된 타입과 연관된 특수 함수이다. 대부분의 면에서, 이들은 일반 함수와 기본적으로 동일하지만, 더 짧고 편리한 문법을 제공한다. 사용자가 직접 점자 기호를 사용하여 변수에 대한 메소드를 액세스할 수 있으며, 이는 파인 객체의 필드를 액세스하는 것과 같다. 파인은 배열, 매트릭스, 맵 라인, 필드 라인 등 모든 특수 유형의 내장 메소드를 포함한다.
내장 메소드
예를 들어, 다음과 같은 스크립트 코드가 있습니다.
            pine

            //@version=5
indicator("Custom Sample BB", overlay = true)

float sourceInput  = input.source(close, "Source")
int   samplesInput = input.int(20, "Samples")
int   n            = input.int(10, "Bars")
float multiplier   = input.float(2.0, "StdDev")

var array<float> sourceArray = array.new<float>(samplesInput)
var float        sampleMean  = na
var float        sampleDev   = na

// Identify if `n` bars have passed.
if bar_index % n == 0
    // Update the queue.
    array.push(sourceArray, sourceInput)
    array.shift(sourceArray)
    // Update the mean and standard deviaiton values.
    sampleMean := array.avg(sourceArray)
    sampleDev  := array.stdev(sourceArray) * multiplier

// Calculate bands.
float highBand = sampleMean + sampleDev
float lowBand  = sampleMean - sampleDev

plot(sampleMean, "Basis", color.orange)
plot(highBand, "Upper", color.lime)
plot(lowBand, "Lower", color.red)
이 문자는 다음과 같이 쓰여질 수 있습니다.
            pine

            //@version=5
indicator("Custom Sample BB", overlay = true)

float sourceInput  = input.source(close, "Source")
int   samplesInput = input.int(20, "Samples")
int   n            = input.int(10, "Bars")
float multiplier   = input.float(2.0, "StdDev")

var array<float> sourceArray = array.new<float>(samplesInput)
var float        sampleMean  = na
var float        sampleDev   = na

// Identify if `n` bars have passed.
if bar_index % n == 0
    // Update the queue.
    sourceArray.push(sourceInput)
    sourceArray.shift()
    // Update the mean and standard deviaiton values.
    sampleMean := sourceArray.avg()
    sampleDev  := sourceArray.stdev() * multiplier

// Calculate band values.
float highBand = sampleMean + sampleDev
float lowBand  = sampleMean - sampleDev

plot(sampleMean, "Basis", color.orange)
plot(highBand, "Upper", color.lime)
plot(lowBand, "Lower", color.red)
PINE가 지원하는 것을 볼 수 있습니다.Methods그 다음에는 코드입니다.array.avg(sourceArray)이 경우, f (x) = f (x) = f (x) = f (x) = f (x) = f (x) = f (x) = f (x) = f (x) = f (x).sourceArray.avg()。
참고: FMZ는 현재 지원되지 않습니다.array.avg이런 호출들.
사용자 정의 메소드
Pine는 사용자가 정의하는 사용자 정의 메소드를 임의의 내장 또는 사용자 정의 타입의 객체와 함께 사용하도록 허용한다. 정의 메소드는 정의 함수와 본질적으로 동일하지만 두 가지 중요한 차이점이 있습니다.
1 method 키워드는 함수 이름 전에 포함되어야 한다.
2. method의 arguments, 이 중 첫 번째 arguments의 타입은 명백한 선언이 되어야 합니다, 왜냐하면 그것은 그 메소드가 연관될 객체의 타입을 나타내는 것이기 때문입니다.
예를 들어, 다음 코드에 브린 지수를 계산하는 코드가 사용자 정의 된 방법으로 포장됩니다:
            pine

            //@version=5
indicator("Custom Sample BB", overlay = true)

float sourceInput  = input.source(close, "Source")
int   samplesInput = input.int(20, "Samples")
int   n            = input.int(10, "Bars")
float multiplier   = input.float(2.0, "StdDev")

var array<float> sourceArray = array.new<float>(samplesInput)
var float        sampleMean  = na
var float        sampleDev   = na

// Identify if `n` bars have passed.
if bar_index % n == 0
    // Update the queue.
    sourceArray.push(sourceInput)
    sourceArray.shift()
    // Update the mean and standard deviaiton values.
    sampleMean := sourceArray.avg()
    sampleDev  := sourceArray.stdev() * multiplier

// Calculate band values.
float highBand = sampleMean + sampleDev
float lowBand  = sampleMean - sampleDev

plot(sampleMean, "Basis", color.orange)
plot(highBand, "Upper", color.lime)
plot(lowBand, "Lower", color.red)
다음으로 수정됩니다.
            pine

            //@version=5
indicator("Custom Sample BB", overlay = true)

float sourceInput  = input.source(close, "Source")
int   samplesInput = input.int(20, "Samples")
int   n            = input.int(10, "Bars")
float multiplier   = input.float(2.0, "StdDev")

var array<float> sourceArray = array.new<float>(samplesInput)
method maintainQueue(array<float> srcArray, float value, bool takeSample = true) =>
    if takeSample
        srcArray.push(value)
        srcArray.shift()
    srcArray

method calcBB(array<float> srcArray, float mult, bool calculate = true) =>
    var float mean = na
    var float dev  = na
    if calculate
        mean := srcArray.avg()
        dev  := srcArray.stdev() * mult
    [mean, mean + dev, mean - dev]

bool newSample = bar_index % n == 0

[sampleMean, highBand, lowBand] = sourceArray.maintainQueue(sourceInput, newSample).calcBB(multiplier, newSample)

plot(sampleMean, "Basis", color.orange)
plot(highBand, "Upper", color.lime)
plot(lowBand, "Lower", color.red)
키워드 method 선언을 사용하는 사용자 정의 메소드를 볼 수 있습니다:maintainQueue,calcBB의 변수 목록의 첫 번째 변수는array<float>타입 △는 이 메서드가array<float>타입 변수의 방법, 그래서 다음과 같은 코드를 호출하여 브린 지수를 계산하는 것을 볼 수 있다.
            pine

            [sampleMean, highBand, lowBand] = sourceArray.maintainQueue(sourceInput, newSample).calcBB(multiplier, newSample)
메서드 재부하
사용자 정의 메소드는 동일한 아이덴티커를 가진 기존의 내장 메소드와 사용자 정의 메소드를 덮고 다시 로드할 수 있다. 이 기능은 사용자가 동일한 메소드 이름 아래 다른 변수 서명과 관련된 여러 개의 루트를 정의할 수 있다. 간단한 예로, 우리가 변수의 타입을 식별하기 위해 메소드를 정의하고 싶다고 가정하자. 사용자 정의 메소드와 관련된 객체 타입을 명시적으로 지정해야 하기 때문에, 우리가 인식하기를 원하는 각 타입에 대해 다시 로드를 정의해야 한다.
            pine

            //@version=5
indicator("Type Inspection")

// @function   Identifies an object's type.
// @param this Object to inspect.
// @returns    (string) A string representation of the type.
method getType(int this) =>
    na(this) ? "int(na)" : "int"

method getType(float this) =>
    na(this) ? "float(na)" : "float"

method getType(bool this) =>
    na(this) ? "bool(na)" : "bool"

method getType(color this) =>
    na(this) ? "color(na)" : "color"

method getType(string this) =>
    na(this) ? "string(na)" : "string"

a = 1             // a.getType(): float
b = 1.0           // b.getType(): float
c = true          // c.getType(): bool
d = color.white   // d.getType(): string(na)
e = "1"           // e.getType(): string

runtime.log("a.getType():", a.getType())
runtime.log("b.getType():", b.getType())
runtime.log("c.getType():", c.getType())
runtime.log("d.getType():", d.getType())
runtime.log("e.getType():", e.getType())
runtime.error("stop")
각 변수의 기본 타입을 결정합니다.getType()어떤 오버로드가 사용될 것인가. FMZ 플랫폼에서는 PINE 스크립트 기반이 자바스크립트 언어로 구현되어 있기 때문에 숫자 타입은 모두 플래프트 타입 데이터 ((float) 으로 판단된다.
내장 함수
함수를 호출할 때 매개 변수를 전달할 수 있으며, 매개 변수 이름을 지정할 수 있으며, 해당 매개 변수 위치에서 변수를 직접 전달할 수 있으며, 혼합 사용을 지원한다. 예를 들어:
            pine

            plot(close, title="test plot")     // 直接传参数 close ;指定参数 title ,赋值字符串"test plot"
지정된 변수명 부여 이후에는 변수를 직접 변수로 전달할 수 없으며, 이후의 변수는 변수명 부여의 형태로 작성되어야 한다.
            pine

            // plot(close, title="test", color.red)    // 虽然plot第三个参数是颜色值,但是这样写就会报错
plot(close, title="test", color=color.red) // 正确写法
plot(close, "test", color.red)             // 正确写法
timeframe
timeframe.in_seconds
이 자료는timeframe매개 변수의 시간주기는 초로 변환한다.
timeframe.in_seconds(timeframe)
예를 들어
            pine

            // Get chart timeframe:
i_tf = input.timeframe("1D")

// Convert timeframe to the int value (number of seconds in 1 Day):
tf = timeframe.in_seconds(i_tf)

plot(tf)
값을 반환합니다.
timeframeK선에서 수초를 나타내는 int의 형태는 △
매개변수
timeframe(simple string) 시간 주기。 옵션。 기본값은 timeframe.period。
참고 사항
<unk>에 대해timeframe>= '1M' 함수는 한 달의 30.4167 (365/12) 날의 수를 기준으로 계산한다.
이 부분도 참조하십시오.
input.timeframe timeframe.period
ticker
ticker.heikinashi
코드 식별자를 생성하여 평평한 K 선값을 요청한다.
ticker.heikinashi(symbol)
예를 들어
            pine

            heikinashi_close = request.security(ticker.heikinashi(syminfo.tickerid), timeframe.period, close)

heikinashi_aapl_60_close = request.security(ticker.heikinashi(syminfo.tickerid), "60", close)
plot(heikinashi_close)
plot(heikinashi_aapl_60_close)
값을 반환합니다.
주식 코드의 문자열 값은 request.security 함수에 제공된다.
매개변수
symbol(simple string) 상품 코드 식별자
이 부분도 참조하십시오.
syminfo.tickerid syminfo.ticker request.security
request
request.data
외부 데이터 요청
request.data(url, attribute)
예를 들어
            pine

            /*backtest
start: 2024-09-01 16:00:00
end: 2024-10-10 08:00:00
period: 1d
basePeriod: 1d
exchanges: [{"eid":"Futures_Binance","currency":"BTC_USDT"}]
args: [["RunMode",1,358374],["ZPrecision",0,358374]]
*/

var chart_data = "https://www.datadata.com/api/v1/query/ebe46218-c5c6-4366-8c72-413694417976/data"
spotPrice = request.data(chart_data, "$.spot_close_price")
futuresPrice = request.data(chart_data, "$.future_close_price")
diff = futuresPrice - spotPrice

plot(diff, "永续-现货差价")
plot(futuresPrice, "期货价格", overlay=true)
plot(spotPrice, "现货价格", overlay=true)

if diff > 80 and strategy.position_size >= 0
    runtime.log("diff > 80")
    strategy.entry("Enter Short", strategy.short)
if diff < 60 and strategy.position_size <= 0
    runtime.log("diff < 60")
    strategy.entry("Enter Short", strategy.long)
값을 반환합니다.
매개변수attribute지정된 데이터 시리즈
매개변수
-
url(simple string) 요청된 데이터 소스 url, 데이터 소스 응답 데이터 형식은 요구사항을 충족해야 합니다 ((적어도 time, data 속성을 포함해야 합니다):{"data": [], "schema": ["time", "data"]}◦ 예제 데이터 형식을 참조하세요:json{ "data": [ [1720051200000, "{\"spot_close_price\" : 57050.01, \"future_close_price\" : 57045.9}"], [1720137600000, "{\"spot_close_price\" : 56628.79, \"future_close_price\" : 56604.9}"], // ... ], "schema": ["time", "data"] } -
attribute(simple string) 속성 이름을 지정하여 필요한 데이터를 반환한다. 예를 들어:"$.spot_close_price",사용$.전단으로, 속성 이름은 요청 데이터 소스에서 응답하는 데이터의 data 필드의 속성과 일치합니다.
오류가 발생하면 확인해야 합니다.request.data요청된 시간 범위가 재측정 설정 시간 범위와 일치하는지, 재측정 시간 연속에서 데이터를 검색하지 않으면 오류가 발생한다.
이 예의 data-data 데이터 쿼리 SQL 문장:
            sql

            WITH latest_data AS (
    SELECT
        klines.spot_1d.Time AS time,
        CONCAT('{\"spot_close_price\" : ', klines.spot_1d.Close, ', \"future_close_price\" : ', klines.future_1d.Close, '}') AS data
    FROM
        klines.spot_1d
    JOIN
        klines.future_1d
    ON
        klines.spot_1d.Time = klines.future_1d.Time
    WHERE
        klines.spot_1d.Symbol = 'btc_usdt'
    AND
        klines.future_1d.Symbol = 'btc_usdt.swap'
    AND
        klines.spot_1d.Exchange = 'Binance'
    AND
        klines.future_1d.Exchange = 'Binance'
    ORDER BY
        klines.spot_1d.Time DESC
    LIMIT 100
)
SELECT * FROM latest_data
ORDER BY time ASC;
FMZ 플랫폼에서 볼 수 있습니다.데이터 탐색페이지 쿼리, 데이터 링크를 만드는, 예제에서 사용된https://www.datadata.com/api/v1/query/ebe46218-c5c6-4366-8c72-413694417976/data。
request.security
다른 품종/해석도를 요구하십시오.
request.security(symbol, timeframe, expression, gaps, lookahead, ignore_invalid_symbol, currency)
예를 들어
            pine

            s = request.security(syminfo.tickerid, "D", close)   // 1 Day
plot(s)

expr = ta.sma(close, 10)
s1 = request.security(syminfo.tickerid, "240", expr) // 240 Minutes
plot(s1)

// To avoid difference in calculation on history/realtime you can request not latest values and use merge strategy flags as follows:
s2 = request.security(syminfo.tickerid, "D", close[1], barmerge.gaps_off, barmerge.lookahead_on)
plot(s2)
f() => [open, high]
[o, h] = request.security(syminfo.tickerid, "D", f())
[l, c] = request.security(syminfo.tickerid, "D", [low, close])
plot((o + h + l + c) / 4)
값을 반환합니다.
요구 시리즈
매개변수
symbol(simple string) 상품 코드 <unk>timeframe(simple string) 시간 주기 △ 빈 문자열은 차트의 현재 시간 주기 △로 해석된다.expression(series int/float/bool/color) 는 request.security 호출에서 계산하여 표현식을 반환할 수 있다. 그것은 일련 또는 일련으로 변환할 수 있는 요소를 포함하는 모음이 될 수 있다.gaps(barmerge_gaps) 요청된 데이터 합병 전략 (((수요된 데이터는 자동으로 메인 시리즈 OHLC 데이터와 합병된다) △ 가능한 값: barmerge.gaps_on, barmerge.gaps_off △ barmerge.gaps_on - 요청된 데이터는 가능한 격차와 합병 ((na값) △ barmerge.gaps_off - 요청된 데이터는 연속적으로 합병되며, 모든 격차는 이전 가장 최근의 기존 값을 채운다 △ barmerge.gaps_off △lookahead(barmerge_lookahead) 요청된 데이터 통합 정책에 대해. 가능한 값: barmerge.lookahead_on, barmerge.lookahead_off. 버전 3부터는 barmerge.lookahead_off.ignore_invalid_symbol(const bool) 하나의 선택적 인 인수. 지정된 상품이 발견되지 않은 경우 함수의 행동을 결정합니다. 만약 false라면, 스크립트는 멈추고 실행할 때 오류를 반환합니다. 만약 true라면, 함수는 na를 반환하고 실행을 계속합니다.currency(simple string) 상품의 통화 관련 값을 (... 예를 들어 OHLC) 통화로 변환한다. 그리고 변환된 값에 따라 계산된다. <unk>expression <unk>. 사용 된 변환 비율은 FX_IDC 쌍의 전날의 매일 환율을 기반으로 한다.
참고 사항
이 기능을 이용한 파인스크립트 코드는 역사 기록과 실시간 데이터에 대해 다른 계산을 할 수 있다.
만약 당신이 요청된 상품에 대해 추가적인 매개 변수를 지정하고 싶다면, 예를 들어 거래 시간이나 조정 유형, 당신은 ticker.new() 함수를 사용할 수 있다.
'ticker' 변수를 사용할 수 없습니다. 점차를 이 함수에 전달합니다. 'ticker.new' 변수 또는 AAPL+MSFT와 같은 주식 코드의 문자열 표현을 사용할 수 있습니다.*TSLA”。
현재 한 스크립트에는 최대 40개의 request.security 호출이 가능합니다.
이 변수/함수를 사용하면 지표가 다시 그려질 수 있습니다.
해상도 변수는 다음과 같습니다.
1S, 5S, 15S, 30S - 초 간격 (그라프의 주기는 요청된 주기와 같거나 작아야 합니다)
1분에서 1440분
1D에서 365D까지
1W에서 52W까지 몇 주 동안
1M에서 12M까지 몇 달
이 부분도 참조하십시오.
syminfo.ticker syminfo.tickerid timeframe.period ta.correlation barmerge.lookahead_off barmerge.lookahead_on
str
str.contains
만약source문자열 포함str하위 문자열은 true를 반환하고, 그렇지 않으면 false를 반환한다.
str.contains(source, str)
예를 들어
            pine

            // If the current chart is a continuous futures chart, e.g “BTC1!”, then the function will return true, false otherwise.
var isFutures = str.contains(syminfo.tickerid, "!")
plot(isFutures ? 1 : 0)
값을 반환합니다.
만약source문자열에서 찾을 수 있습니다strTRUE 또는 FALSE 입니다.
매개변수
source(series string) 소스 문자열str(series string) 검색하는 하위 문자열
이 부분도 참조하십시오.
str.pos str.match
str.endswith
만약source문자열은str이 식에서 정의된 하위 문자열의 끝은 true를 반환하고, 그렇지 않으면 false를 반환한다.
str.endswith(source, str)
값을 반환합니다.
만약source문자열은str△ △ △ △ △ △ △
매개변수
source(series string) 소스 문자열str(series string) 검색하는 하위 문자열
이 부분도 참조하십시오.
str.startswith
str.startswith
만약source문자열은str이중에서 지정된 하위 문자열이 시작되면 true, 그렇지 않으면 false를 반환한다.
str.startswith(source, str)
값을 반환합니다.
만약source문자열은str△ (x) 에서 지정한 하위 문자열의 시작은 true이고, 그렇지 않으면 false이다.
매개변수
source(series string) 소스 문자열str(series string) 검색하는 하위 문자열
이 부분도 참조하십시오.
str.endswith
str.substring
다시 한 번 다시 한 번source문자열의 하위 문자열.begin_pos특정 인덱스에서 시작해서source문자열의 'end_pos - 1'。
str.substring(source, begin_pos)
str.substring(source, begin_pos, end_pos)
예를 들어
            pine

            sym= "EXCHANGE_NAME:SYMBOL_NAME"
pos = str.pos(sym, ":")        // Get position of ":" character
tkr= str.substring(sym, pos+1) // "SYMBOL_NAME"
if barstate.islastconfirmedhistory
    runtime.log(tkr)
값을 반환합니다.
소스 문자열에서 추출한 하위 문자열
매개변수
source(series string) 에서 자 문자열을 추출하는 소스 문자열begin_pos(series int) 추출된 하위 문자열의 시작 위치。 그것은 독점적인 것이다 (( 추출된 하위 문자열은 그 위치의 문자를 포함한다)。end_pos(series int) 종료 위치。 그것은 독점적인 것。 <unk>어지는 문자열은 그 위치의 문자를 포함하지 않는다。 옵션。 기본값은source문자열의 길이는
참고 사항
문자열 인덱스는 0에서 시작합니다.begin_pos동일한end_pos, 함수는 빈 문자열을 반환한다.
이 부분도 참조하십시오.
str.contains str.pos str.match
str.tonumber
str.tonumber(string)
값을 반환합니다.
유효숫자가 포함된 경우, 문자열의 플라잉 포인트 타입, 그렇지 않으면 na。
매개변수
string(series string) int 또는 float의 문자열 표현 형태。
str.format
포맷 문자열과 값을 포맷 문자열로 변환한다. 포맷 문자열은 텍스트와 포맷해야 하는 각 값의 대괄호{} 중 하나의 점수를 포함할 수 있다. 각 점수는 그것을 대체할 필수적인 매개 변수의 지수를 포함하고 있다. 그리고 선택 가능한 포맷 설명자이다. 인덱스는 str.format 매개 변수 목록에서 그 매개 변수의 위치를 나타낸다.
str.format(formatString, arg0, arg1, ...)
예를 들어
            pine

            // The format specifier inside the curly braces accepts certain modifiers:
// - Specify the number of decimals to display:
s1 = str.format("{0,number,#.#}", 1.34) // returns: 1.3
runtime.log(s1)

// - Round a float value to an integer:
s2 = str.format("{0,number,integer}", 1.34) // returns: 1
runtime.log(s2)

// - Display a number in currency:
s3 = str.format("{0,number,currency}", 1.34) // returns: $1.34
runtime.log(s3)

// - Display a number as a percentage:
s4 = str.format("{0,number,percent}", 0.5) // returns: 50%
runtime.log(s4)

// EXAMPLES WITH SEVERAL ARGUMENTS
// returns: Number 1 is not equal to 4
s5 = str.format("Number {0} is not {1} to {2}", 1, "equal", 4)
runtime.log(s5)

// returns: 1.34 != 1.3
s6 = str.format("{0} != {0, number, #.#}", 1.34)
runtime.log(s6)

// returns: 1 is equal to 1, but 2 is equal to 2
s7 = str.format("{0, number, integer} is equal to 1, but {1, number, integer} is equal to 2", 1.34, 1.52)
runtime.log(s7)

// returns: The cash turnover amounted to $1,340,000.00
s8 = str.format("The cash turnover amounted to {0, number, currency}", 1340000)
runtime.log(s8)

// returns: Expected return is 10% - 20%
s9 = str.format("Expected return is {0, number, percent} - {1, number, percent}", 0.1, 0.2)
runtime.log(s9)
값을 반환합니다.
포맷된 문자열
매개변수
formatString(series string) 형식 문자열arg0, arg1, ...(series int/float/bool/string/na/int[]/float[]/bool[]/string[]) 포맷해야 할 값
참고 사항
인용되지 않은 스타일의 모든 괄호는 균형을 유지해야 한다. 예를 들어, "ab {0} de"와 "ab '}' de"는 유효한 스타일이지만, "ab {0'}' de", "ab } de"와 "''{''"는 유효한 스타일이 아니다.
str.length
이 문자열의 문자 수에 해당하는 정수를 반환합니다.
str.length(string)
값을 반환합니다.
소스 문자열의 문자수
매개변수
string(series string) 소스 문자열
str.lower
모든 글자가 소문자로 변환된 새로운 문자열을 반환합니다.
str.lower(source)
값을 반환합니다.
모든 글자가 소문자로 된 새로운 문자열에 변환됩니다.
매개변수
source(series string) 변환하려는 문자열
이 부분도 참조하십시오.
str.upper
str.upper
모든 글자가 대문자로 변환된 새로운 문자열을 반환합니다.
str.upper(source)
값을 반환합니다.
모든 문자는 대문자로 된 새로운 문자열로 변환됩니다.
매개변수
source(series string) 변환하려는 문자열
이 부분도 참조하십시오.
str.lower
str.match
일치하는 경우regex정규 표현식, 반환source문자열의 새 자수 문자열, 그렇지 않으면 'na'를 반환한다.
str.match(source, regex)
예를 들어
            pine

            s = input.string("It's time to sell some EXCHANGE_NAME:SYMBOL_NAME!")

// finding first substring that matches regular expression "[\w]+:[\w]+"
var string tickerid = str.match(s, "[\\w]+:[\\w]+")

if barstate.islastconfirmedhistory
    runtime.log(tickerid) // "EXCHANGE_NAME:SYMBOL_NAME"
값을 반환합니다.
source만약 string의 새로운 하위 string이regex정규 표현식, 그렇지 않으면 'na'。
매개변수
source(series string) 소스 문자열regex(series string) 이 문자열과 일치하는 정규 표현식
참고 사항
함수 반환source문자열에서 처음 등장하는 정규 표현식:
regex문자열의 반축<unk> 기호는 <unk> 과 같은 추가 반축 기호를 사용하여 변환이 필요합니다.\d<unk>은 정규 표현식 <unk>\d<unk>。을 나타낸다.
이 부분도 참조하십시오.
str.contains str.substring
str.pos
다시 돌아왔어요source문자열에서 처음 나타납니다.str문자열의 위치, 그렇지 않으면 'na'를 반환한다.
str.pos(source, str)
값을 반환합니다.
str문자열은source문자열의 위치
매개변수
source(series string) 소스 문자열str(series string) 검색하는 하위 문자열
참고 사항
문자열 인덱스는 0에서 시작됩니다.
이 부분도 참조하십시오.
str.contains str.match str.substring
str.replace
새로운 문자열을 반환합니다.target문자열과 이전 문자열target문자열을replacementN이 있는 문자열occurrenceN은 소스 문자열에서 나타나는 일치 인덱스입니다.
str.replace(source, target, replacement, occurrence)
예를 들어
            pine

            var source = "EXCHANGE1:SYMBOL1 / EXCHANGE1:SYMBOL2"

// Replace first occurrence of "EXCHANGE1" with "EXCHANGE2" replacement string
var newSource = str.replace(source, "EXCHANGE1",  "EXCHANGE2", 0)

if barstate.islastconfirmedhistory
    // Display "EXCHANGE2:SYMBOL1 / EXCHANGE1:SYMBOL2"
    runtime.log(newSource)
값을 반환합니다.
처리된 문자열
매개변수
source(series string) 소스 문자열target(series string) 을 문자열로 바꾸어replacement(series string) 삽입하는 문자열이 목표 문자열이 아닌 <unk>occurrence(series int) 대체해야 하는 목표 문자열은 소스 문자열에서 나타나는 매칭 인덱스 ᄒ. 첫 번째 매칭 인덱스는 0에서 시작합니다 ᄂ. 선택 ᄂ. 0은 기본값입니다
이 부분도 참조하십시오.
str.replace_all str.match
str.replace_all
대입 문자열을 사용하여, 소스 문자열에서 매번 나타나는 목표 문자열을 대입한다.
str.replace_all(source, target, replacement)
값을 반환합니다.
처리된 문자열
매개변수
source(series string) 소스 문자열target(series string) 을 문자열로 바꾸어replacement(series string) 매번 나타난 목표 문자열을 대체하는 문자열
str.split
문자열을 하위 문자열 배열로 나누고 그 배열 ID를 반환한다.
str.split(string, separator)
값을 반환합니다.
문자열 배열의 ID。
매개변수
string(series string) 소스 문자열separator(series string) 각 하위 문자열을 구분하는 문자열
str.tostring
str.tostring(value)
str.tostring(value, format)
str.tostring(value[])
str.tostring(value[], format)
값을 반환합니다.
value매개 변수의 문자열은 형태를 나타냅니다.
만약value매개 변수는 문자열이고, 원래 그대로 반환된다.
언제value함수는 Na를 대입하면 NaN<unk>을 반환한다.
매개변수
value(series int/float/bool/string/int[]/float[]/bool[]/string[]) 그 요소를 문자열의 값이나 배열 ID로 변환한다.format(series string) Format string. Accepts these format.* constants: format.mintick, format.percent, format.volume. Optional. The default value is '#.##########'.
참고 사항
플래잉 포인트 값의 형식은 또한 필요한 경우 이러한 값들을 사각지대에 넣습니다. 예를 들어 str.tostring ((3.99, '#') 는 <unk>4<unk>을 반환합니다.
0을 0으로 표시하려면 '#' 대신 '0'을 사용하십시오. 예를 들어, '#.000'입니다.
format.mintick을 사용할 때, 이 값은 syminfo.mintick으로 나누기 가능한 가장 근접한 숫자로 둥글게 들어간다. △ 반환된 문자열은 0을 따른다.
x 변수가 문자열이라면 동일한 문자열 값을 반환한다.
Bool 타입의 arguments는 true 또는 false를 반환합니다.
x가 na일 때 함수는 NaN<unk>을 반환한다.
color
color.new
기능 색은 주어진 색에 투명성을 적용한다.
color.new(color, transp)
예를 들어
            pine

            plot(close, color=color.new(color.red, 50))
값을 반환합니다.
색은 특정한 투명성을 가진다.
매개변수
color(series color)transp(series int/float) 사용할 수 있는 값은 0 (투명하지 않음) 에서 100 (보이지 않음) 까지
참고 사항
매우 많은 수의 변수를 사용하는 것은 (예를 들어, <unk>simple<unk>, <unk>input<unk> 또는 <unk>series<unk>) 스크립트 <unk> 설정/스타일 <unk> 태그 페이지에서 표시되는 색상에 영향을 미칩니다. 자세한 내용은 사용자 설명서를 참조하십시오.
color.rgb
RGB 색상 모델을 사용하여 투명성을 가진 새로운 색상을 생성하십시오.
color.rgb(red, green, blue, transp)
예를 들어
            pine

            plot(close, color=color.rgb(255, 0, 0, 50))
값을 반환합니다.
색은 특정한 투명성을 가진다.
매개변수
red(series int/float) 적색. 가능한 값은 0에서 255이다.green(series int/float) 녹색 <unk>. 가능한 값은 0에서 255까지 <unk>.blue(series int/float) 블루톤. 가능한 값은 0에서 255이다.transp(series int/float) 선택가능하다. 색깔 투명하다. 가능한 값은 0 (투명하지 않은) 에서 100 (투명한) 까지이다. 0 (투명하지 않은) 이 기본값이다.
참고 사항
매우 많은 수의 변수를 사용하는 것은 (예를 들어, <unk>simple<unk>, <unk>input<unk> 또는 <unk>series<unk>) 스크립트 <unk> 설정/스타일 <unk> 태그 페이지에서 표시되는 색상에 영향을 미칩니다. 자세한 내용은 사용자 설명서를 참조하십시오.
runtime
runtime.debug
컨트롤러에서 변수 정보를 인쇄하십시오.
FMZ PINE 언어에는 고유한 기능이 있습니다.runtime.debug(value), 단 하나의 변수가 있습니다.
runtime.log
로그에서 출력하세요.
FMZ PINE 언어에는 고유한 기능이 있습니다.runtime.log(1, 2, 3, close, high, ...), 여러 개의 변수를 전달할 수 있습니다.
runtime.error
이 경우, 호출 시에는 실행 오류가 발생할 수 있으며,message매개 변수에서 지정된 오류 메시지
runtime.error(message)
매개변수
message (series string) 오류 메시지
input
input
input를 스크립트 설정의 input 태그 페이지에 추가합니다. 이것은 스크립트 사용자에게 구성 옵션을 제공하도록 허용합니다. 이 함수는 defval <unk>에 사용되는 파라미터 유형을 자동으로 탐지하고 해당 입력 플러그인을 사용합니다.
input(defval, title, tooltip, inline, group)
input(defval, title, inline, group, tooltip)
예를 들어
            pine

            i_switch = input(true, "On/Off")     // 设置true,默认勾选
plot(i_switch ? open : na)

i_len = input(7, "Length")
i_src = input(close, "Source")       // 下拉框,默认选择close
plot(ta.sma(i_src, i_len))

i_col = input(color.red, "Plot Color")
plot(close, color=i_col)

i_text = input("Hello!", "Message")
runtime.log(i_text)
값을 반환합니다.
입력 변수 값
매개변수
defval(const int/float/bool/string/color or source-type built-ins) 스크립트의 <unk> 설정/입입 <unk> 태그 페이지에서 제안된 입력 변수의 기본값을 결정하고, 스크립트 사용자가 그것을 변경할 수 있습니다. 소스 타입 내장 함수는 계산 소스를 지정하는 내장 일련의浮点 변수입니다:close、hlc3그리고...title(const string) 입력의 제목。 지정되지 않은 경우, 변수의 이름을 입력의 제목으로 사용합니다。 제목이 지정되어 있지만 제목이 빈 경우, 이름은 빈 문자열이 됩니다。tooltip(const string) 이 문자열은 마우스가 도구 제안 아이콘에 매달릴 때 사용자에게 표시됩니다.inline(const string) 한 줄에서 동일한 변수를 사용하여 모든 입력 호출을 통합한다. 변수로 사용되는 문자열을 표시하지 않는다. 그것은 단지 같은 줄에 속하는 입력을 식별하는 데 사용됩니다.group(const string) 모든 입력 위에 동일한 구성 요소 숫자 문자열을 사용하여 제목을 만듭니다. 이 문자열은 제목의 텍스트로도 사용됩니다.
참고 사항
input 함수의 반환값은 항상 변수에 할당되어야 한다. 위의 예시를 참조하십시오.
이 부분도 참조하십시오.
input.bool input.color input.int input.float input.string input.timeframe input.source
input.source
스크립트 설정의 입력 태그 페이지에 input를 추가하여 스크립트 사용자에게 구성 옵션을 제공 할 수 있습니다. 이 기능은 사용자가 계산 소스를 선택할 수 있는 드롭다운 메뉴를 추가했습니다. close, hl2 등과 같이. 스크립트가 input.source () 호출만 포함하면 사용자가 차트에 다른 지표의 출력 소스를 선택할 수 있습니다.
input.source(defval, title, tooltip, inline, group)
예를 들어
            pine

            i_src = input.source(close, "Source")
plot(i_src)
값을 반환합니다.
입력 변수 값
매개변수
defval(series int/float) 스크립트의 <unk> 설정/입입 <unk> 태그 페이지에서 제안된 입력 변수의 기본값을 결정하고, 사용자가 그것에서 변경할 수 있다.title(const string) 입력의 제목。 지정되지 않은 경우, 변수의 이름을 입력의 제목으로 사용합니다。 제목이 지정되어 있지만 제목이 빈 경우, 이름은 빈 문자열이 됩니다。tooltip(const string) 이 문자열은 마우스가 도구 제안 아이콘에 매달릴 때 사용자에게 표시됩니다.inline(const string) 한 줄에서 동일한 변수를 사용하여 모든 입력 호출을 통합한다. 변수로 사용되는 문자열을 표시하지 않는다. 그것은 단지 같은 줄에 속하는 입력을 식별하는 데 사용됩니다.group(const string) 모든 입력 위에 동일한 구성 요소 숫자 문자열을 사용하여 제목을 만듭니다. 이 문자열은 제목의 텍스트로도 사용됩니다.
참고 사항
input.source 함수의 결과는 항상 하나의 변수에 할당되어야 합니다. 위의 예시를 참조하십시오.
이 부분도 참조하십시오.
input.bool input.int input.float input.string input.timeframe input.color input
input.string
input를 스크립트 설정의 입력 옵션 카드에 추가합니다. 이 함수는 문자열 입력 필드를 스크립트의 입력에 추가합니다.
input.string(defval, title, options, tooltip, inline, group, confirm)
예를 들어
            pine

            i_text = input.string("Hello!", "Message")
runtime.log(i_text)
값을 반환합니다.
입력 변수 값
매개변수
defval(const string) 스크립트의 <unk> 설정/입입 <unk> 태그 페이지에서 제안된 입력 변수의 기본값을 결정하고, 사용자가 그것을 변경할 수 있다.options변수와 함께 사용할 때, 이 값은 둘 중 하나가 되어야 한다.title(const string) 입력의 제목。 지정되지 않은 경우, 변수의 이름을 입력의 제목으로 사용합니다。 제목이 지정되어 있지만 제목이 빈 경우, 이름은 빈 문자열이 됩니다。options(List of constants: [<type>...]) 선택 가능한 옵션 목록tooltip(const string) 이 문자열은 마우스가 도구 제안 아이콘에 매달릴 때 사용자에게 표시됩니다.inline(const string) 한 줄에서 동일한 변수를 사용하여 모든 입력 호출을 통합한다. 변수로 사용되는 문자열을 표시하지 않는다. 그것은 단지 같은 줄에 속하는 입력을 식별하는 데 사용됩니다.group(const string) 모든 입력 위에 동일한 구성 요소 숫자 문자열을 사용하여 제목을 만듭니다. 이 문자열은 제목의 텍스트로도 사용됩니다.confirm(const bool) 만약 true라면, 지표가 그래프에 추가되기 전에 사용자가 입력값을 확인하도록 요청한다. 기본값은 false이다.
참고 사항
input.string 함수의 결과는 항상 하나의 변수에 할당되어야 합니다. 위의 예시를 참조하십시오.
이 부분도 참조하십시오.
input.bool input.int input.float input.timeframe input.source input.color input
input.bool
input를 스크립트 설정의 input 태그 페이지에 추가합니다. 이 함수는 스크립트의 입력에 선택 표시를 추가합니다.
input.bool(defval, title, tooltip, inline, group, confirm)
예를 들어
            pine

            i_switch = input.bool(true, "On/Off")
plot(i_switch ? open : na)
값을 반환합니다.
입력 변수 값
매개변수
defval(const bool) 스크립트의 <unk> 설정/입입 <unk> 태그 페이지에서 제안된 입력 변수의 기본값을 결정하고, 사용자는 그것에서 변경할 수 있다.title(const string) 입력의 제목。 지정되지 않은 경우, 변수의 이름을 입력의 제목으로 사용합니다。 제목이 지정되어 있지만 제목이 빈 경우, 이름은 빈 문자열이 됩니다。tooltip(const string) 이 문자열은 마우스가 도구 제안 아이콘에 매달릴 때 사용자에게 표시됩니다.inline(const string) 한 줄에서 동일한 변수를 사용하여 모든 입력 호출을 통합한다. 변수로 사용되는 문자열을 표시하지 않는다. 그것은 단지 같은 줄에 속하는 입력을 식별하는 데 사용됩니다.group(const string) 모든 입력 위에 동일한 구성 요소 숫자 문자열을 사용하여 제목을 만듭니다. 이 문자열은 제목의 텍스트로도 사용됩니다.confirm(const bool) 만약 true라면, 지표가 그래프에 추가되기 전에 사용자가 입력값을 확인하도록 요청한다. 기본값은 false이다.
참고 사항
input.bool 함수의 결과는 항상 하나의 변수에 할당되어야 합니다. 위의 예시를 참조하십시오.
이 부분도 참조하십시오.
input.int input.float input.string input.timeframe input.source input.color input
input.int
input를 스크립트 설정의 input 태그 페이지에 추가합니다. 이것은 스크립트 사용자에게 구성 옵션을 제공하도록 허용합니다. 이 함수는 전체 입력 필드를 스크립트의 입력에 추가합니다.
input.int(defval, title, minval, maxval, step, tooltip, inline, group, confirm)
input.int(defval, title, options, tooltip, inline, group, confirm)
예를 들어
            pine

            i_len1 = input.int(10, "Length 1", minval=5, maxval=21, step=1)
plot(ta.sma(close, i_len1))

i_len2 = input.int(10, "Length 2", options=[5, 10, 21])
plot(ta.sma(close, i_len2))
값을 반환합니다.
입력 변수 값
매개변수
defval(const int) 스크립트의 <unk> 설정/입입 <unk> 태그 페이지에서 제안된 입력 변수의 기본값을 결정하고, 스크립트 사용자가 그것을 변경할 수 있다.options변수와 함께 사용할 때, 이 값은 둘 중 하나가 되어야 한다.title(const string) 입력의 제목。 지정되지 않은 경우, 변수의 이름을 입력의 제목으로 사용합니다。 제목이 지정되어 있지만 제목이 빈 경우, 이름은 빈 문자열이 됩니다。minval(const int) 입력 변수의 최소 가능한 값。 선택가능。maxval(const int) 입력 변수의 최대 가능한 값。 옵션。step(const int) 입력값을 늘리거나 줄이는 단계 길이 △ 선택 △ 기본값은 1 △options(tuple of const int values: [val1, val2, ...]) 는 드롭다운 메뉴에서 선택된 옵션 목록이며, 코마로 구분되어 사각형 괄호로 묶여 있습니다.[val1, val2, ...]。 이 변수를 사용할 때는 사용할 수 없습니다.minval、maxval그리고step변수tooltip(const string) 이 문자열은 마우스가 도구 제안 아이콘에 매달릴 때 사용자에게 표시됩니다.inline(const string) 한 줄에서 동일한 변수를 사용하여 모든 입력 호출을 통합한다. 변수로 사용되는 문자열을 표시하지 않는다. 그것은 단지 같은 줄에 속하는 입력을 식별하는 데 사용됩니다.group(const string) 모든 입력 위에 동일한 구성 요소 숫자 문자열을 사용하여 제목을 만듭니다. 이 문자열은 제목의 텍스트로도 사용됩니다.confirm(const bool) 만약 true라면, 지표가 그래프에 추가되기 전에 사용자가 입력값을 확인하도록 요청한다. 기본값은 false이다.
참고 사항
input.int 함수의 결과는 항상 하나의 변수에 할당되어야 합니다. 위의 예시를 참조하십시오.
이 부분도 참조하십시오.
input.bool input.float input.string input.timeframe input.source input.color input
input.float
input를 스크립트 설정의 input 태그 페이지에 추가합니다. 이것은 스크립트 사용자에게 구성 옵션을 제공하도록 허용합니다. 이 함수는 플러그 포인트 입력 필드를 스크립트의 입력에 추가합니다.
input.float(defval, title, minval, maxval, step, tooltip, inline, group, confirm)
input.float(defval, title, options, tooltip, inline, group, confirm)
예를 들어
            pine

            i_angle1 = input.float(0.5, "Sin Angle", minval=-3.14, maxval=3.14, step=0.02)
plot(math.sin(i_angle1) > 0 ? close : open, "sin", color=color.green)

i_angle2 = input.float(0, "Cos Angle", options=[-3.14, -1.57, 0, 1.57, 3.14])
plot(math.cos(i_angle2) > 0 ? close : open, "cos", color=color.red)
값을 반환합니다.
입력 변수 값
매개변수
defval(const int/float) 스크립트의 <unk> 설정/입입 <unk> 태그 페이지에서 제안된 입력 변수의 기본값을 결정하고, 스크립트 사용자가 그것을 변경할 수 있다.options변수와 함께 사용할 때, 이 값은 둘 중 하나가 되어야 한다.title(const string) 입력의 제목。 지정되지 않은 경우, 변수의 이름을 입력의 제목으로 사용합니다。 제목이 지정되어 있지만 제목이 빈 경우, 이름은 빈 문자열이 됩니다。minval(const int/float) 입력 변수의 최소 가능한 값。 옵션。maxval(const int/float) 입력 변수의 최대 가능한 값。 옵션。step(const int/float) 입력을 늘리거나 줄이는 단계 길이를 사용한다.options(tuple of const int/float values: [val1, val2, ...]) 는 드롭다운 메뉴에서 선택된 옵션 목록이며, 코마로 구분되어 사각형 괄호로 묶여 있습니다.[val1, val2, ...]。 이 변수를 사용할 때는 사용할 수 없습니다.minval、maxval그리고step변수tooltip(const string) 이 문자열은 마우스가 도구 제안 아이콘에 매달릴 때 사용자에게 표시됩니다.inline(const string) 한 줄에서 동일한 변수를 사용하여 모든 입력 호출을 통합한다. 변수로 사용되는 문자열을 표시하지 않는다. 그것은 단지 같은 줄에 속하는 입력을 식별하는 데 사용됩니다.group(const string) 모든 입력 위에 동일한 구성 요소 숫자 문자열을 사용하여 제목을 만듭니다. 이 문자열은 제목의 텍스트로도 사용됩니다.confirm(const bool) 만약 true라면, 지표가 그래프에 추가되기 전에 사용자가 입력값을 확인하도록 요청한다. 기본값은 false이다.
참고 사항
input.float 함수의 결과는 항상 하나의 변수에 할당되어야 합니다. 위의 예시를 참조하십시오.
이 부분도 참조하십시오.
input.bool input.int input.string input.timeframe input.source input.color input
input.color
이 함수는 색상 선택기를 추가하여 사용자가 색상 패널 또는 16 자리 값에서 색상과 투명성을 선택할 수 있도록 해줍니다.
input.color(defval, title, tooltip, inline, group, confirm)
예를 들어
            pine

            i_col = input.color(color.red, "Plot Color")
plot(close, color=i_col)
값을 반환합니다.
입력 변수 값
매개변수
defval(const color) 스크립트의 <unk> 설정/입력 <unk> 태그 페이지에서 제안된 입력 변수의 기본값을 결정하고, 사용자는 그것에서 변경할 수 있다.title(const string) 입력의 제목。 지정되지 않은 경우, 변수의 이름을 입력의 제목으로 사용합니다。 제목이 지정되어 있지만 제목이 빈 경우, 이름은 빈 문자열이 됩니다。tooltip(const string) 이 문자열은 마우스가 도구 제안 아이콘에 매달릴 때 사용자에게 표시됩니다.inline(const string) 한 줄에서 동일한 변수를 사용하여 모든 입력 호출을 통합한다. 변수로 사용되는 문자열을 표시하지 않는다. 그것은 단지 같은 줄에 속하는 입력을 식별하는 데 사용됩니다.group(const string) 모든 입력 위에 동일한 구성 요소 숫자 문자열을 사용하여 제목을 만듭니다. 이 문자열은 제목의 텍스트로도 사용됩니다.confirm(const bool) 만약 true라면, 지표가 그래프에 추가되기 전에 사용자가 입력값을 확인하도록 요청한다. 기본값은 false이다.
참고 사항
input.color 함수의 결과는 항상 하나의 변수에 할당되어야 합니다. 위의 예시를 참조하십시오.
이 부분도 참조하십시오.
input.bool input.int input.float input.string input.timeframe input.source input
input.price
가격 입력을 스크립트의 <unk> 설정/입력 <unk> 태그 페이지에 추가합니다. 사용confirm = true인터랙티브 입력 모드를 활성화하고, 차트를 클릭하여 가격을 선택하세요.
input.price(defval, title, tooltip, inline, group, confirm)
예를 들어
            pine

            price1 = input.price(title="Date", defval=42)
plot(price1)

price2 = input.price(54, title="Date")
plot(price2)
값을 반환합니다.
입력 변수 값
매개변수
defval(const int/float) 스크립트의 <unk> 설정/입입 <unk> 태그 페이지에서 제안된 입력 변수의 기본값을 결정하고, 사용자가 그것에서 변경할 수 있다.title(const string) 입력의 제목。 지정되지 않은 경우, 변수의 이름을 입력의 제목으로 사용합니다。 제목이 지정되어 있지만 제목이 빈 경우, 이름은 빈 문자열이 됩니다。tooltip(const string) 이 문자열은 마우스가 도구 제안 아이콘에 매달릴 때 사용자에게 표시됩니다.inline(const string) 한 줄에서 동일한 변수를 사용하여 모든 입력 호출을 통합한다. 변수로 사용되는 문자열을 표시하지 않는다. 그것은 단지 같은 줄에 속하는 입력을 식별하는 데 사용됩니다.group(const string) 모든 입력 위에 동일한 구성 요소 숫자 문자열을 사용하여 제목을 만듭니다. 이 문자열은 제목의 텍스트로도 사용됩니다.confirm(const bool) 만약 true라면, 인터랙티브 입력 모드를 활성화하고, 지표를 차트에 추가할 때 차트를 클릭하여 선택을 완료하거나, 지표를 선택하고 그 후에 선택을 이동하여 선택을 완료한다.
참고 사항
상호작용 모드를 사용할 때, 두 함수가 서로 호출되면inline매개 변수가 동일한 매개 변수를 사용하는 경우, 시간 입력과 가격 입력이 결합되어 사용될 수 있다.
이 부분도 참조하십시오.
input.bool input.int input.float input.string input.resolution input.source input.color input
input.timeframe
input를 스크립트 설정의 입력 태그 페이지에 추가합니다. 이 함수는 스크립트 사용자에게 구성 옵션을 제공합니다. 이 함수는 드롭 리스트를 추가하여 사용자가 시간 주기 선택기를 통해 특정 시간 기간을 선택하고 문자열로 반환할 수 있습니다.
input.timeframe(defval, title, options, tooltip, inline, group, confirm)
예를 들어
            pine

            i_res = input.timeframe('D', "Resolution", options=['D', 'W', 'M'])
s = request.security(syminfo.tickerid, i_res, close)
plot(s)
값을 반환합니다.
입력 변수 값
매개변수
defval(const string) 스크립트의 <unk> 설정/입입 <unk> 태그 페이지에서 제안된 입력 변수의 기본값을 결정하고, 사용자가 그것을 변경할 수 있다.options변수와 함께 사용할 때, 이 값은 둘 중 하나가 되어야 한다.title(const string) 입력의 제목。 지정되지 않은 경우, 변수의 이름을 입력의 제목으로 사용합니다。 제목이 지정되어 있지만 제목이 빈 경우, 이름은 빈 문자열이 됩니다。options(tuple of const string values: [val1, val2, ...]) 에서 선택할 수 있는 옵션 목록.tooltip(const string) 이 문자열은 마우스가 도구 제안 아이콘에 매달릴 때 사용자에게 표시됩니다.inline(const string) 한 줄에서 동일한 변수를 사용하여 모든 입력 호출을 통합한다. 변수로 사용되는 문자열을 표시하지 않는다. 그것은 단지 같은 줄에 속하는 입력을 식별하는 데 사용됩니다.group(const string) 모든 입력 위에 동일한 구성 요소 숫자 문자열을 사용하여 제목을 만듭니다. 이 문자열은 제목의 텍스트로도 사용됩니다.confirm(const bool) 만약 true라면, 지표가 그래프에 추가되기 전에 사용자가 입력값을 확인하도록 요청한다. 기본값은 false이다.
참고 사항
input.timeframe 함수의 결과는 항상 하나의 변수에 할당되어야 합니다. 위의 예시를 참조하십시오.
이 부분도 참조하십시오.
input.bool input.int input.float input.string input.source input.color input
input.integer
현재
input.resolution
현재
ta
ta.alma
Arnaud Legoux의 이동 평균. 그것은 가우스 분포를 이동 평균의 무게로 사용합니다.
ta.alma(series, length, offset, sigma)
ta.alma(series, length, offset, sigma, floor)
예를 들어
            pine

            plot(ta.alma(close, 9, 0.85, 6))

// same on pine, but much less efficient
pine_alma(series, windowsize, offset, sigma) =>
    m = offset * (windowsize - 1)
    //m = math.floor(offset * (windowsize - 1)) // Used as m when math.floor=true
    s = windowsize / sigma
    norm = 0.0
    sum = 0.0
    for i = 0 to windowsize - 1
        weight = math.exp(-1 * math.pow(i - m, 2) / (2 * math.pow(s, 2)))
        norm := norm + weight
        sum := sum + series[windowsize - i - 1] * weight
    sum / norm
plot(pine_alma(close, 9, 0.85, 6))
값을 반환합니다.
이동 평균 Arnaud Legoux
매개변수
series(series int/float) 실행중인 일련값length(series int) K 줄의 수 (연장).offset(simple int/float) 제어 매끄러움 ((더 가깝게 1) 와 반응성 ((더 가깝게 0) 사이의 균형sigma(simple int/float) ALMA의 매끄러움을 변화시킨다. SIGMA가 커질수록 ALMA는 더욱 매끄러진다.floor(simple bool) 선택 가능한 변수。 ALMA를 계산하기 전에, 편향량 계산이 하위 한계인지 지정하라。 기본값은 false。
이 부분도 참조하십시오.
ta.sma ta.ema ta.rma ta.wma ta.vwma ta.swma
ta.sma
sma 함수는 이동 평균값, 즉 x의 마지막 y값을 y로 나누어서 반환한다.
ta.sma(source, length)
예를 들어
            pine

            plot(ta.sma(close, 15))

// same on pine, but much less efficient
pine_sma(x, y) =>
    sum = 0.0
    for i = 0 to y - 1
        sum := sum + x[i] / y
    sum
plot(pine_sma(close, 15))
값을 반환합니다.
lengthK선으로 돌아온source간단한 이동 평균.
매개변수
source(series int/float) 실행중인 일련값length(series int) K 줄의 수 (연장).
이 부분도 참조하십시오.
ta.ema ta.rma ta.wma ta.vwma ta.swma ta.alma
ta.cog
cog (중심점) 은 통계학과 피보나치 황금 비율에 기초한 지표이다.
ta.cog(source, length)
예를 들어
            pine

            plot(ta.cog(close, 10))

// the same on pine
pine_cog(source, length) =>
    sum = math.sum(source, length)
    num = 0.0
    for i = 0 to length - 1
        price = source[i]
        num := num + price * (i + 1)
    -num / sum

plot(pine_cog(close, 10))
값을 반환합니다.
중심
매개변수
source(series int/float) 실행중인 일련값length(series int) K 줄의 수 (연장).
이 부분도 참조하십시오.
ta.stoch
ta.dev
측정 시리즈와 다른 ta.sma 사이의 차이
ta.dev(source, length)
예를 들어
            pine

            plot(ta.dev(close, 10))

// the same on pine
pine_dev(source, length) =>
    mean = ta.sma(source, length)
    sum = 0.0
    for i = 0 to length - 1
        val = source[i]
        sum := sum + math.abs(val - mean)
    dev = sum/length
plot(pine_dev(close, 10))
값을 반환합니다.
lengthK선으로 돌아온source왜곡
매개변수
source(series int/float) 실행중인 일련값length(series int) K 줄의 수 (연장).
이 부분도 참조하십시오.
ta.variance ta.stdev
ta.stdev
ta.stdev(source, length, biased)
예를 들어
            pine

            plot(ta.stdev(close, 5))

//the same on pine
isZero(val, eps) => math.abs(val) <= eps

SUM(fst, snd) =>
    EPS = 1e-10
    res = fst + snd
    if isZero(res, EPS)
        res := 0
    else
        if not isZero(res, 1e-4)
            res := res
        else
            15

pine_stdev(src, length) =>
    avg = ta.sma(src, length)
    sumOfSquareDeviations = 0.0
    for i = 0 to length - 1
        sum = SUM(src[i], -avg)
        sumOfSquareDeviations := sumOfSquareDeviations + sum * sum

    stdev = math.sqrt(sumOfSquareDeviations / length)
plot(pine_stdev(close, 5))
값을 반환합니다.
기준이 안 맞다
매개변수
source(series int/float) 실행중인 일련값length(series int) K 줄의 수 (연장).biased(series bool) 어떤 추정치를 사용해야 하는지 결정한다.
참고 사항
만약biased만약 true라면, 함수는 전체의 편향된 추정치를 사용하여 계산하고, 만약 false라면 - 샘플의 편향되지 않은 추정치를 사용하여 계산한다.
이 부분도 참조하십시오.
ta.dev ta.variance
ta.ema
ema 함수는 지수 가중 이동 평균을 반환한다. ema에서, 가중 인자는 지수 하락한다. 다음 공식을 사용하여 계산한다: EMA = alpha * source + (1 - alpha) * EMA[1], 여기서 alpha = 2 / (length + 1) ᅳ
ta.ema(source, length)
예를 들어
            pine

            plot(ta.ema(close, 15))

//the same on pine
pine_ema(src, length) =>
    alpha = 2 / (length + 1)
    sum = 0.0
    sum := na(sum[1]) ? src : alpha * src + (1 - alpha) * nz(sum[1])
plot(pine_ema(close,15))
값을 반환합니다.
source지수 이동 평균, alpha = 2 / (길이 + 1) <unk>
매개변수
source(series int/float) 실행중인 일련값length(simple int) K 줄의 수 ((길이).
참고 사항
이 변수/함수를 사용하면 지표가 다시 그려질 수 있습니다.
이 부분도 참조하십시오.
ta.sma ta.rma ta.wma ta.vwma ta.swma ta.alma
ta.wma
wma 함수 반환lengthK 선의source가중 이동 평균 △ wma에서 가중 인수는 수학적 계수로 감소 △
ta.wma(source, length)
예를 들어
            pine

            plot(ta.wma(close, 15))

// same on pine, but much less efficient
pine_wma(x, y) =>
    norm = 0.0
    sum = 0.0
    for i = 0 to y - 1
        weight = (y - i) * y
        norm := norm + weight
        sum := sum + x[i] * weight
    sum / norm
plot(pine_wma(close, 15))
값을 반환합니다.
lengthK선으로 돌아온source가중된 이동 평균
매개변수
source(series int/float) 실행중인 일련값length(series int) K 줄의 수 (연장).
이 부분도 참조하십시오.
ta.sma ta.ema ta.rma ta.vwma ta.swma ta.alma
ta.swma
고정 길이의 대칭 중화 이동 평균:4. 무게:[1/6,2 / 6,2 / 6,1 / 6]。
ta.swma(source)
예를 들어
            pine

            plot(ta.swma(close))

// same on pine, but less efficient
pine_swma(x) =>
    x[3] * 1 / 6 + x[2] * 2 / 6 + x[1] * 2 / 6 + x[0] * 1 / 6
plot(pine_swma(close))
값을 반환합니다.
대칭 가중 이동 평균.
매개변수
source(series int/float) 소스 시리즈。
이 부분도 참조하십시오.
ta.sma ta.ema ta.rma ta.wma ta.vwma ta.alma
ta.hma
hma 함수는 선체 이동 평균 HMA를 반환한다.
ta.hma(source, length)
예를 들어
            pine

            src = input(defval=close, title="Source")
length = input(defval=9, title="Length")
hmaBuildIn = ta.hma(src, length)
plot(hmaBuildIn, title="Hull MA", color=#674EA7)
값을 반환합니다.
Hull Moving Average를 반환합니다. Hull Moving Average를 반환합니다.
매개변수
source(series int/float) 실행중인 일련값length(simple int) K 줄의 수
이 부분도 참조하십시오.
ta.ema ta.rma ta.wma ta.vwma ta.sma
ta.rma
RSI에서 사용되는 이동 평균. 그것은 지수 가중 이동 평균이며, 알파 가중 값 = 1 / 길이.
ta.rma(source, length)
예를 들어
            pine

            plot(ta.rma(close, 15))

//the same on pine
pine_rma(src, length) =>
  alpha = 1/length
  sum = 0.0
  sum := na(sum[1]) ? ta.sma(src, length) : alpha * src + (1 - alpha) * nz(sum[1])
plot(pine_rma(close, 15))
값을 반환합니다.
source지수 이동 평균, 알파 = 1 /length。
매개변수
source(series int/float) 실행중인 일련값length(simple int) K 줄의 수 ((길이).
이 부분도 참조하십시오.
ta.sma ta.ema ta.wma ta.vwma ta.swma ta.alma ta.rsi
ta.rsi
상대 강도 지수.lengthK 온라인source위와 아래의 변화ta.rma()계산된
ta.rsi(source, length)
예를 들어
            pine

            plot(ta.rsi(close, 7))

// same on pine, but less efficient
pine_rsi(x, y) =>
    u = math.max(x - x[1], 0) // upward ta.change
    d = math.max(x[1] - x, 0) // downward ta.change
    rs = ta.rma(u, y) / ta.rma(d, y)
    res = 100 - 100 / (1 + rs)
    res

plot(pine_rsi(close, 7))
값을 반환합니다.
상대적으로 약한 지표 (RSI)
매개변수
source(series int/float) 실행중인 일련값length(simple int) K 줄의 수 ((길이).
이 부분도 참조하십시오.
ta.rma
ta.tsi
진짜 강점 지수. 그것은 금융 도구의 잠재적인 동력을 사용하는 이동 평균이다.
ta.tsi(source, short_length, long_length)
값을 반환합니다.
실제 강점 <unk> 범위[-1,1]의 값
매개변수
source(series int/float) 소스 시리즈。short_length(simple int) 짧은 길이。long_length(simple int) 긴 선의 길이는。
ta.roc
함수 roc (변화율) 가 나타납니다.source현재 값과source며칠 전length값 사이의 차이
다음 공식으로 계산합니다: 100 * change(src, length) / src[length]。
ta.roc(source, length)
값을 반환합니다.
lengthK선으로 돌아온source그 결과,
매개변수
source(series int/float) 실행중인 일련값length(series int) K 줄의 수 (연장).
ta.range
최소값과 최대값 사이의 차이를 반환한다.
ta.range(source, length)
값을 반환합니다.
일련의 최소값과 최대값 사이의 차이.
매개변수
source(series int/float) 실행중인 일련값length(series int) K 줄의 수 (연장).
ta.macd
MACD (마카드) 는 주식 가격 추세의 힘, 방향, 동력 및 지속 기간의 변화를 드러내야 한다.
ta.macd(source, fastlen, slowlen, siglen)
예를 들어
            pine

            [macdLine, signalLine, histLine] = ta.macd(close, 12, 26, 9)
plot(macdLine, color=color.blue)
plot(signalLine, color=color.orange)
plot(histLine, color=color.red, style=plot.style_histogram)
만약 하나의 값만 필요하다면, '_':
예를 들어
            pine

            [_, signalLine, _] = ta.macd(close, 12, 26, 9)
plot(signalLine, color=color.orange)
값을 반환합니다.
세 개의 MACD 시리즈의 모형: MACD 라인, 신호 라인, 직사각형 도표 라인.
매개변수
source(series int/float) 실행중인 일련값fastlen(simple int) 빠른 선 변수slowlen(simple int) 느린 길이 변수。siglen(simple int) 신호 길이 변수。
ta.mode
일련의 모드를 반환한다. 동일한 주파수를 가진 여러 값이 있다면 최소 값을 반환한다.
ta.mode(source, length)
값을 반환합니다.
일련의 모형
매개변수
source(series int/float) 실행중인 일련값length(series int) K 줄의 수 (연장).
ta.median
복귀 서열의 중위점
ta.median(source, length)
값을 반환합니다.
일련의 중소수.
매개변수
source(series int/float) 실행중인 일련값length(series int) K 줄의 수 (연장).
ta.linreg
선형 회귀 곡선. 사용자 정의 시간 동안 지정된 가격에 가장 잘 맞는 선. 이것은 최소 2 곱셈을 사용하여 계산된다. 이 함수의 결과는 다음과 같은 공식을 사용하여 계산된다: linreg = intercept + slope * (length - 1 - offset), 여기서 intercept 및 slope는 사용된다.source일련의 최소 2 곱하기 계산의 값
ta.linreg(source, length, offset)
값을 반환합니다.
선형 회귀 곡선
매개변수
source(series int/float) 소스 시리즈。length(series int)offset(simple int) 편향
ta.bb
브린 띠 (Brin's band) 는 기술 분석 도구로, 두 개의 표준 편차 (SMA) 와 증권 가격의 간단한 이동 평균 (SMA) 사이의 두 가지 표준 편차 (Positive and Negative) 로 정의되지만 사용자의 선호도에 따라 조정할 수 있습니다.
ta.bb(series, length, mult)
예를 들어
            pine

            [middle, upper, lower] = ta.bb(close, 5, 4)
plot(middle, color=color.yellow)
plot(upper, color=color.yellow)
plot(lower, color=color.yellow)

// the same on pine
f_bb(src, length, mult) =>
    float basis = ta.sma(src, length)
    float dev = mult * ta.stdev(src, length)
    [basis, basis + dev, basis - dev]

[pineMiddle, pineUpper, pineLower] = f_bb(close, 5, 4)

plot(pineMiddle)
plot(pineUpper)
plot(pineLower)
값을 반환합니다.
브린 벨트
매개변수
series(series int/float) 실행중인 일련값length(series int) K 줄의 수 (연장).mult(simple int/float) 표준 차기 인자
이 부분도 참조하십시오.
ta.sma ta.stdev ta.kc
ta.bbw
브린 대역의 너비 <unk> 브린 대역은 상철과 하철에서 중선까지의 거리이다.
ta.bbw(series, length, mult)
예를 들어
            pine

            plot(ta.bbw(close, 5, 4), color=color.yellow)

// the same on pine
f_bbw(src, length, mult) =>
    float basis = ta.sma(src, length)
    float dev = mult * ta.stdev(src, length)
    ((basis + dev) - (basis - dev)) / basis

plot(f_bbw(close, 5, 4))
값을 반환합니다.
브린 대역폭
매개변수
series(series int/float) 실행중인 일련값length(series int) K 줄의 수 (연장).mult(simple int/float) 표준 차기 인자
이 부분도 참조하십시오.
ta.bb ta.sma ta.stdev
ta.cci
CCI (상품 경로 지수) 의 계산 방법은 상품의 전형적인 가격과 그것의 간단한 이동 평균 사이의 차이를 전형적인 가격의 평균 절대 편차로 나누는 것이다. 이 지수는 0.015의 역으로 축소되어 더 많은 읽을 수 있는 숫자를 제공한다.
ta.cci(source, length)
값을 반환합니다.
lengthK 라인이 반환한 소스의 상품 채널 지수
매개변수
source(series int/float) 실행중인 일련값length(series int) K 줄의 수 (연장).
ta.change
현재 값과 이전 값 사이의 차이, source - source[length]。
ta.change(source, length)
ta.change(source)
값을 반환합니다.
법의 삭감 결과
매개변수
source(series int/float) 소스 시리즈。length(series int) 현재 k선에서 이전 k선으로 이동한다. length = 1 을 사용한다.
ta.mom
source가격과source가격lengthK선 전의 동력 <unk>. 이것은 단지 차분일 뿐입니다:source - source[length]。
ta.mom(source, length)
값을 반환합니다.
source가격과source가격lengthK선 전의 동력.
매개변수
source(series int/float) 실행중인 일련값length(series int) 현재 k선에서 이전 k선으로 이동한다.
이 부분도 참조하십시오.
ta.change
ta.cmo
<unk>드 동력 변동 지표. 최근 상승점의 수와 최근 하락점의 수를 합쳐, 그 둘을 빼고, 그 결과를 같은 기간 동안의 모든 가격 변동의 합으로 나눈다.
ta.cmo(series, length)
예를 들어
            pine

            plot(ta.cmo(close, 5), color=color.yellow)

// the same on pine
f_cmo(src, length) =>
    float mom = ta.change(src)
    float sm1 = math.sum((mom >= 0) ? mom : 0.0, length)
    float sm2 = math.sum((mom >= 0) ? 0.0 : -mom, length)
    100 * (sm1 - sm2) / (sm1 + sm2)

plot(f_cmo(close, 5))
값을 반환합니다.
<unk>드 동력 흔들림 지표
매개변수
series(series int/float) 실행중인 일련값length(series int) K 줄의 수 (연장).
이 부분도 참조하십시오.
ta.rsi ta.stoch math.sum
ta.percentile_linear_interpolation
최근 두 개의 순위 사이의 선형적 삽입값 방법을 사용하여 비율을 계산한다.
ta.percentile_linear_interpolation(source, length, percentage)
값을 반환합니다.
lengthK선으로 돌아온source일련의 P의 첫 번째 소수점.
매개변수
source(series int/float) 실행해야 하는 일련 값 ((원천) <unk>)length(series int) 지난 K 줄의 수 (연장)percentage(simple int/float) 비율, 0에서 100까지의 숫자
참고 사항
참고로, 이 방법을 사용하여 계산된 비율은 입력 데이터 집합의 모든 구성원이 아닙니다.
이 부분도 참조하십시오.
ta.percentile_nearest_rank
ta.percentile_nearest_rank
최근 순위 기준으로 계산된 비율
ta.percentile_nearest_rank(source, length, percentage)
값을 반환합니다.
lengthK선으로 돌아온source일련의 P의 첫 번째 소수점.
매개변수
source(series int/float) 실행해야 하는 일련 값 ((원천) <unk>)length(series int) 지난 K 줄의 수 (연장)percentage(simple int/float) 비율, 0에서 100까지의 숫자
참고 사항
지난 100k 선 길이보다 적은 최근 순서를 사용하는 것은 동일한 숫자를 여러 퍼센트 자리용으로 사용할 수 있다.
최근 순위법으로 계산된 비율은 입력 데이터 집합에 속한다.
100번째 백분점은 입력 데이터 세트의 최대 값으로 정의된다.
이 부분도 참조하십시오.
ta.percentile_linear_interpolation
ta.percentrank
백분율 등급은 이전 값이 주어진 일련의 현재 값보다 작거나 같다는 백분율이다.
ta.percentrank(source, length)
값을 반환합니다.
lengthK선으로 돌아온source% 순위 <unk>
매개변수
source(series int/float) 실행중인 일련값length(series int) K 줄의 수 (연장).
ta.variance
분차는 평균값에 대한 일련의 제곱 편차의 기대값 (ta.sma) 이며, 무공식적으로 평균값에 대한 일련의 숫자의 거리를 측정한다.
ta.variance(source, length, biased)
값을 반환합니다.
lengthK선으로 돌아온source이 차이는
매개변수
source(series int/float) 실행중인 일련값length(series int) K 줄의 수 (연장).biased(series bool) 어떤 추정치를 사용해야 하는지 결정한다.
참고 사항
만약biased만약 true라면, 함수는 전체의 편향된 추정치를 사용하여 계산하고, 만약 false라면 - 샘플의 편향되지 않은 추정치를 사용하여 계산한다.
ta.tr
ta.tr(handle_na)
값을 반환합니다.
실제 범위는 math.max (고등 - 낮은, math.abs (고등 - 가까운)[1]), math.abs(low - close[1]))。
매개변수
handle_na(simple bool) 가 NaN 값을 처리하는 방법. 만약 true이고, 전날의 종점값이 NaN이라면, tr는 그날의 하위-하위점으로 계산된다. 그렇지 않으면 (((만약 false이면) tr는 이 경우 NaN을 반환한다. 또한, ta.atr은 ta.tr ((true) 를 사용한다.
참고 사항
ta.tr(false)그리고ta.tr완전히 동일합니다.
이 부분도 참조하십시오.
ta.atr
ta.mfi
자금 흐름 지표. 자금 흐름 지표는 가격과 거래량을 사용하여 자산의 과매매 또는 과매매 상태를 결정하는 기술 지표입니다.
ta.mfi(series, length)
예를 들어
            pine

            plot(ta.mfi(hlc3, 14), color=color.yellow)

// the same on pine
pine_mfi(src, length) =>
    float upper = math.sum(volume * (ta.change(src) <= 0.0 ? 0.0 : src), length)
    float lower = math.sum(volume * (ta.change(src) >= 0.0 ? 0.0 : src), length)
    mfi = 100.0 - (100.0 / (1.0 + upper / lower))
    mfi

plot(pine_mfi(hlc3, 14))
값을 반환합니다.
자금 흐름 지표
매개변수
series(series int/float) 실행중인 일련값length(series int) K 줄의 수 (연장).
ta.kc
켄트나 통로. 켄트나 통로 (Kentna Channel) 는 중간에 있는 이동 평균과 궤도 상하의 통로를 포함하는 기술적 지표이다.
ta.kc(series, length, mult)
ta.kc(series, length, mult, useTrueRange)
예를 들어
            pine

            [middle, upper, lower] = ta.kc(close, 5, 4)
plot(middle, color=color.yellow)
plot(upper, color=color.yellow)
plot(lower, color=color.yellow)


// the same on pine
f_kc(src, length, mult, useTrueRange) =>
    float basis = ta.ema(src, length)
    float span = (useTrueRange) ? ta.tr : (high - low)
    float rangeEma = ta.ema(span, length)
    [basis, basis + rangeEma * mult, basis - rangeEma * mult]

[pineMiddle, pineUpper, pineLower] = f_kc(close, 5, 4, true)

plot(pineMiddle)
plot(pineUpper)
plot(pineLower)
값을 반환합니다.
켄터 통로
매개변수
series(series int/float) 실행중인 일련값length(simple int) K 줄의 수 ((길이).mult(simple int/float) 표준 차기 인자useTrueRange(simple bool) 선택 가능한 변수。 실제 범위를 사용할지 여부를 지정한다; 기본값은 true。 값이 false라면, 표현식 ((high-low) 을 사용하여 범위를 계산한다。
이 부분도 참조하십시오.
ta.ema ta.atr ta.bb
ta.kcw
켄터 통로 너비. 켄터 통로 너비 는 위, 아래 통로 사이의 차이를 중간 통로의 값으로 나누는 것이다.
ta.kcw(series, length, mult)
ta.kcw(series, length, mult, useTrueRange)
예를 들어
            pine

            plot(ta.kcw(close, 5, 4), color=color.yellow)

// the same on pine
f_kcw(src, length, mult, useTrueRange) =>
    float basis = ta.ema(src, length)
    float span = (useTrueRange) ? ta.tr : (high - low)
    float rangeEma = ta.ema(span, length)

    ((basis + rangeEma * mult) - (basis - rangeEma * mult)) / basis

plot(f_kcw(close, 5, 4, true))
값을 반환합니다.
켄타나 통로 너비.
매개변수
series(series int/float) 실행중인 일련값length(simple int) K 줄의 수 ((길이).mult(simple int/float) 표준 차기 인자useTrueRange(simple bool) 선택 가능한 변수。 실제 범위를 사용할지 여부를 지정한다; 기본값은 true。 값이 false라면, 표현식 ((high-low) 을 사용하여 범위를 계산한다。
이 부분도 참조하십시오.
ta.kc ta.ema ta.atr ta.bb
ta.correlation
관련 계수는 두 계열이 그들의 ta.sma 값에서 얼마나 멀리 떨어져 있는지를 설명한다.
ta.correlation(source1, source2, length)
값을 반환합니다.
관련 계수
매개변수
source1(series int/float) 소스 시리즈。source2(series int/float) 목표 시리즈length(series int) 길이 (K 줄 수)
이 부분도 참조하십시오.
request.security
ta.cross
ta.cross(source1, source2)
값을 반환합니다.
두 행이 서로 교차하면 true이고, 그렇지 않으면 false이다.
매개변수
source1(series int/float) 첫 번째 데이터 시리즈。source2(series int/float) 두 번째 데이터 시리즈。
이 부분도 참조하십시오.
ta.change
ta.crossover
source1-series는source2-series, 현재 K 라인에서,source1이 값은source2그리고 첫 번째 K선에는source2source1의 값小于source2`값은
ta.crossover(source1, source2)
값을 반환합니다.
만약source1통과source2이 값은 true이고, false입니다.
매개변수
source1(series int/float) 첫 번째 데이터 시리즈。source2(series int/float) 두 번째 데이터 시리즈。
ta.crossunder
source1-series는source2-series 아래에서 교차하면, 현재 K선에서,source1이 값은source2그리고 K 선에서,source1이 값은source2값은
ta.crossunder(source1, source2)
값을 반환합니다.
만약source1존재하다source2아래로 괄호를 붙이면 true이고, 그렇지 않으면 false입니다.
매개변수
source1(series int/float) 첫 번째 데이터 시리즈。source2(series int/float) 두 번째 데이터 시리즈。
ta.atr
함수 ATR ((진실 진폭 평균) 는 실제 범위의 RMA를 반환한다. 실제 진폭은 max ((high - low, abs ((high - close[1]), abs(low - close[1]))。
ta.atr(length)
예를 들어
            pine

            plot(ta.atr(14))

//the same on pine
pine_atr(length) =>
    trueRange = na(high[1])? high-low : math.max(math.max(high - low, math.abs(high - close[1])), math.abs(low - close[1]))
    //true range can be also calculated with ta.tr(true)
    ta.rma(trueRange, length)

plot(pine_atr(14))
값을 반환합니다.
실제 변동의 평균값 (ATR)
매개변수
length (simple int) 길이 (K 줄 수)
ta.sar
패러블리 회전 (Parallel line shift, 영어: parabolic line stopping and reversal) 은 J. Welles Wilder, Jr.가 트레이딩 시장의 가격 방향의 잠재적인 역전을 찾기 위해 고안한 방법이다.
ta.sar(start, inc, max)
예를 들어
            pine

            plot(ta.sar(0.02, 0.02, 0.2), style=plot.style_cross, linewidth=3)

// The same on Pine
pine_sar(start, inc, max) =>
  var float result = na
  var float maxMin = na
  var float acceleration = na
  var bool isBelow = na
  bool isFirstTrendBar = false

  if bar_index == 1
    if close > close[1]
      isBelow := true
      maxMin := high
      result := low[1]
    else
      isBelow := false
      maxMin := low
      result := high[1]
    isFirstTrendBar := true
    acceleration := start

  result := result + acceleration * (maxMin - result)

  if isBelow
    if result > low
      isFirstTrendBar := true
      isBelow := false
      result := math.max(high, maxMin)
      maxMin := low
      acceleration := start
  else
    if result < high
      isFirstTrendBar := true
      isBelow := true
      result := math.min(low, maxMin)
      maxMin := high
      acceleration := start

  if not isFirstTrendBar
    if isBelow
      if high > maxMin
        maxMin := high
        acceleration := math.min(acceleration + inc, max)
    else
      if low < maxMin
        maxMin := low
        acceleration := math.min(acceleration + inc, max)

  if isBelow
    result := math.min(result, low[1])
    if bar_index > 1
      result := math.min(result, low[2])

  else
    result := math.max(result, high[1])
    if bar_index > 1
      result := math.max(result, high[2])

  result

plot(pine_sar(0.02, 0.02, 0.2), style=plot.style_cross, linewidth=3)
값을 반환합니다.
패러폴리선은 지표로 향한다.
매개변수
start(simple int/float) 이 시작된다.inc(simple int/float) 추가max(simple int/float) 최대
ta.barssince
마지막 조건이 true인 상태에서 K선 수를 계산한다.
ta.barssince(condition)
예를 들어
            pine

            // get number of bars since last color.green bar
plot(ta.barssince(close >= open))
값을 반환합니다.
조건이 true인 경우 k줄의 수
참고 사항
만약 현재 K선 이전에 이 조건이 충족되지 않았다면, 이 함수는 na。를 반환한다.
이 변수/함수를 사용하면 지표가 다시 그려질 수 있습니다.
이 부분도 참조하십시오.
ta.lowestbars ta.highestbars ta.valuewhen ta.highest ta.lowest
ta.cum
source<unk>의 집적 (<unk>의 총) <unk>, 즉,source<unk>의 모든 원소들의 합
ta.cum(source)
값을 반환합니다.
시리즈 종합
매개변수
source(series int/float)
이 부분도 참조하십시오.
math.sum
ta.dmi
dmi 함수는 동향 지수 DMI。를 반환한다.
ta.dmi(diLength, adxSmoothing)
예를 들어
            pine

            len = input.int(17, minval=1, title="DI Length")
lensig = input.int(14, title="ADX Smoothing", minval=1, maxval=50)
[diplus, diminus, adx] = ta.dmi(len, lensig)
plot(adx, color=color.red, title="ADX")
plot(diplus, color=color.blue, title="+DI")
plot(diminus, color=color.orange, title="-DI")
값을 반환합니다.
세 개의 DMI 시리즈의 모형: 긍정 방향 운동 ((+DI), 부정 방향 운동 ((-DI) 및 평균 방향 운동 지수 ((ADX) <unk>.
매개변수
diLength(simple int) DI Period。adxSmoothing(simple int) ADX 부드러운 주기
이 부분도 참조하십시오.
ta.rsi ta.tsi ta.mfi
ta.falling
테스트source시리즈는lengthK-Line가 떨어지는지.
ta.falling(source, length)
값을 반환합니다.
만약 현재source<unk>보다 작습니다lengthK 선이 반환하는 모든 이전source값은 true이고, 그렇지 않으면 false입니다.
매개변수
source(series int/float) 실행중인 일련값length(series int) K 줄의 수 (연장).
이 부분도 참조하십시오.
ta.rising
ta.rising
테스트source시리즈는lengthK-Line가 올라가고 있는지.
ta.rising(source, length)
값을 반환합니다.
만약 현재source그보다 더 가치있는 것은lengthK 선이 반환하는 모든 이전source값은 true이고, 그렇지 않으면 false입니다.
매개변수
source(series int/float) 실행중인 일련값length(series int) K 줄의 수 (연장).
이 부분도 참조하십시오.
ta.falling
ta.pivothigh
이 함수는 축의 높이의 값을 반환한다. 만약 축의 높이가 없다면, NaN<unk>을 반환한다.
ta.pivothigh(source, leftbars, rightbars)
ta.pivothigh(leftbars, rightbars)
예를 들어
            pine

            leftBars = input(2)
rightBars=input(2)
ph = ta.pivothigh(leftBars, rightBars)
plot(ph, style=plot.style_cross, linewidth=3, color= color.red, offset=-rightBars)
값을 반환합니다.
이 지점의 가격은 NaN입니다.
매개변수
source(series int/float) 선택 가능한 파라미터。 데이터 시리즈 계산 값。 기본값은 'High'。leftbars(series int/float) 왼쪽 힘rightbars(series int/float) 오른쪽 길이
참고 사항
만약 arguments 'leftbars' 또는 'rightbars'가 시리즈라면 max_bars_back 함수를 'source' 변수로 사용해야 한다.
ta.pivotlow
이 함수는 축축 하위점의 값을 반환한다. 만약 축축 하위점이 없다면, 그것은 NaN<unk>을 반환한다.
ta.pivotlow(source, leftbars, rightbars)
ta.pivotlow(leftbars, rightbars)
예를 들어
            pine

            leftBars = input(2)
rightBars=input(2)
pl = ta.pivotlow(close, leftBars, rightBars)
plot(pl, style=plot.style_cross, linewidth=3, color= color.blue, offset=-rightBars)
값을 반환합니다.
이 지점의 가격은 NaN입니다.
매개변수
source(series int/float) 선택 가능한 변수。 데이터 시리즈 계산 값。 기본은 <unk>Low<unk>。leftbars(series int/float) 왼쪽 힘rightbars(series int/float) 오른쪽 길이
참고 사항
만약 arguments 'leftbars' 또는 'rightbars'가 시리즈라면 max_bars_back 함수를 'source' 변수로 사용해야 한다.
ta.highest
지난 k줄의 주어진 숫자의 최대값
ta.highest(source, length)
ta.highest(length)
값을 반환합니다.
일련의 최대 값
매개변수
source(series int/float) 실행중인 일련값length(series int) K 줄의 수 (연장).
참고 사항
두 가지 args 버전:source"이런 일이 벌어진다면,lengthK선수입니다
이 글의 arg 버전입니다.length△ (k) 는 return의 K선수이다.source시리즈
이 부분도 참조하십시오.
ta.lowest ta.lowestbars ta.highestbars ta.valuewhen ta.barssince
ta.highestbars
지난 k선에서 주어진 수의 최대값의 오차
ta.highestbars(source, length)
ta.highestbars(length)
값을 반환합니다.
가장 높은 k선으로 이동
매개변수
source(series int/float) 실행중인 일련값length(series int) K 줄의 수 (연장).
참고 사항
두 가지 args 버전:source"이런 일이 벌어진다면,lengthK선수입니다
이 글의 arg 버전입니다.length△ (k) 는 return의 K선수이다.source시리즈
이 부분도 참조하십시오.
ta.lowest ta.highest ta.lowestbars ta.barssince ta.valuewhen
ta.stoch
무작위 지표. 계산 방정식:100 * (close - lowest, length)) / (highest, high, length) - lowest, length))
ta.stoch(source, high, low, length)
값을 반환합니다.
무작위
매개변수
source(series int/float) 소스 시리즈。high(series int/float) 고 시리즈low(series int/float) 하위 시리즈length(series int) 길이 (K 줄 수)
이 부분도 참조하십시오.
ta.cog
ta.supertrend
슈퍼 트렌드 지표. 슈퍼 트렌드 지표는 트렌드를 따르는 지표이다.
ta.supertrend(factor, atrPeriod)
예를 들어
            pine

            //@version=5
indicator("Pine Script™ Supertrend")

[supertrend, direction] = ta.supertrend(3, 10)
plot(direction < 0 ? supertrend : na, "Up direction", color = color.green, style=plot.style_linebr)
plot(direction > 0 ? supertrend : na, "Down direction", color = color.red, style=plot.style_linebr)

// The same on Pine Script™
pine_supertrend(factor, atrPeriod) =>
  src = hl2
  atr = ta.atr(atrPeriod)
  upperBand = src + factor * atr
  lowerBand = src - factor * atr
  prevLowerBand = nz(lowerBand[1])
  prevUpperBand = nz(upperBand[1])

  lowerBand := lowerBand > prevLowerBand or close[1] < prevLowerBand ? lowerBand : prevLowerBand
  upperBand := upperBand < prevUpperBand or close[1] > prevUpperBand ? upperBand : prevUpperBand
  int direction = na
  float superTrend = na
  prevSuperTrend = superTrend[1]
  if na(atr[1])
    direction := 1
  else if prevSuperTrend == prevUpperBand
    direction := close > upperBand ? -1 : 1
  else
    direction := close < lowerBand ? 1 : -1
  superTrend := direction == -1 ? lowerBand : upperBand
  [superTrend, direction]

[pineSupertrend, pineDirection] = pine_supertrend(3, 10)
plot(pineDirection < 0 ? pineSupertrend : na, "Up direction", color = color.green, style=plot.style_linebr)
plot(pineDirection > 0 ? pineSupertrend : na, "Down direction", color = color.red, style=plot.style_linebr)
값을 반환합니다.
두 개의 초상향 계열의 소수: 초상향선과 경향 방향. 가능한 값은 1 (내향) 과 -1 (상향) 이다.
매개변수
factor(series int/float) ATR은 곱하기 곱하기atrPeriod(simple int) 평균 실제 파장 길
이 부분도 참조하십시오.
ta.macd
ta.lowest
지난 k줄의 주어진 숫자의 최소값
ta.lowest(source, length)
ta.lowest(length)
값을 반환합니다.
일련의 최소값
매개변수
source(series int/float) 실행중인 일련값length(series int) K 줄의 수 (연장).
참고 사항
두 가지 args 버전:source"이런 일이 벌어진다면,lengthK선수입니다
이 글의 arg 버전입니다.length복귀된 K선수이다. 알고리즘은 low를source시리즈
이 부분도 참조하십시오.
ta.highest ta.lowestbars ta.highestbars ta.valuewhen ta.barssince
ta.lowestbars
지난 k선에서 주어진 수의 최소값의 편차.
ta.lowestbars(source, length)
ta.lowestbars(length)
값을 반환합니다.
가장 낮은 k선으로 이동한다.
매개변수
source(series int/float) 실행중인 일련값length(series int) 는 K선수를 반환한다.
참고 사항
두 가지 args 버전:source"이런 일이 벌어진다면,lengthK선수입니다
이 글의 arg 버전입니다.length복귀된 K선수이다. 알고리즘은 low를source시리즈
이 부분도 참조하십시오.
ta.lowest ta.highest ta.highestbars ta.barssince ta.valuewhen
ta.valuewhen
n번째 가장 최근에 나타난 <unk>condition <unk>가 true인 K선에서 <unk>source <unk> 시리즈 값을 반환한다.
ta.valuewhen(condition, source, occurrence)
예를 들어
            pine

            slow = ta.sma(close, 7)
fast = ta.sma(close, 14)
// Get value of `close` on second most recent cross
plot(ta.valuewhen(ta.cross(slow, fast), close, 1))
매개변수
condition(series bool) 검색해야 할 조건source(series int/float/bool/color) 조건이 충족된 K선에서 반환되는 값occurrence(simple int) 조건의 출현。 번호는 0에서 시작하여 시간적으로 거슬러 올라간다. 따라서 0<unk>은 가장 최근에 출현한 condition<unk>이고, 1<unk>은 가장 최근에 출현한 두 번째 condition<unk>이다. 따라서 。는 <= 0。의 정수여야 한다.
참고 사항
이 기능은 K줄마다 수행되어야 합니다. for 또는 while 루프 구조에서 사용하는 것은 권장되지 않습니다. 왜냐하면, 그 동작이 예상치 못한 것일 수 있기 때문입니다. 이 기능을 사용하면 지표가 다시 그려질 수 있으므로 주의하십시오.
이 부분도 참조하십시오.
ta.lowestbars ta.highestbars ta.barssince ta.highest ta.lowest
ta.vwap
수량 가중 평균 가격
ta.vwap(source)
값을 반환합니다.
매출 중화 평균
매개변수
source(series int/float) 소스 시리즈。
이 부분도 참조하십시오.
ta.vwap
ta.vwma
vwma 함수가 반환됩니다.lengthK 선의source트랜잭션량 가중 이동 평균 △는: sma ((source * volume, length) / sma ((volume, length) △과 같다.
ta.vwma(source, length)
예를 들어
            pine

            plot(ta.vwma(close, 15))

// same on pine, but less efficient
pine_vwma(x, y) =>
    ta.sma(x * volume, y) / ta.sma(volume, y)
plot(pine_vwma(close, 15))
값을 반환합니다.
lengthK선으로 돌아온source거래량 가중 이동 평균
매개변수
source(series int/float) 실행중인 일련값length(series int) K 줄의 수 (연장).
이 부분도 참조하십시오.
ta.sma ta.ema ta.rma ta.wma ta.swma ta.alma
ta.wpr
윌리엄스 지표 (Williams %R。。) 는 현재의 종전 가격과 과거 한 시간 동안의 높은/저한 가격 사이의 관계를 보여주는 변동 지표이다。
ta.wpr(length)
예를 들어
            pine

            plot(ta.wpr(14), title="%R", color=color.new(#ff6d00, 0))
값을 반환합니다.
Williams %R。
매개변수
length(series int) K 줄의 수
plot
plot
그래프에 일련의 데이터를 그려보세요.
plot(series, title, color, linewidth, style, trackprice, histbase, offset, join, editable, show_last, display)
예를 들어
            pine

            plot(high+low, title='Title', color=color.new(#00ffaa, 70), linewidth=2, style=plot.style_area, offset=15, trackprice=true)

// You may fill the background between any two plots with a fill() function:
p1 = plot(open)
p2 = plot(close)
fill(p1, p2, color=color.new(color.green, 90))
값을 반환합니다.
fill을 사용할 수 있는 그림 객체들.
매개변수
series(series int/float) 그리기 위해 필요한 데이터 시리즈.title[const string] 그림 제목color(series color) 그림의 색. 'color = red' 또는 'color =#ff001a'와 같은 상수를 사용할 수 있고 'color = close >= open ? green: red'와 같은 복잡한 표현을 사용할 수 있습니다.linewidth(input int) 그리기 선의 너비。 기본값은 1。 모든 스타일에 적용되지 않는다。style(plot_style) plot 타입。 가능한 값은: plot.style_line、plot.style_stepline、plot.style_stepline_diamond、plot.style_histogram、plot.style_cross、plot.style_area、plot.style_columns、plot.style_circles、plot.style_linebr、plot.style_areabr。 기본값은 plot.style_line。trackprice(input bool) 만약 true라면, 수평 가격선은 마지막 지표값의 레벨에서 표시됩니다.histbase(input int/float) plot.style_histogram,plot.style_columns 또는 plot.style_area 스타일로 지도를 그리면, 참조 레벨의 값값으로 사용한다. 기본값은 0.0이다.offset(series int) 특정 수의 k선 위에 왼쪽 또는 오른쪽으로 이동하는 그림. 0을 기본으로 설정한다.join(input bool) 만약 true라면, 그리기 포인트는 선과 연결된다. plot.style_cross와 plot.style_circles 스타일에서만 적용된다.editable(const bool) 만약 true라면, 그리기 스타일은 포맷 대화 상자에서 편집할 수 있다.show_last(input int) 만약 설정되어 있다면, 그래프에 그려진 k선 수를 정의한다.display(plot_display) 제어 그림의 위치를 표시한다. 가능한 값은: display.none, display.all。 기본 값은 display.all。overlay(const bool) FMZ 플랫폼 확장된 파라미터, 현재 함수를 설정하는 데 사용된다. 현재 함수가 메인 그래프 (설정 true) 또는 부그라프 (설정 false) 에 그림으로 표시되며, 기본값은 false이다. 이 파라미터를 지정하지 않으면 다음과 같이 나타납니다.strategy또는indicator~ 안에overlay이 문서를 클릭하면strategy또는indicator설정이 없습니다.overlay변수, 기본 변수대로 처리한다.
이 부분도 참조하십시오.
plotshape plotchar bgcolor
plotshape
그래프에 가시적인 모양을 그리기
plotshape(series, title, style, location, color, offset, text, textcolor, editable, size, show_last, display)
예를 들어
            pine

            data = close >= open
plotshape(data, style=shape.xcross)
매개변수
series(series bool) 모양으로 그려진 일련의 데이터 ᄒ. location.absolute를 제외한 모든 위치값의 bool값의 일련으로 간주되는 일련 ᄂ. 필수 변수 ᄂ.title[const string] 그림 제목style(input string) 그리기 유형 △ 가능한 값은: shape.xcross, shape.cross, shape.triangleup, shape.triangledown, shape.flag, shape.circle, shape.arrowup, shape.arrowdown, shape.labelup, shape.labeldown, shape.square, shape.diamond △ 기본 값은 shape.xcross △location(input string) 형태는 차트 상의 위치 ᄒ. 가능한 값은: location.abovebar, location.belowbar, location.top, location.bottom, location.absolute ᄂ. 기본값은 location.abovebar ᄂ.color(series color) 모양의 색. 'color = red' 또는 'color =#ff001a'와 같은 상수를 사용할 수 있고 'color = close >= open ? green: red'와 같은 복잡한 표현을 사용할 수 있습니다.offset(series int) k줄의 특정 수에 좌우로 이동하는 모양. 0을 기본으로 설정한다.text(const string) 문자는 모양으로 표시한다. '\n' 변환 시퀀스를 사용하여 문자를 분할할 수 있다. 예: 'line one\nline two'textcolor(series color) 글자의 색. 'textcolor=red' 또는 'textcolor=#ff001a'와 같은 상수를 사용할 수 있고, 'textcolor = close >= open ? green: red'와 같은 복잡한 표현을 사용할 수 있습니다.editable(const bool) 만약 true라면, plotshape 스타일은 포맷 대화 상자에서 편집할 수 있다.show_last(input int) 만약 설정되어 있다면, 그래프에 그려지는 모양의 수를 정의한다 ((마지막 k선에서 과거로 돌아간다) <unk>)size(const string) 도표 상의 문자 크기 △ 가능한 값은: size.auto, size.tiny, size.small, size.normal, size.large, size.huge △ 기본 값은 size.auto △display(plot_display) 제어 그림의 위치를 표시한다. 가능한 값은: display.none, display.all。 기본 값은 display.all。overlay(const bool) FMZ 플랫폼 확장된 파라미터, 현재 함수를 설정하는 데 사용된다. 현재 함수가 메인 그래프 (설정 true) 또는 부그라프 (설정 false) 에 그림으로 표시되며, 기본값은 false이다. 이 파라미터를 지정하지 않으면 다음과 같이 나타납니다.strategy또는indicator~ 안에overlay이 문서를 클릭하면strategy또는indicator설정이 없습니다.overlay변수, 기본 변수대로 처리한다.
이 부분도 참조하십시오.
plot plotchar bgcolor
plotchar
그래프에서 주어진 유니코드 문자를 사용하여 시각적인 모양을 그리기 <unk>
plotchar(series, title, char, location, color, offset, text, textcolor, editable, size, show_last, display)
예를 들어
            pine

            data = close >= open
plotchar(data, char='❄')
매개변수
series(series bool) 모양으로 그려진 일련의 데이터 ᄒ. location.absolute를 제외한 모든 위치값의 bool값의 일련으로 간주되는 일련 ᄂ. 필수 변수 ᄂ.title[const string] 그림 제목char(input string) 시각적인 모양으로 사용되는 문자location(input string) 형태는 차트 상의 위치 ᄒ. 가능한 값은: location.abovebar, location.belowbar, location.top, location.bottom, location.absolute ᄂ. 기본값은 location.abovebar ᄂ.color(series color) 모양의 색. 'color = red' 또는 'color =#ff001a'와 같은 상수를 사용할 수 있고 'color = close >= open ? green: red'와 같은 복잡한 표현을 사용할 수 있습니다.offset(series int) k줄의 특정 수에 좌우로 이동하는 모양. 0을 기본으로 설정한다.text(const string) 문자는 모양으로 표시한다. '\n' 변환 시퀀스를 사용하여 문자를 분할할 수 있다. 예: 'line one\nline two'textcolor(series color) 글자의 색. 'textcolor=red' 또는 'textcolor=#ff001a'와 같은 상수를 사용할 수 있고, 'textcolor = close >= open ? green: red'와 같은 복잡한 표현을 사용할 수 있습니다.editable(const bool) 만약 true라면, plotchar 스타일은 포맷 대화 상자에서 편집할 수 있다.show_last(input int) 만약 설정되어 있다면, 그래프에 그려지는 그래프 수를 정의합니다.size(const string) 도표 상의 문자 크기 △ 가능한 값은:size.auto,size.tiny,size.small,size.normal,size.large,size.huge △ 기본 값은size.auto △display(plot_display) 제어 그림의 위치를 표시한다. 가능한 값은: display.none, display.all。 기본 값은 display.all。overlay(const bool) FMZ 플랫폼 확장된 파라미터, 현재 함수를 설정하는 데 사용된다. 현재 함수가 메인 그래프 (설정 true) 또는 부그라프 (설정 false) 에 그림으로 표시되며, 기본값은 false이다. 이 파라미터를 지정하지 않으면 다음과 같이 나타납니다.strategy또는indicator~ 안에overlay이 문서를 클릭하면strategy또는indicator설정이 없습니다.overlay변수, 기본 변수대로 처리한다.
이 부분도 참조하십시오.
plot plotshape bgcolor
plotcandle
<unk>을 도표에 그려보세요.
plotcandle(open, high, low, close, title, color, wickcolor, editable, show_last, bordercolor, display)
예를 들어
            pine

            indicator("plotcandle example", overlay=true)
plotcandle(open, high, low, close, title='Title', color = open < close ? color.green : color.red, wickcolor=color.black)
매개변수
open(series int/float) 데이터 오픈 시리즈는 <unk> 오픈 값으로 사용된다.high(series int/float) 하이 시리즈 데이터의 <unk>값은 높습니다.low(series int/float) 낮은 시리즈 데이터는 <unk>의 낮은 값으로 사용된다.close(series int/float) 닫는 일련의 데이터를 닫는 k 라인의 값으로 <unk>. 필요한 변수 <unk>.title(const string) plotcandle의 제목。 선택 가능한 파라미터。color(series color) <unk>의 색상。 'color = red' 또는 'color =#ff001a'와 같은 상수를 사용할 수 있고, 'color = close >= open ? green: red'와 같은 복잡한 표현을 사용할 수 있습니다。 선택 가능한 변수。wickcolor(series color) <unk> 빛의 색. 하나의 선택 가능한 파라미터.editable(const bool) 만약 true라면, plotcandle 스타일은 포맷 대화 상자에서 편집할 수 있다.show_last(input int) 만약 설정되어 있다면, 그래프에 그려진 <unk>수를 정의합니다.bordercolor(series color) <unk>의 경계 색. 하나의 선택 가능한 파라미터.display(plot_display) 제어 그림의 위치를 표시한다. 가능한 값은: display.none, display.all。 기본 값은 display.all。overlay(const bool) FMZ 플랫폼 확장된 파라미터, 현재 함수를 설정하는 데 사용된다. 현재 함수가 메인 그래프 (설정 true) 또는 부그라프 (설정 false) 에 그림으로 표시되며, 기본값은 false이다. 이 파라미터를 지정하지 않으면 다음과 같이 나타납니다.strategy또는indicator~ 안에overlay이 문서를 클릭하면strategy또는indicator설정이 없습니다.overlay변수, 기본 변수대로 처리한다.
참고 사항
만약 NaN이 전부라면 K선은 표시될 필요가 없습니다.
열고, 높고, 낮고, 닫고의 최대값은 높고, 낮은 값은 낮고, 낮은 값으로 설정됩니다.
이 부분도 참조하십시오.
plotbar
plotarrow
그래프에서 위와 아래로 화살표를 그리기: 위 화살표는 각 긍정적 인 지표에 그려지고 아래로 화살표는 각 부정적 인 값에 그려집니다. 지표가 na를 반환하면 화살표가 그려지지 않습니다. 화살표는 다른 높이를 가지고 있으며 지표의 절대값이 클수록 화살표가 길어집니다.
plotarrow(series, title, colorup, colordown, offset, minheight, maxheight, editable, show_last, display)
예를 들어
            codiff = close - open
plotarrow(codiff, colorup=color.new(color.teal,40), colordown=color.new(color.orange, 40), overlay=true)
매개변수
series(series int/float) 화살표로 그리는 데이터 시리즈 ᄒ. 필요한 파라미트 ᄂ.title[const string] 그림 제목colorup(series color) 위아래 화살표의 색. 선택 가능한 파라미터.colordown(series color) 아래로 향하는 화살표의 색.offset(series int) 특정 수의 K 라인에서 왼쪽 또는 오른쪽으로 화살표를 이동하십시오. 0을 기본으로 설정합니다.minheight(input int) 픽셀 단위로 가능한 최소 화살표 높이는 <unk>. 기본값은 5 <unk>.maxheight(input int) 픽셀 단위로 가능한 최대 화살표 높이. 기본값은 100editable(const bool) 만약 true라면, plotarrow 스타일은 포맷 대화 상자에서 편집할 수 있다.show_last(input int) 만약 설정되어 있다면, 그래프에 그려지는 화살의 수를 정의합니다.display(plot_display) 제어 그림의 위치를 표시한다. 가능한 값은: display.none, display.all。 기본 값은 display.all。overlay(const bool) FMZ 플랫폼 확장된 파라미터, 현재 함수를 설정하는 데 사용된다. 현재 함수가 메인 그래프 (설정 true) 또는 부그라프 (설정 false) 에 그림으로 표시되며, 기본값은 false이다. 이 파라미터를 지정하지 않으면 다음과 같이 나타납니다.strategy또는indicator~ 안에overlay이 문서를 클릭하면strategy또는indicator설정이 없습니다.overlay변수, 기본 변수대로 처리한다.
이 부분도 참조하십시오.
plot plotshape plotchar barcolor bgcolor
array
array.pop
이 함수는 배열에서 마지막 요소를 삭제하고 그 값을 반환한다.
array.pop(id)
예를 들어
            pine

            // array.pop example
a = array.new_float(5,high)
removedEl = array.pop(a)
plot(array.size(a))
plot(removedEl)
값을 반환합니다.
삭제된 요소의 값
매개변수
id(any array type) 배열 객체
이 부분도 참조하십시오.
array.new_float array.set array.push array.remove array.insert array.shift
array.shift
이 함수는 배열의 첫 번째 요소를 삭제하고 그 값을 반환한다.
array.shift(id)
예를 들어
            pine

            // array.shift example
a = array.new_float(5,high)
removedEl = array.shift(a)
plot(array.size(a))
plot(removedEl)
값을 반환합니다.
삭제된 요소의 값
매개변수
id(any array type) 배열 객체
이 부분도 참조하십시오.
array.unshift array.set array.push array.remove array.includes
array.unshift
이 함수는 값을 배열의 초기 위치에 삽입한다.
array.unshift(id, value)
예를 들어
            pine

            // array.unshift example
a = array.new_float(5, 0)
array.unshift(a, open)
plot(array.get(a, 0))
매개변수
id(any array type) 배열 객체value(series <type of the array's elements>) 는 배열의 초기 위치의 값에 추가됩니다.
이 부분도 참조하십시오.
array.shift array.set array.insert array.remove array.indexof
array.size
이 함수는 배열의 원소 수를 반환한다.
array.size(id)
예를 들어
            pine

            // array.size example
a = array.new_float(0)
for i = 0 to 9
    array.push(a, close[i])
// note that changes in slice also modify original array
slice = array.slice(a, 0, 5)
array.push(slice, open)
// size was changed in slice and in original array
plot(array.size(a))
plot(array.size(slice))
값을 반환합니다.
배열의 원소 수
매개변수
id(any array type) 배열 객체
이 부분도 참조하십시오.
array.new_float array.sum array.slice array.sort
array.slice
이 함수는 기존의 배열에서 조각을 만듭니다. 만약 조각의 객체에 변화가 생기면, 그 변화는 새 배열과 원래 배열에 동시에 적용됩니다.
array.slice(id, index_from, index_to)
예를 들어
            pine

            // array.slice example
a = array.new_float(0)
for i = 0 to 9
    array.push(a, close[i])
// take elements from 0 to 4
// *note that changes in slice also modify original array
slice = array.slice(a, 0, 5)
plot(array.sum(a) / 10)
plot(array.sum(slice) / 5)
값을 반환합니다.
배열 조각의 초록 사본.
매개변수
id(any array type) 배열 객체index_from(series int) 0부터 시작되는 인덱스부터 추출하기index_to(series int) 0에서 시작하는 인덱스는 추출이 완료되기 전에 <unk>. 이 함수는 이 인덱스 이전의 요소를 추출한다.
이 부분도 참조하십시오.
array.new_float array.get array.sort
array.abs
원래 배열의 각 요소의 절대값을 포함하는 배열을 반환한다.
array.abs(id)
매개변수
id(int[]/float[]) 배열 객체。
이 부분도 참조하십시오.
array.new_float array.insert array.slice array.reverse order.ascending order.descending
array.binary_search
이 함수는 값의 인덱스를 반환하고, 만약 그 값이 발견되지 않으면 -1을 반환한다. 검색하려는 배열은 상승 순서에 따라 순서로 나열되어야 한다.
array.binary_search(id, val)
예를 들어
            pine

            // array.binary_search
a = array.from(5, -2, 0, 9, 1)
array.sort(a) // [-2, 0, 1, 5, 9]
position = array.binary_search(a, 0) // 1
plot(position)
매개변수
id(int[]/float[]) 배열 객체。val(series int/float) 배열에서 검색하는 값
참고 사항
이진적 검색은 상승 순서로 미리 정렬된 배열에 적용된다. 우선 배열의 중간에 있는 요소와 목표값을 비교한다. 만약 요소가 목표값과 일치하면, 배열의 위치를 반환한다. 요소의 값이 목표값보다 크면, 배열의 하반부에서 계속 검색한다. 요소의 값이 목표값보다 작다면, 배열의 상반부에서 계속 검색한다. 이 작업을 반복적으로 수행함으로써, 이 알고리즘은 배열의 목표값이 위치할 수 없는 점점 작은 부분을 점차 제거한다.
이 부분도 참조하십시오.
array.new_float array.insert array.slice array.reverse order.ascending order.descending
array.binary_search_leftmost
만약 값이 발견되면, 이 함수는 그 값의 인덱스를 반환한다. 값이 발견되지 않을 때, 이 함수는 다음의 최소 요소의 인덱스를 반환한다. 만약 그것이 배열에 있다면, 값이 있는 위치의 왼쪽에 있다. 검색하려는 배열은 상승 순서로 정리되어야 한다.
array.binary_search_leftmost(id, val)
예를 들어
            pine

            // array.binary_search_leftmost
a = array.from(5, -2, 0, 9, 1)
array.sort(a) // [-2, 0, 1, 5, 9]
position = array.binary_search_leftmost(a, 3) // 2
plot(position)
매개변수
id(int[]/float[]) 배열 객체。val(series int/float) 배열에서 검색하는 값
참고 사항
이진적 검색은 상승 순서로 미리 정렬된 배열에 적용된다. 우선 배열의 중간에 있는 요소와 목표값을 비교한다. 만약 요소가 목표값과 일치하면, 배열의 위치를 반환한다. 요소의 값이 목표값보다 크면, 배열의 하반부에서 계속 검색한다. 요소의 값이 목표값보다 작다면, 배열의 상반부에서 계속 검색한다. 이 작업을 반복적으로 수행함으로써, 이 알고리즘은 배열의 목표값이 위치할 수 없는 점점 작은 부분을 점차 제거한다.
이 부분도 참조하십시오.
array.new_float array.insert array.slice array.reverse order.ascending order.descending
array.binary_search_rightmost
만약 그 값이 발견되면, 이 함수는 그 값의 인덱스를 반환한다. 그 값이 발견되지 않을 때, 이 함수는 그 값이 배열의 위치의 오른쪽에 있는 요소의 인덱스를 반환한다. 배열은 상승 순서로 정리되어야 한다.
array.binary_search_rightmost(id, val)
예를 들어
            pine

            // array.binary_search_rightmost
a = array.from(5, -2, 0, 9, 1)
array.sort(a) // [-2, 0, 1, 5, 9]
position = array.binary_search_rightmost(a, 3) // 3
plot(position)
매개변수
id(int[]/float[]) 배열 객체。val(series int/float) 배열에서 검색하는 값
참고 사항
이진적 검색은 순서대로 서열된 배열에 작용한다. 그것은 먼저 배열의 중간에 있는 요소와 목표값을 비교한다. 요소가 목표값과 일치하면, 배열의 위치를 반환한다. 요소의 값이 목표값보다 크다면, 배열의 하반부에서 검색을 계속한다. 요소의 값이 목표값보다 작다면, 배열의 상반부에서 검색을 계속한다. 이 작업을 반복적으로 수행함으로써, 이 알고리즘은 배열의 목표값이 위치할 수 없는 점점 작은 부분을 점차 제거한다.
이 부분도 참조하십시오.
array.new_float array.insert array.slice array.reverse order.ascending order.descending
array.sort
이 함수는 배열의 요소를 정렬한다.
array.sort(id, order)
예를 들어
            pine

            // array.sort example
a = array.new_float(0,0)
for i = 0 to 5
    array.push(a, high[i])
array.sort(a, order.descending)
if barstate.islast
    runtime.log(str.tostring(a))
매개변수
id(int[]/float[]/string[]) 배열 객체。order(sort_order) 순서 순서: order.ascending (기본) 또는 order.descending。
이 부분도 참조하십시오.
array.new_float array.insert array.slice array.reverse order.ascending order.descending
array.sort_indices
인덱스된 배열을 반환하고, 원본 배열을 인덱스하는 데 사용할 때, 순서대로 요소를 액세스합니다. 그것은 원본 배열을 수정하지 않습니다.
array.sort_indices(id, order)
예를 들어
            pine

            // array.sort_indices
a = array.from(5, -2, 0, 9, 1)
sortedIndices = array.sort_indices(a) // [1, 2, 4, 0, 3]
indexOfSmallestValue = array.get(sortedIndices, 0) // 1
smallestValue = array.get(a, indexOfSmallestValue) // -2
plot(smallestValue)
매개변수
id(int[]/float[]/string[]) 배열 객체。order(sort_order) 순서 순서: order.ascending 또는 order.descending ᄋᄋᄋᄋᄋᄋᄋᄋᄋᄋᄋᄋᄋᄋᄋᄋᄋᄋᄋᄋᄋᄋᄋᄋᄋᄋᄋᄋᄋᄋᄋᄋᄋᄋᄋᄋᄋᄋᄋᄋᄋᄋᄋᄋᄋᄋᄋᄋᄋᄋᄋᄋᄋᄋᄋᄋᄋᄋᄋᄋᄋᄋᄋᄋᄋᄋᄋᄋᄋᄋᄋᄋᄋᄋᄋᄋᄋᄋᄋᄋᄋᄋᄋᄋᄋᄋᄋᄋᄋᄋᄋᄋᄋᄋᄋᄋᄋᄋᄋᄋᄋᄋᄋᄋᄋᄋᄋᄋᄋᄋᄋᄋ
이 부분도 참조하십시오.
array.new_float array.insert array.slice array.reverse order.ascending order.descending
array.clear
이 함수는 배열에서 모든 요소를 삭제한다.
array.clear(id)
예를 들어
            pine

            // array.clear example
a = array.new_float(5,high)
array.clear(a)
array.push(a, close)
plot(array.get(a,0))
plot(array.size(a))
매개변수
id(any array type) 배열 객체
이 부분도 참조하십시오.
array.new_float array.insert array.push array.remove array.pop
array.concat
이 함수는 두 배열을 합치기 위해 사용된다. 이 함수는 모든 요소를 두 번째 배열에서 첫 번째 배열로 밀어, 그리고 첫 번째 배열로 반환한다.
array.concat(id1, id2)
예를 들어
            pine

            // array.concat example
a = array.new_float(0,0)
b = array.new_float(0,0)
for i = 0 to 4
    array.push(a, high[i])
    array.push(b, low[i])
c = array.concat(a,b)
plot(array.size(a))
plot(array.size(b))
plot(array.size(c))
값을 반환합니다.
첫 번째 배열에는 두 번째 배열에서 합성된 요소가 있다.
매개변수
id1(any array type) 첫 번째 배열 객체id2(any array type) 두 번째 배열 객체
이 부분도 참조하십시오.
array.new_float array.insert array.slice
array.copy
이 함수는 기존의 배열의 복사본을 만듭니다.
array.copy(id)
예를 들어
            pine

            // array.copy example
length = 5
a = array.new_float(length, close)
b = array.copy(a)
a := array.new_float(length, open)
plot(array.sum(a) / length)
plot(array.sum(b) / length)
값을 반환합니다.
배열의 복사
매개변수
id(any array type) 배열 객체
이 부분도 참조하십시오.
array.new_float array.get array.slice array.sort
array.stdev
이 함수는 배열 요소의 표준차를 반환한다.
array.stdev(id, biased)
예를 들어
            pine

            // array.stdev example
a = array.new_float(0)
for i = 0 to 9
    array.push(a, close[i])
plot(array.stdev(a))
값을 반환합니다.
배열 요소의 표준은 다르죠.
매개변수
id(int[]/float[]) 배열 객체。biased(series bool) 어떤 추정치를 사용해야 하는지 결정한다.
참고 사항
만약biased만약 true라면, 함수는 전체의 편향된 추정치를 사용하여 계산하고, 만약 false라면 - 샘플의 편향되지 않은 추정치를 사용하여 계산한다.
이 부분도 참조하십시오.
array.new_float array.max array.min array.avg
array.standardize
이 함수는 표준화된 요소의 배열을 반환한다.
array.standardize(id)
예를 들어
            pine

            // array.standardize example
a = array.new_float(0)
for i = 0 to 9
    array.push(a, close[i])
b = array.standardize(a)
plot(array.min(b))
plot(array.max(b))
값을 반환합니다.
표준화 요소의 배열.
매개변수
id(int[]/float[]) 배열 객체。
이 부분도 참조하십시오.
array.max array.min array.mode array.avg array.variance array.stdev
array.variance
이 함수는 배열 요소의 차원을 반환한다.
array.variance(id, biased)
예를 들어
            pine

            // array.variance example
a = array.new_float(0)
for i = 0 to 9
    array.push(a, close[i])
plot(array.variance(a))
값을 반환합니다.
배열 요소의 제곱 △
매개변수
id(int[]/float[]) 배열 객체。biased(series bool) 어떤 추정치를 사용해야 하는지 결정한다.
참고 사항
만약biased만약 true라면, 함수는 전체의 편향된 추정치를 사용하여 계산하고, 만약 false라면 - 샘플의 편향되지 않은 추정치를 사용하여 계산한다.
이 부분도 참조하십시오.
array.new_float array.stdev array.min array.avg array.covariance
array.covariance
이 함수는 두 배열의 협방차를 반환한다.
array.covariance(id1, id2, biased)
예를 들어
            pine

            // array.covariance example
a = array.new_float(0)
b = array.new_float(0)
for i = 0 to 9
    array.push(a, close[i])
    array.push(b, open[i])
plot(array.covariance(a, b))
값을 반환합니다.
두 배열의 모방차 <unk>
매개변수
id1(int[]/float[]) 배열 객체。id2(int[]/float[]) 배열 객체。biased(series bool) 어떤 추정치를 사용해야 하는지 결정한다.
참고 사항
만약biased만약 true라면, 함수는 전체의 편향된 추정치를 사용하여 계산하고, 만약 false라면 - 샘플의 편향되지 않은 추정치를 사용하여 계산한다.
이 부분도 참조하십시오.
array.new_float array.max array.stdev array.avg array.variance
array.fill
이 함수는 배열의 요소를 단일 값으로 설정한다. 인덱스가 지정되지 않은 경우, 모든 요소를 설정한다. 초기 인덱스만 제공된다면, 그 인덱스에서 시작하는 요소를 설정한다. 두 개의 인덱스 파라미터를 동시에 사용한다면, 시작부터 인덱스된 요소를 설정한다. 하지만 끝 인덱스를 포함하지 않는다.
array.fill(id, value, index_from, index_to)
예를 들어
            pine

            // array.fill example
a = array.new_float(10)
array.fill(a, close)
plot(array.sum(a))
매개변수
id(any array type) 배열 객체value(series <type of the array's elements>) 는 배열을 채우기 위한 값이다.index_from(series int) 초기 인덱스, 기본 0。index_to(series int) 종료 인덱스, 기본적으로 na。 설정하려는 마지막 요소의 인덱스보다 커야 한다。
이 부분도 참조하십시오.
array.new_float array.set array.slice
array.includes
만약 배열에서 그 값이 발견된다면, 이 함수는 true를 반환하고, 그렇지 않으면 false를 반환한다.
array.includes(id, value)
예를 들어
            pine

            // array.includes example
a = array.new_float(5,high)
p = close
if array.includes(a, high)
    p := open
plot(p)
값을 반환합니다.
배열에서 그 값이 발견되면, true, 그렇지 않으면, false.
매개변수
id(any array type) 배열 객체value(series <type of the array's elements><unk> array에서 검색해야 하는 값
이 부분도 참조하십시오.
array.new_float array.indexof array.shift array.remove array.insert
array.insert
이 함수는 적절한 위치에 새로운 요소를 추가하여 배열의 내용을 변경합니다.
array.insert(id, index, value)
예를 들어
            pine

            // array.insert example
a = array.new_float(5, close)
array.insert(a, 0, open)
plot(array.get(a, 5))
매개변수
id(any array type) 배열 객체index(series int) 삽입값의 인덱스value(series <type of the array's elements><unk>은 <unk>을 <unk> 수 있습니다. <unk>은 <unk>을 <unk> 수 있습니다.
이 부분도 참조하십시오.
array.new_float array.set array.push array.remove array.pop array.unshift
array.join
이 함수는 배열의 모든 요소를 연결하여 새로운 문자열을 생성하고 반환하며, 지정된 분리자 문자열로 분리된다.
array.join(id, separator)
예를 들어
            pine

            // array.join example
a = array.new_float(5, 5)
runtime.log(array.join(a, ","))
매개변수
id(int[]/float[]/string[]) 배열 객체。separator(series string) 각 배열 요소를 분리하는 문자열
이 부분도 참조하십시오.
array.new_float array.set array.insert array.remove array.pop array.unshift
array.lastindexof
이 함수는 값이 마지막으로 나타난 인덱스를 반환한다. 만약 그 값이 발견되지 않으면 -1을 반환한다.
array.lastindexof(id, value)
예를 들어
            pine

            // array.lastindexof example
a = array.new_float(5,high)
index = array.lastindexof(a, high)
plot(index)
값을 반환합니다.
원소의 인덱스
매개변수
id(any array type) 배열 객체value(series <type of the array's elements><unk> array에서 검색해야 하는 값
이 부분도 참조하십시오.
array.new_float array.set array.push array.remove array.insert
array.max
이 함수는 최대값, 또는 주어진 배열의 n번째 최대값을 반환한다.
array.max(id, nth)
예를 들어
            pine

            // array.max
a = array.from(5, -2, 0, 9, 1)
secondHighest = array.max(a, 2) // 1
plot(secondHighest)
값을 반환합니다.
배열의 최대값 또는 n번째 최대값
매개변수
id(int[]/float[]) 배열 객체。nth(series int) 에서 반환되는 n번째 최대 값, 0이 최대 값이다. 선택 <unk>. 0은 기본 <unk>이다.
이 부분도 참조하십시오.
array.new_float array.min array.sum
array.min
이 함수는 최소값, 또는 주어진 서열의 n번째 최소값을 반환한다.
array.min(id, nth)
예를 들어
            pine

            // array.min
a = array.from(5, -2, 0, 9, 1)
secondLowest = array.min(a, 1) // 0
plot(secondLowest)
값을 반환합니다.
배열의 최소값 또는 n번째 최소값
매개변수
id(int[]/float[]) 배열 객체。nth(series int) 반환되는 최소 n번째 값, 0은 최소 값이다.
이 부분도 참조하십시오.
array.new_float array.max array.sum
array.median
이 함수는 배열 요소의 중소수를 반환한다.
array.median(id)
예를 들어
            pine

            // array.median example
a = array.new_float(0)
for i = 0 to 9
    array.push(a, close[i])
plot(array.median(a))
값을 반환합니다.
배열 요소의 중소수.
매개변수
id(int[]/float[]) 배열 객체。
이 부분도 참조하십시오.
array.avg array.variance array.min
array.mode
이 함수는 배열 요소의 모드를 반환한다. 동일한 주파수를 가진 값이 여러 개 있으면 최소 값을 반환한다.
array.mode(id)
예를 들어
            pine

            // array.mode example
a = array.new_float(0)
for i = 0 to 9
    array.push(a, close[i])
plot(array.mode(a))
값을 반환합니다.
배열 요소의 모형
매개변수
id(int[]/float[]) 배열 객체。
이 부분도 참조하십시오.
array.new_float array.avg array.variance array.min
array.percentile_linear_interpolation
배열값의 지정된 비율을 반환합니다. (% 소수) 이 그 값보다 작거나 같으며, 선형 삽입값을 사용합니다.
array.percentile_linear_interpolation(id, percentage)
매개변수
id(int[]/float[]) 배열 객체。percentage(series int/float) 는 반환 값의 값의 %에 해당해야 합니다.
참고 사항
통계학에서, 퍼센티지 (百分位) 는 어떤 점수나 어떤 점수보다 낮은 순위 항목의 비율이다. 이 측정은 당신이 측정하는 비율보다 낮은 수준의 표준 주파수 분포의 몇 퍼센트 분수를 나타냅니다. 선형 간격은 두 순위 사이의 값을 추정한다.
이 부분도 참조하십시오.
array.new_float array.insert array.slice array.reverse order.ascending order.descending
array.percentile_nearest_rank
최근 순위 방법을 사용하여 지정된 퍼센트의 배열값을 반환합니다.
array.percentile_nearest_rank(id, percentage)
매개변수
id(int[]/float[]) 배열 객체。percentage(series int/float) 는 반환 값의 값의 %에 해당해야 합니다.
참고 사항
통계학에서, 퍼센티지 (영어: percentage) 는 어떤 점수나 어떤 점수보다 낮은 순위 항목의 비율이다. 이 측정은 당신이 측정하고 있는 비율 순위보다 낮은 표준 주파수 분포의 몇 백분의 비율을 나타낸다.
이 부분도 참조하십시오.
array.new_float array.insert array.slice array.reverse order.ascending order.descending
array.percentrank
배열의 중간값의 백분율 순위를 반환한다.
array.percentrank(id, index)
매개변수
id(int[]/float[]) 배열 객체。index(series int) 는 그것의 백분율 순위의 값을 계산한다.
참고 사항
백분율 순위는 배열의 몇 개의 요소가 참조 값보다 작거나 같는지의 비율이다.
이 부분도 참조하십시오.
array.new_float array.insert array.slice array.reverse order.ascending order.descending
array.range
이 함수는 주어진 배열의 최소값과 최대값 사이의 차이를 반환한다.
array.range(id)
예를 들어
            pine

            // array.range example
a = array.new_float(0)
for i = 0 to 9
    array.push(a, close[i])
plot(array.range(a))
값을 반환합니다.
배열의 최소값과 최대값 사이의 차이
매개변수
id(int[]/float[]) 배열 객체。
이 부분도 참조하십시오.
array.new_float array.min array.max array.sum
array.remove
이 함수는 지정된 인덱스를 가진 요소를 삭제하여 배열의 내용을 변경한다.
array.remove(id, index)
예를 들어
            pine

            // array.remove example
a = array.new_float(5,high)
removedEl = array.remove(a, 0)
plot(array.size(a))
plot(removedEl)
값을 반환합니다.
삭제된 요소의 값
매개변수
id(any array type) 배열 객체index(series int) 삭제할 요소의 인덱스
이 부분도 참조하십시오.
array.new_float array.set array.push array.insert array.pop array.shift
array.reverse
이 함수는 배열을 반전한다. 첫 배열의 요소가 마지막이 되고, 마지막 배열의 요소가 첫 번째가 된다.
array.reverse(id)
예를 들어
            pine

            // array.reverse example
a = array.new_float(0)
for i = 0 to 9
    array.push(a, close[i])
plot(array.get(a, 0))
array.reverse(a)
plot(array.get(a, 0))
매개변수
id(any array type) 배열 객체
이 부분도 참조하십시오.
array.new_float array.sort array.push array.set array.avg
array.from
이 함수는 다음과 같은 타입 중 하나인 int,float,bool,string,line,color,linefill의 변수 수를 취하고, 해당 타입의 배열을 반환한다.
array.from(arg0, arg1, ...)
예를 들어
            pine

            // array.from_example
arr = array.from("Hello", "World!") // arr (string[]) will contain 2 elements: {Hello}, {World!}.
plot(close)
값을 반환합니다.
배열 요소의 값
매개변수
arg0, arg1, ...(series int/float/bool/color/string/line/linefill) 배열의 변수
array.new
이 함수는 새로운 함수를 생성합니다.<type>원소 배열 객체.
array.new(size, initial_value)
예를 들어
            pine

            // array.new<string> example
a = array.new<string>(1, "Hello, World!")
runtime.log(array.get(a, 0))
예를 들어
            pine

            // array.new<color> example
a = array.new<color>()
array.push(a, color.red)
array.push(a, color.green)
plot(close, color = array.get(a, close > open ? 1 : 0))
예를 들어
            pine

            // array.new<float> example
length = 5
var a = array.new<float>(length, close)
if array.size(a) == length
  array.remove(a, 0)
  array.push(a, close)
plot(array.sum(a) / length, "SMA")
예를 들어
            pine

            // array.new<line> example
// draw last 15 lines
var a = array.new<line>()
array.push(a, line.new(bar_index - 1, close[1], bar_index, close))
if array.size(a) > 15
    ln = array.shift(a)
    line.delete(ln)
값을 반환합니다.
다른 배열과 함께 사용할 수 있는 배열 객체의 ID。*() 함수
매개변수
size(series int) 서열의 초기 크기가 <unk>. 선택 <unk>. 기본값은 0 <unk>.initial_value(series <type>) 모든 서열 요소의 초기값。 선택사항。 기본값은 <unk>na<unk>。
참고 사항
배열 인덱스는 0부터 시작된다.
배열을 초기화하고 동시에 모든 요소를 지정하려면 함수 array.from 을 사용하십시오.
이 부분도 참조하십시오.
array.from array.push array.get array.size array.remove array.shift array.sum
array.new_bool
이 함수는 bool 타입의 요소로 구성된 새로운 배열 객체를 만듭니다.
array.new_bool(size, initial_value)
예를 들어
            pine

            // array.new_bool example
length = 5
a = array.new_bool(length, close > open)
plot(array.get(a, 0) ? close : open)
값을 반환합니다.
다른 배열과 함께 사용할 수 있는 배열 객체의 ID。*() 함수
매개변수
size(series int) 서열의 초기 크기가 <unk>. 선택 <unk>. 기본값은 0 <unk>.initial_value(series bool) 모든 일련 요소의 초기 값。 선택사항。 기본값은 <unk>na<unk>。
참고 사항
배열 인덱스는 0부터 시작된다.
이 부분도 참조하십시오.
array.new_float array.get array.slice array.sort
array.new_float
이 함수는 새로운 플래잉 포인트 타입의 요소 배열 객체를 생성한다.
array.new_float(size, initial_value)
예를 들어
            pine

            // array.new_float example
length = 5
a = array.new_float(length, close)
plot(array.sum(a) / length)
값을 반환합니다.
다른 배열과 함께 사용할 수 있는 배열 객체의 ID。*() 함수
매개변수
size(series int) 서열의 초기 크기가 <unk>. 선택 <unk>. 기본값은 0 <unk>.initial_value(series int/float) 모든 서열 요소의 초기값。 선택사항。 기본값은 <unk>na<unk>。
참고 사항
배열 인덱스는 0부터 시작된다.
이 부분도 참조하십시오.
array.new_bool array.get array.slice array.sort
array.new_int
이 함수는 int 타입의 요소로 구성된 새로운 배열 객체를 만듭니다.
array.new_int(size, initial_value)
예를 들어
            pine

            // array.new_int example
length = 5
a = array.new_int(length, int(close))
plot(array.sum(a) / length)
값을 반환합니다.
다른 배열과 함께 사용할 수 있는 배열 객체의 ID。*() 함수
매개변수
size(series int) 서열의 초기 크기가 <unk>. 선택 <unk>. 기본값은 0 <unk>.initial_value(series int) 모든 일련 요소의 초기 값。 옵션。 기본값은 <unk>na<unk>。
참고 사항
배열 인덱스는 0부터 시작된다.
이 부분도 참조하십시오.
array.new_float array.get array.slice array.sort
array.new_string
이 함수는 문자열 타입 요소의 새로운 배열 객체를 생성한다.
array.new_string(size, initial_value)
예를 들어
            pine

            // array.new_string example
length = 5
a = array.new_string(length, "text")
runtime.log(array.get(a, 0))
값을 반환합니다.
다른 배열과 함께 사용할 수 있는 배열 객체의 ID。*() 함수
매개변수
size(series int) 서열의 초기 크기가 <unk>. 선택 <unk>. 기본값은 0 <unk>.initial_value(series string) 모든 일련 요소의 초기 값。 옵션。 기본값은 <unk>na<unk>。
참고 사항
배열 인덱스는 0부터 시작된다.
이 부분도 참조하십시오.
array.new_float array.get array.slice
array.get
이 함수는 지정된 인덱스에서 요소의 값을 반환한다.
array.get(id, index)
예를 들어
            pine

            // array.get example
a = array.new_float(0)
for i = 0 to 9
  array.push(a, close[i] - open[i])
plot(array.get(a, 9))
값을 반환합니다.
배열 요소의 값
매개변수
id(any array type) 배열 객체index(series int) 값이 있는 요소의 인덱스를 반환한다.
이 부분도 참조하십시오.
array.new_float array.set array.slice array.sort
array.push
이 함수는 array에 하나의 값을 부착한다.
array.push(id, value)
예를 들어
            pine

            // array.push example
a = array.new_float(5, 0)
array.push(a, open)
plot(array.get(a, 5))
매개변수
id(any array type) 배열 객체value(series <type of the array's elements>) 는 배열의 마지막에 추가되는 요소 값이다.
이 부분도 참조하십시오.
array.new_float array.set array.insert array.remove array.pop array.unshift
array.set
이 함수는 요소의 값을 지정된 인덱스로 설정한다.
array.set(id, index, value)
예를 들어
            pine

            // array.set example
a = array.new_float(10)
for i = 0 to 9
  array.set(a, i, close[i])
plot(array.sum(a) / 10)
매개변수
id(any array type) 배열 객체index(series int) 요소의 인덱스를 수정한다.value(series <type of the array's elements>) 를 설정하는 새로운 값.
이 부분도 참조하십시오.
array.new_float array.get array.slice
array.sum
이 함수는 배열 요소의 합을 반환한다.
array.sum(id)
예를 들어
            pine

            // array.sum example
a = array.new_float(0)
for i = 0 to 9
  array.push(a, close[i])
plot(array.sum(a))
값을 반환합니다.
배열 요소의 합
매개변수
id(int[]/float[]) 배열 객체。
이 부분도 참조하십시오.
array.new_float array.max array.min
array.avg
이 함수는 배열 요소의 평균값을 반환한다.
array.avg(id)
예를 들어
            pine

            // array.avg example
a = array.new_float(0)
for i = 0 to 9
  array.push(a, close[i])
plot(array.avg(a))
값을 반환합니다.
배열 요소의 평균 △
매개변수
id(int[]/float[]) 배열 객체。
이 부분도 참조하십시오.
array.new_float array.max array.min array.stdev
array.indexof
이 함수는 값이 처음 나타난 인덱스를 반환한다. 만약 그 값이 발견되지 않으면 -1을 반환한다.
array.indexof(id, value)
예를 들어
            pine

            // array.indexof example
a = array.new_float(5,high)
index = array.indexof(a, high)
plot(index)
값을 반환합니다.
원소의 인덱스
매개변수
id(any array type) 배열 객체value(series <type of the array's elements><unk> array에서 검색해야 하는 값
이 부분도 참조하십시오.
array.lastindexof array.get array.lastindexof array.remove array.insert
strategy
존재하다strategy관련 내장 함수에서, 스톱포인트, 스톱<unk> 포인트는 가격 점프의 배수로 정의된다. 예를 들어strategy.exit함수의profit、loss변수는 점으로 표시됩니다.profit10으로 설정하면 가격 점프가 10으로 증가합니다. 가격 점프가 내장 변수입니다.syminfo.mintick。
strategy
이 함수는 여러 가지 정책 속성을 설정한다.
참고: 참고문헌만 지원합니다.title,shorttitle,overlay,pyramiding,default_qty_type,default_qty_value파라미터, 다른 파라미터들은 PINE 언어 정책의 인터페이스 파라미터로 설정할 수 있다.
strategy(title, shorttitle, overlay, format, precision, scale, pyramiding, calc_on_order_fills, calc_on_every_tick, max_bars_back, backtest_fill_limits_assumption, default_qty_type, default_qty_value, initial_capital, currency, slippage, commission_type, commission_value, process_orders_on_close, close_entries_rule, margin_long, margin_short, explicit_plot_zorder, max_lines_count, max_labels_count, max_boxes_count, risk_free_rate)
예를 들어
            pine

            strategy("Strategy", overlay = true)

// Enter long by market if current open is greater than previous high.
strategy.entry("Long", strategy.long, 1, when = open > high[1])
// Generate a full exit bracket (profit 10 points, loss 5 points per contract) from the entry named "Long".
strategy.exit("Exit", "Long", profit = 10, loss = 5)
매개변수
title(const string) 지표/정책 플러그인에서 볼 수 있는 지표 제목 △ 변수는 필수 △shorttitle(const string) 그래프 예제에서 볼 수 있는 지표의 짧은 제목 ᄒ. 변수는 선택가능하다 ᄒ.overlay(const bool) 만약 true라면, 이 지표는 메인 시리즈의 중첩 계층으로 추가된다. 만약 false라면 - 그것은 별도의 그래프 창에 추가된다.formatprecisionscalepyramiding(const int) 같은 방향에서 허용되는 최대 수. 만약 이 값이 0이라면, 같은 방향에서 하나의 입시 주문만 열 수 있고, 다른 모든 입시 주문은 거부된다.calc_on_order_fillscalc_on_every_tickmax_bars_backbacktest_fill_limits_assumptiondefault_qty_type(const string) 를 사용하기로 결정했습니다.qty파라미터의 값은 strategy.entry 또는 strategy.order 함수에서 표현된 내용이다. 가능한 값은:strategy.fixed는 계약/주식/시간을 나타내고,strategy.cash는 화폐 금액을 나타내고,또는 strategy.percent_of_equity는 사용가능한 권리권의 비율을 나타낸다.default_qty_value(const int/float) strategy.entry 또는 strategy.order 함수의 기본 거래 수, 그들의 'qty' 매개 변수가 정의되지 않을 때, 그 단위는 'default_qty_type' 매개 변수와 함께 사용되는 매개 변수로 결정된다.currencyslippagecommission_typecommission_valueprocess_orders_on_closeclose_entries_rulemax_lines_countmax_labels_countmax_boxes_countmargin_longmargin_shortexplicit_plot_zorderinitial_capitalrisk_free_rate
참고 사항
모든 전략 스크립트에는 strategy 호출이 있어야 합니다.
파인스크립트 코드는 calc_on_every_tick = true를 사용하여 역사 기록과 실시간 데이터를 다르게 계산할 수 있습니다.
비표준형의 차트를 전략의 기초로 사용할 때, 결과가 달라질 수 있다는 것을 알아야 합니다. 주문은 그 차트의 가격에서 실행됩니다 (e.g.for Heikin Ashi는 Heikin Ashi의 가격을 사용합니다.
이 부분도 참조하십시오.
indicator
strategy.entry
이것은 시장에 진입하는 명령이다. 동일한 ID를 가진 주문이 이미 걸려있다면 주문을 수정할 수 있다. 지정된 ID를 가진 주문이 없다면, 새로운 주문이 발급된다. 진입 지시문을 중지하려면 명령 strategy.cancel 또는 strategy.cancel_all을 사용한다. 함수 strategy.order과 비교하여, strategy.entry 기능은 피라미드에 영향을 받아서 시장 위치를 올바르게 반전할 수 있다.
strategy.entry(id, direction, qty, limit, stop, oca_name, oca_type, comment, when, alert_message)
예를 들어
            pine

            strategy(title = "simple strategy entry example")
strategy.entry("enter long", strategy.long, 1, when = open > high[1]) // enter long by market if current open great then previous high
strategy.entry("enter short", strategy.short, 1, when = open < low[1]) // enter short by market if current open less then previous low
매개변수
id(series string) 필요한 매개 변수。 주문 식별자。 주문을 취소하거나 변경할 수 있는 것은 해당 식별자를 참조하는 것이다。direction(strategy_direction) 하나의 필수 파라미터. 시장 지점 방향: 'strategy.long'은 다목적, 'strategy.short'은 공백.qty(series int/float) 선택 가능한 매개 변수。 거래 계약/주식 수/시간 수/단위 수。 기본값은 'NaN'。limit(series int/float) 선택 가능한 매개 변수。 주문의 제한 가격。 지정된 경우, 주문 유형은 "limit" 또는 "stop-limit"。 다른 주문 유형은 "NaN"。stop(series int/float) 선택 가능한 매개 변수。 주문의 중지 가격。 주문 유형이 지정된 경우 "stop" 또는 "stop-limit"。 다른 주문 유형은 "NaN"。oca_nameoca_typecomment(series string) 선택 가능한 파라미터。 주문의 다른 설명。when(series bool) 선택 가능한 변수。 주문의 상태。 "true"라면 주문이 배치된다。 "false"라면 아무 일도 일어나지 않는다 ((과거 배치된 동일한 ID의 주문이 취소되지 않았다) 。 기본값은 "true"。alert_message(series string) <unk>을 생성하는 알람<unk> 대화 상자의 <unk> 메시지<unk> 필드에 {{strategy.order.alert_message}} 점수를 사용할 때 선택 가능한 인수 △
strategy.close
이는 지정된 ID를 가진 출구 주문이다. 동일한 ID를 가진 입구 주문이 여러 개 있으면 모두 동시에 출구한다. 명령이 트리거될 때 지정된 ID를 가진 오픈 주문이 없다면 명령은 효력이 없다. 이 명령은 시장 주문을 사용한다. 각 입구는 별도의 시장 주문에 의해 폐쇄된다.
strategy.close(id, when, comment, qty, qty_percent, alert_message)
예를 들어
            pine

            strategy("closeEntry Demo", overlay=false)
strategy.entry("buy", strategy.long, when = open > close)
strategy.close("buy", when = open < close, qty_percent = 50, comment = "close buy entry for 50%")
plot(strategy.position_size)
매개변수
id(series string) 필요한 매개 변수。 주문 식별자。 주문을 닫기 위해 해당 식별자를 참조할 수 있다。when(series bool) 선택가능한 변수。 명령의 조건。qty(series int/float) 선택 가능한 매개 변수。 탈퇴 거래의 계약/주식/시간/단위 수。 기본값은 'NaN'。qty_percent(series int/float) 평점의 비율을 정의합니다. ((0-100) ᄒ. 그 우선순위는 'qty' 변수의 우선순위보다 낮습니다. (※) 선택적입니다. (※) 기본값은 100 ᄂ.comment(series string) 선택 가능한 파라미터。 주문의 다른 설명。alert_message(series string) <unk>을 생성하는 알람<unk> 대화 상자의 <unk> 메시지<unk> 필드에 {{strategy.order.alert_message}} 점수를 사용할 때 선택 가능한 인수 △
strategy.close_all
현재 시장 지위를 종료하여 평평하게하십시오.
strategy.close_all(when, comment, alert_message)
예를 들어
            pine

            strategy("closeAll Demo", overlay=false)
strategy.entry("buy", strategy.long, when = open > close)
strategy.close_all(when = open < close, comment = "close all entries")
plot(strategy.position_size)
매개변수
when(series bool) 선택가능한 변수。 명령의 조건。comment(series string) 선택 가능한 파라미터。 주문의 다른 설명。alert_message(series string) <unk>을 생성하는 알람<unk> 대화 상자의 <unk> 메시지<unk> 필드에 {{strategy.order.alert_message}} 점수를 사용할 때 선택 가능한 인수 △
strategy.exit
이것은 입구 또는 전체 시장 지위를 지정하여 탈퇴하는 명령이다. 동일한 ID를 가진 주문이 이미 걸려있는 경우, 주문을 수정할 수 있다. 입구 주문이 거래되지 않은 경우, 탈퇴 주문이 나타나면, 탈퇴 주문은 입구 주문이 완료된 후 탈퇴 주문을 할 수 있을 때까지 일시적으로 유지된다. 탈퇴 주문을 중지하려면, 명령 strategy.cancel 또는 strategy.cancel_all를 사용한다. 함수 strategy.exit가 한 번 호출되면, 오직 한 번만 탈퇴한다.
strategy.exit(id, from_entry, qty, qty_percent, profit, limit, loss, stop, trail_price, trail_points, trail_offset, oca_name, comment, when, alert_message)
예를 들어
            pine

            strategy(title = "simple strategy exit example")
strategy.entry("long", strategy.long, 1, when = open > high[1]) // enter long by market if current open great then previous high
strategy.exit("exit", "long", profit = 10, loss = 5) // generate full exit bracket (profit 10 points, loss 5 points per contract) from entry with name "long"
매개변수
id(series string) 필요한 매개 변수。 주문 식별자。 주문을 취소하거나 변경할 수 있는 것은 해당 식별자를 참조하는 것이다。from_entry(series string) 선택 가능한 매개 변수。 입력 명령어 식별자를 지정하여 탈퇴。 모든 포지션을 탈퇴하려면 빈 문자열을 사용해야 한다。 기본값은 빈 문자열이다。qty(series int/float) 선택 가능한 매개 변수。 탈퇴 거래의 계약/주식/시간/단위 수。 기본값은 'NaN'。qty_percent(series int/float) 평점의 비율을 정의합니다. ((0-100) ᄒ. 그 우선순위는 'qty' 변수의 우선순위보다 낮습니다. (※) 선택적입니다. (※) 기본값은 100 ᄂ.profit(series int/float) 선택 가능한 매개 변수。 수익 목표 ((점으로 표시) 。 지정된 경우, 지정된 수익 금액 ((점) 을 달성했을 때, 제한 가격 주문으로 시장 지위를 탈퇴한다。 기본값은 ?? NaN<unk>。limit(series int/float) 선택 가능한 매개 변수。 수익 목표 ([값을 지정해야 합니다])。 지정된 경우, 지정된 가격 ([또는 더 나은 것) 으로 시장 입장을 탈퇴한다。 매개 변수 'limit'의 우선순위는 매개 변수 'profit'의 우선순위보다 높다 ([값이 'NaN'이 아닌 경우, 'limit'은 'profit'을 대체한다)。 기본값은 NaN<unk>。loss(series int/float) 선택 가능한 파라미터 <unk> 손해 ((포인트로 표시) <unk>. 지정된 경우, 지정된 손실 금액 ((포인트) 을 달성했을 때, 중지 손해 단위로 시장 지위를 탈퇴한다. <unk> NaN<unk> <unk>.stop(series int/float) 선택 가능한 매개 변수 <unk> 손해 ((값을 지정해야 합니다) <unk> 지정된 경우, 지정된 가격 (또는 더 나쁜) 으로 시장 지위를 종료합니다 <unk> 매개 변수 '손해'의 우선 순위는 매개 변수 '손해'의 우선 순위보다 높습니다 <unk> 값이 'NaN'이 아닌 경우 '손해' 대신 '손해'가 됩니다) <unk> NaN<unk>입니다trail_price(series int/float) 선택 가능한 파라미터. 트래킹 스톱포드 활성화 레벨 ([값을 지정해야 합니다]) ᅳ 지정된 경우, 지정된 가격 수준에 도달했을 때 트래킹 스톱포드가 배치됩니다. 트래킹 스톱포드의 초기 가격을 결정하기 위해 트래킹 스톱포드 오프셋 <unk> 파라미터에서 트래킹 스톱포드의 초기 가격을 결정하기 위해 트래킹 스톱포드의 오차량을 지정합니다.trail_points(series int/float) 선택 가능한 파라미터. tracking stop loss activation level ((이윤을 점으로 표시한다). tracking stop loss will be placed when the calculated price level ((이윤 금액을 지정한다) 가 달성되면, tracking stop loss will be placed. trail_offset <unk> 파라미터에서 tracking stop loss order의 초기 가격을 결정하기 위한 편향을 지정한다.trail_offset(series int/float) 선택 가능한 파라미터. 트래킹 스톱포드 활성화 레벨 (... 점으로 표시된다) 을. 점으로 표시된 오차량은 트래킹 스톱포드의 초기 가격을 결정하는 데 사용됩니다. 다중을 탈퇴하기 위해 'trail_price' 또는 'trail_points'보다 낮은 X 점; 공백을 탈퇴하기 위해 'trail_price' 또는 'trail_points'보다 높은 X 점. 기본값은 NaN<unk>이다.oca_namecomment(series string) 선택 가능한 파라미터。 주문의 다른 설명。when(series bool) 선택 가능한 변수。 주문의 상태。 "true"라면 주문이 배치된다。 "false"라면 아무 일도 일어나지 않는다 ((과거 배치된 동일한 ID의 주문이 취소되지 않았다) 。 기본값은 "true"。alert_message(series string) <unk>을 생성하는 알람<unk> 대화 상자의 <unk> 메시지<unk> 필드에 {{strategy.order.alert_message}} 점수를 사용할 때 선택 가능한 인수 △
strategy.cancel
이 명령은 모든 예약 목록을 취소/무효화하기 위한 명칭을 참조하며, 다음과 같은 기능으로 생성된다: strategy.order, strategy.entry and strategy.exit。
strategy.cancel(id, when)
예를 들어
            pine

            strategy(title = "simple order cancellation example")
conditionForBuy = open > high[1]
strategy.entry("long", strategy.long, 1, limit = low, when = conditionForBuy) // enter long using limit order at low price of current bar if conditionForBuy is true
strategy.cancel("long", when = not conditionForBuy) // cancel the entry order with name "long" if conditionForBuy is false
매개변수
id(series string) 필수 선택 파라미트。 주문 아이덴티티。 주문을 취소하기 위해 이 아이덴티티를 위치하라。when(series bool) 선택 가능한 파라미트。 ID에 따라 주문을 취소한다。 "true"이면 주문이 취소된다。 기본값은 "true"이다。
strategy.cancel_all
이 명령은 다음의 기능에 의해 생성된 모든 예약 목록 명령을 취소/무효화합니다: strategy.order, strategy.entry 및 strategy.exit.
strategy.cancel_all(when)
예를 들어
            pine

            strategy(title = "simple all orders cancellation example")
conditionForBuy1 = open > high[1]
strategy.entry("long entry 1", strategy.long, 1, limit = low, when = conditionForBuy1) // enter long by limit if conditionForBuy1 is true
conditionForBuy2 = conditionForBuy1 and open[1] > high[2]
strategy.entry("long entry 2", strategy.long, 1, limit = ta.lowest(low, 2), when = conditionForBuy2) // enter long by limit if conditionForBuy2 is true
conditionForStopTrading = open < ta.lowest(low, 2)
strategy.cancel_all(conditionForStopTrading) // cancel both limit orders if the conditon conditionForStopTrading is true
매개변수
when(series bool) 선택 가능한 변수。 모든 주문의 조건을 취소。 조건이 참이라면 모든 활동 주문이 취소。 기본값은 <unk>true<unk>。
strategy.order
이것은 다음 주문의 명령이다. 동일한 ID를 가진 주문이 이미 걸려있다면, 주문을 수정할 수 있다. 지정된 ID를 가진 주문이 없다면, 새로운 주문이 발급된다. 주문을 중지하려면, 명령 strategy.cancel 또는 strategy.cancel_all을 사용한다. 함수strategy.entry와 달리 함수strategy.order은 피라미드 형식에 영향을 받지 않는다.
strategy.order(id, direction, qty, limit, stop, oca_name, oca_type, comment, when, alert_message)
예를 들어
            strategy(title = "simple strategy order example")
strategy.order("buy", strategy.long, 1, when = open > high[1]) // buy by market if current open great then previous high
strategy.order("sell", strategy.short, 1, when = open < low[1]) // sell by market if current open less then previous low
매개변수
id(series string) 필요한 매개 변수。 주문 식별자。 주문을 취소하거나 변경할 수 있는 것은 해당 식별자를 참조하는 것이다。direction(strategy_direction) 하나의 필수 변수. 주문 방향: 'strategy.long'은 구매, 'strategy.short'은 판매.qty(series int/float) 선택 가능한 매개 변수。 거래 계약/주식 수/시간 수/단위 수。 기본값은 'NaN'。limit(series int/float) 선택 가능한 매개 변수。 주문의 제한 가격。 지정된 경우, 주문 유형은 "limit" 또는 "stop-limit"。 다른 주문 유형은 "NaN"。stop(series int/float) 선택 가능한 매개 변수。 주문의 중지 가격。 주문 유형이 지정된 경우 "stop" 또는 "stop-limit"。 다른 주문 유형은 "NaN"。oca_nameoca_typecomment(series string) 선택 가능한 파라미터。 주문의 다른 설명。when(series bool) 선택 가능한 변수。 주문의 상태。 "true"라면 주문이 배치된다。 "false"라면 아무 일도 일어나지 않는다 ((과거 배치된 동일한 ID의 주문이 취소되지 않았다) 。 기본값은 "true"。alert_message(series string) <unk>을 생성하는 알람<unk> 대화 상자의 <unk> 메시지<unk> 필드에 {{strategy.order.alert_message}} 점수를 사용할 때 선택 가능한 인수 △
strategy.opentrades.entry_bar_index
bar_index는 아직 평정되지 않은 상장 입장을 반환한다.
strategy.opentrades.entry_bar_index(trade_num)
10K 라인을 기다리며 평평하게
예를 들어
            pine

            strategy("`strategy.opentrades.entry_bar_index` Example")

barsSinceLastEntry() =>
    strategy.opentrades > 0 ? bar_index - strategy.opentrades.entry_bar_index(strategy.opentrades - 1) : na

// Enter a long position if there are no open positions.
if strategy.opentrades == 0
    strategy.entry("Long",  strategy.long)

// Close the long position after 10 bars.
if barsSinceLastEntry() >= 10
    strategy.close("Long")
매개변수
trade_num(series int) 평준화되지 않은 거래의 거래 번호。 첫 번째 거래의 번호는 0。
이 부분도 참조하십시오.
strategy.closedtrades.entry_bar_index strategy.closedtrades.exit_bar_index
strategy.opentrades.entry_id
미완성 거래의 입장을 반환하는 ID <unk>
strategy.opentrades.entry_id(trade_num)
예를 들어
            pine

            strategy("`strategy.opentrades.entry_id` Example", overlay = true)

// We enter a long position when 14 period sma crosses over 28 period sma.
// We enter a short position when 14 period sma crosses under 28 period sma.
longCondition = ta.crossover(ta.sma(close, 14), ta.sma(close, 28))
shortCondition = ta.crossunder(ta.sma(close, 14), ta.sma(close, 28))

// Strategy calls to enter a long or short position when the corresponding condition is met.
if longCondition
    strategy.entry("Long entry at bar #" + str.tostring(bar_index), strategy.long)
if shortCondition
    strategy.entry("Short entry at bar #" + str.tostring(bar_index), strategy.short)

// Display ID of the latest open position.
if barstate.islastconfirmedhistory
    runtime.log("Last opened position is " + strategy.opentrades.entry_id(strategy.opentrades - 1))
값을 반환합니다.
미완성 거래의 입장을 반환하는 ID <unk>
매개변수
trade_num(series int) 평준화되지 않은 거래의 거래 번호。 첫 번째 거래의 번호는 0。
참고 사항
만약 trade_num가 범위에 있지 않다면, 이 함수는 na:0을 strategy.opentrades-1에 반환한다.
이 부분도 참조하십시오.
strategy.opentrades.entry_bar_index strategy.opentrades.entry_time
strategy.opentrades.entry_price
매출액은 매출액이 아닌 매출액으로 환불됩니다.
strategy.opentrades.entry_price(trade_num)
예를 들어
            pine

            strategy("strategy.closedtrades.entry_price Example 1")

// Strategy calls to enter long trades every 15 bars and exit long trades every 20 bars.
if bar_index % 15 == 0
    strategy.entry("Long", strategy.long)
if bar_index % 20 == 0
    strategy.close("Long")

// Return the entry price for the latest closed trade.
entryPrice = strategy.closedtrades.entry_price(strategy.closedtrades - 1)

plot(entryPrice, "Long entry price")
평균 미완성 포지션 가격 계산
예를 들어
            pine

            strategy("strategy.opentrades.entry_price Example 2", pyramiding = 2)

// Strategy calls to enter long trades every 15 bars and exit long trades every 20 bars.
if bar_index % 15 == 0
    strategy.entry("Long", strategy.long)
if bar_index % 20 == 0
    strategy.close("Long")

// Calculate average open position price.
avgOpenPositionPrice() =>
    sumOpenPositionPrice = 0.0
    for tradeNo = 0 to strategy.opentrades - 1
        sumOpenPositionPrice += strategy.opentrades.entry_price(tradeNo) * strategy.opentrades.size(tradeNo) / strategy.position_size
    result = nz(sumOpenPositionPrice / strategy.opentrades)

plot(avgOpenPositionPrice())
매개변수
trade_num(series int) 평준화되지 않은 거래의 거래 번호。 첫 번째 거래의 번호는 0。
이 부분도 참조하십시오.
strategy.closedtrades.exit_price
strategy.opentrades.entry_time
UNIX 시간으로 되돌아가기.
strategy.opentrades.entry_time(trade_num)
예를 들어
            pine

            strategy("strategy.opentrades.entry_time Example")

// Strategy calls to enter long trades every 15 bars and exit long trades every 20 bars.
if bar_index % 15 == 0
    strategy.entry("Long", strategy.long)
if bar_index % 20 == 0
    strategy.close("Long")

// Calculates duration in milliseconds since the last position was opened.
timeSinceLastEntry()=>
    strategy.opentrades > 0 ? (time - strategy.opentrades.entry_time(strategy.opentrades - 1)) : na

plot(timeSinceLastEntry() / 1000 * 60 * 60 * 24, "Days since last entry")
매개변수
trade_num(series int) 평준화되지 않은 거래의 거래 번호。 첫 번째 거래의 번호는 0。
이 부분도 참조하십시오.
strategy.closedtrades.entry_time strategy.closedtrades.exit_time
strategy.opentrades.profit
미완성 지분 거래로 돌아온 손실. 손실은 마이너스로 표시된다.
strategy.opentrades.profit(trade_num)
마지막 상장 거래의 수익으로 돌아갑니다.
예를 들어
            pine

            strategy("`strategy.opentrades.profit` Example 1", commission_type = strategy.commission.percent, commission_value = 0.1)

// Strategy calls to enter long trades every 15 bars and exit long trades every 20 bars.
if bar_index % 15 == 0
    strategy.entry("Long", strategy.long)
if bar_index % 20 == 0
    strategy.close("Long")

plot(strategy.opentrades.profit(strategy.opentrades - 1), "Profit of the latest open trade")
모든 매장되지 않은 거래의 수익을 계산합니다.
예를 들어
            pine

            strategy("`strategy.opentrades.profit` Example 2", pyramiding = 5)

// Strategy calls to enter 5 long positions every 2 bars.
if bar_index % 2 == 0
    strategy.entry("Long", strategy.long, qty = 5)

// Calculate open profit or loss for the open positions.
tradeOpenPL() =>
    sumProfit = 0.0
    for tradeNo = 0 to strategy.opentrades - 1
        sumProfit += strategy.opentrades.profit(tradeNo)
    result = sumProfit

plot(tradeOpenPL(), "Profit of all open trades")
매개변수
trade_num(series int) 평준화되지 않은 거래의 거래 번호。 첫 번째 거래의 번호는 0。
이 부분도 참조하십시오.
strategy.closedtrades.profit strategy.openprofit strategy.netprofit strategy.grossprofit
strategy.opentrades.size
미완성 포지션 거래의 거래 방향과 계약 수를 반환한다. 이 값이> 0이면 시장 포지션은 다면이다. 이 값이<0이면 시장 포지션은 빈 머리이다.
strategy.opentrades.size(trade_num)
예를 들어
            pine

            strategy("`strategy.opentrades.size` Example 1")

// We calculate the max amt of shares we can buy.
amtShares = math.floor(strategy.equity / close)
// Strategy calls to enter long trades every 15 bars and exit long trades every 20 bars
if bar_index % 15 == 0
    strategy.entry("Long", strategy.long, qty = amtShares)
if bar_index % 20 == 0
    strategy.close("Long")

// Plot the number of contracts in the latest open trade.
plot(strategy.opentrades.size(strategy.opentrades - 1), "Amount of contracts in latest open trade")
미완성 지분 거래의 평균 이익 비율을 계산합니다.
예를 들어
            pine

            strategy("`strategy.opentrades.size` Example 2")

// Strategy calls to enter long trades every 15 bars and exit long trades every 20 bars.
if bar_index % 15 == 0
    strategy.entry("Long", strategy.long)
if bar_index % 20 == 0
    strategy.close("Long")

// Calculate profit for all open trades.
profitPct = 0.0
for tradeNo = 0 to strategy.opentrades - 1
    entryP = strategy.opentrades.entry_price(tradeNo)
    exitP = close
    profitPct += (exitP - entryP) / entryP * strategy.opentrades.size(tradeNo) * 100

// Calculate average profit percent for all open trades.
avgProfitPct = nz(profitPct / strategy.opentrades)
매개변수
trade_num(series int) 평준화되지 않은 거래의 거래 번호。 첫 번째 거래의 번호는 0。
이 부분도 참조하십시오.
strategy.closedtrades.size strategy.position_size strategy.opentrades strategy.closedtrades
strategy.closedtrades.entry_bar_index
bar_index는 평정된 입장을 반환한다.
strategy.closedtrades.entry_bar_index(trade_num)
예를 들어
            pine

            strategy("strategy.closedtrades.entry_bar_index Example")
// Enter long trades on three rising bars; exit on two falling bars.
if ta.rising(close, 3)
    strategy.entry("Long", strategy.long)
if ta.falling(close, 2)
    strategy.close("Long")
// Function that calculates the average amount of bars in a trade.
avgBarsPerTrade() =>
    sumBarsPerTrade = 0
    for tradeNo = 0 to strategy.closedtrades - 1
        // Loop through all closed trades, starting with the oldest.
        sumBarsPerTrade += strategy.closedtrades.exit_bar_index(tradeNo) - strategy.closedtrades.entry_bar_index(tradeNo) + 1
    result = nz(sumBarsPerTrade / strategy.closedtrades)
plot(avgBarsPerTrade())
매개변수
trade_num(series int) 평점 거래의 거래 번호。 첫 번째 거래의 번호는 0。
이 부분도 참조하십시오.
strategy.closedtrades.exit_bar_index strategy.opentrades.entry_bar_index
strategy.closedtrades.exit_price
상쇄된 거래의 출구 가격으로 돌아갑니다.
strategy.closedtrades.exit_price(trade_num)
예를 들어
            pine

            strategy("strategy.closedtrades.exit_price Example 1")

// We are creating a long trade every 5 bars
if bar_index % 5 == 0
    strategy.entry("Long",  strategy.long)
strategy.close("Long")

// Return the exit price from the latest closed trade.
exitPrice = strategy.closedtrades.exit_price(strategy.closedtrades - 1)

plot(exitPrice, "Long exit price")
모든 매출이 매출된 거래의 평균 수익률을 계산합니다.
예를 들어
            pine

            strategy("strategy.closedtrades.exit_price Example 2")

// Strategy calls to create single short and long trades.
if bar_index == last_bar_index - 15
    strategy.entry("Long Entry",  strategy.long)
else if bar_index == last_bar_index - 10
    strategy.close("Long Entry")
    strategy.entry("Short", strategy.short)
else if bar_index == last_bar_index - 5
    strategy.close("Short")

// Calculate profit for both closed trades.
profitPct = 0.0
for tradeNo = 0 to strategy.closedtrades - 1
    entryP = strategy.closedtrades.entry_price(tradeNo)
    exitP = strategy.closedtrades.exit_price(tradeNo)
    profitPct += (exitP - entryP) / entryP * strategy.closedtrades.size(tradeNo) * 100

// Calculate average profit percent for both closed trades.
avgProfitPct = nz(profitPct / strategy.closedtrades)

plot(avgProfitPct)
매개변수
trade_num(series int) 평점 거래의 거래 번호。 첫 번째 거래의 번호는 0。
이 부분도 참조하십시오.
strategy.closedtrades.entry_price
strategy.closedtrades.exit_bar_index
bar_index ᅳ 청산된 거래에서 탈퇴한 것을 반환한다.
strategy.closedtrades.exit_bar_index(trade_num)
예를 들어
            pine

            strategy("strategy.closedtrades.exit_bar_index Example 1")

// Strategy calls to place a single short trade. We enter the trade at the first bar and exit the trade at 10 bars before the last chart bar.
if bar_index == 0
    strategy.entry("Short",  strategy.short)
if bar_index == last_bar_index - 10
    strategy.close("Short")

// Calculate the amount of bars since the last closed trade.
barsSinceClosed = strategy.closedtrades > 0 ? bar_index - strategy.closedtrades.exit_bar_index(strategy.closedtrades - 1) : na

plot(barsSinceClosed, "Bars since last closed trade")
매 거래의 평균 K선 수를 계산한다.
예를 들어
            pine

            strategy("strategy.closedtrades.exit_bar_index Example 2")

// Enter long trades on three rising bars; exit on two falling bars.
if ta.rising(close, 3)
    strategy.entry("Long", strategy.long)
if ta.falling(close, 2)
    strategy.close("Long")

// Function that calculates the average amount of bars per trade.
avgBarsPerTrade() =>
    sumBarsPerTrade = 0
    for tradeNo = 0 to strategy.closedtrades - 1
        // Loop through all closed trades, starting with the oldest.
        sumBarsPerTrade += strategy.closedtrades.exit_bar_index(tradeNo) - strategy.closedtrades.entry_bar_index(tradeNo) + 1
    result = nz(sumBarsPerTrade / strategy.closedtrades)

plot(avgBarsPerTrade())
매개변수
trade_num(series int) 평점 거래의 거래 번호。 첫 번째 거래의 번호는 0。
이 부분도 참조하십시오.
bar_index
strategy.closedtrades.entry_id
평정 거래의 입구를 반환한 id。
strategy.closedtrades.entry_id(trade_num)
예를 들어
            pine

            strategy("strategy.closedtrades.entry_id Example", overlay = true)
var isOpen = false
var openIndex = -1
// Enter a short position and close at the previous to last bar.
if not barstate.ishistory and not isOpen
    strategy.entry("Short at bar #" + str.tostring(bar_index), strategy.short)
    isOpen := true
    openIndex := bar_index
if openIndex != -1 and bar_index > openIndex + 100
    strategy.close_all()

// Display ID of the last entry position.
if barstate.islastconfirmedhistory
    runtime.log("Last Entry ID is: " + strategy.closedtrades.entry_id(strategy.closedtrades - 1))
값을 반환합니다.
평정 거래의 입구를 반환한 id。
매개변수
trade_num(series int) 평점 거래의 거래 번호。 첫 번째 거래의 번호는 0。
참고 사항
만약 trade_num가 범위에 있지 않다면, 이 함수는 na:0을 strategy.closedtrades-1에 반환한다.
이 부분도 참조하십시오.
strategy.closedtrades.entry_bar_index strategy.closedtrades.entry_time
strategy.closedtrades.entry_price
평정 거래의 입수 가격을 반환한다.
strategy.closedtrades.entry_price(trade_num)
예를 들어
            pine

            strategy("strategy.closedtrades.entry_price Example 1")

// Strategy calls to enter long trades every 15 bars and exit long trades every 20 bars.
if bar_index % 15 == 0
    strategy.entry("Long", strategy.long)
if bar_index % 20 == 0
    strategy.close("Long")

// Return the entry price for the latest  entry.
entryPrice = strategy.closedtrades.entry_price(strategy.closedtrades - 1)

plot(entryPrice, "Long entry price")
모든 매출이 매출된 거래의 평균 수익률을 계산합니다.
예를 들어
            pine

            strategy("strategy.closedtrades.entry_price Example 2")

// Strategy calls to create single short and long trades
if bar_index == last_bar_index - 15
    strategy.entry("Long Entry",  strategy.long)
else if bar_index == last_bar_index - 10
    strategy.close("Long Entry")
    strategy.entry("Short", strategy.short)
else if bar_index == last_bar_index - 5
    strategy.close("Short")

// Calculate profit for both closed trades.
profitPct = 0.0
for tradeNo = 0 to strategy.closedtrades - 1
    entryP = strategy.closedtrades.entry_price(tradeNo)
    exitP = strategy.closedtrades.exit_price(tradeNo)
    profitPct += (exitP - entryP) / entryP * strategy.closedtrades.size(tradeNo) * 100

// Calculate average profit percent for both closed trades.
avgProfitPct = nz(profitPct / strategy.closedtrades)

plot(avgProfitPct)
매개변수
trade_num(series int) 평점 거래의 거래 번호。 첫 번째 거래의 번호는 0。
이 부분도 참조하십시오.
strategy.closedtrades.exit_price strategy.closedtrades.size strategy.closedtrades
strategy.closedtrades.entry_time
평정 거래 입시로 돌아온 UNIX 시간.
strategy.closedtrades.entry_time(trade_num)
예를 들어
            pine

            strategy("strategy.closedtrades.entry_time Example", overlay = true)

// Enter long trades on three rising bars; exit on two falling bars.
if ta.rising(close, 3)
    strategy.entry("Long", strategy.long)
if ta.falling(close, 2)
    strategy.close("Long")

// Calculate the average trade duration
avgTradeDuration() =>
    sumTradeDuration = 0
    for i = 0 to strategy.closedtrades - 1
        sumTradeDuration += strategy.closedtrades.exit_time(i) - strategy.closedtrades.entry_time(i)
    result = nz(sumTradeDuration / strategy.closedtrades)

// Display average duration converted to seconds and formatted using 2 decimal points
if barstate.islastconfirmedhistory
    runtime.log(str.tostring(avgTradeDuration() / 1000, "#.##") + " seconds")
매개변수
trade_num(series int) 평점 거래의 거래 번호。 첫 번째 거래의 번호는 0。
이 부분도 참조하십시오.
strategy.opentrades.entry_time strategy.closedtrades.exit_time time
strategy.closedtrades.profit
평점 거래로 돌아온 손실. 손실은 마이너스로 표시된다.
strategy.closedtrades.profit(trade_num)
예를 들어
            pine

            strategy("`strategy.closedtrades.profit` Example")

// Strategy calls to enter long trades every 15 bars and exit long trades every 20 bars.
if bar_index % 15 == 0
    strategy.entry("Long", strategy.long)
if bar_index % 20 == 0
    strategy.close("Long")

// Calculate average gross profit by adding the difference between gross profit and commission.
avgGrossProfit() =>
    sumGrossProfit = 0.0
    for tradeNo = 0 to strategy.closedtrades - 1
        sumGrossProfit += strategy.closedtrades.profit(tradeNo) - strategy.closedtrades.commission(tradeNo)
    result = nz(sumGrossProfit / strategy.closedtrades)

plot(avgGrossProfit(), "Average gross profit")
매개변수
trade_num(series int) 평점 거래의 거래 번호。 첫 번째 거래의 번호는 0。
이 부분도 참조하십시오.
strategy.opentrades.profit strategy.closedtrades.commission
strategy.closedtrades.size
평준화 된 거래의 거래 방향과 계약 수를 반환한다. 이 값이> 0이면 시장 위치가 다면이다. 이 값이< 0이면 시장 위치가 공백이다.
strategy.closedtrades.size(trade_num)
예를 들어
pine
strategy("`strategy.closedtrades.size` Example 1")
// We calculate the max amt of shares we can buy.
amtShares = math.floor(strategy.equity / close)
// Strategy calls to enter long trades every 15 bars and exit long trades every 20 bars
if bar_index % 15 == 0
strategy.entry("Long", strategy.long, qty = amtShares)
if bar_index % 20 == 0
strategy.close("Long")
// Plot the number of contracts traded in the last closed trade.
plot(strategy.closedtrades.size(strategy.closedtrades - 1), "Number of contracts traded")
평점 거래의 평균 이익 비율을 계산합니다.
예를 들어
pine
strategy("`strategy.closedtrades.size` Example 2")
// Strategy calls to enter long trades every 15 bars and exit long trades every 20 bars.
if bar_index % 15 == 0
strategy.entry("Long", strategy.long)
if bar_index % 20 == 0
strategy.close("Long")
// Calculate profit for both closed trades.
profitPct = 0.0
for tradeNo = 0 to strategy.closedtrades - 1
entryP = strategy.closedtrades.entry_price(tradeNo)
exitP = strategy.closedtrades.exit_price(tradeNo)
profitPct += (exitP - entryP) / entryP * strategy.closedtrades.size(tradeNo) * 100
// Calculate average profit percent for both closed trades.
avgProfitPct = nz(profitPct / strategy.closedtrades)
plot(avgProfitPct)
매개변수
trade_num(series int) 평점 거래의 거래 번호。 첫 번째 거래의 번호는 0。
이 부분도 참조하십시오.
strategy.opentrades.size strategy.position_size strategy.closedtrades strategy.opentrades
strategy.closedtrades.exit_time
평형 거래에서 탈퇴한 UNIX 시간으로 돌아갑니다.
strategy.closedtrades.exit_time(trade_num)
예를 들어
pine
strategy("strategy.closedtrades.exit_time Example 1")
// Enter long trades on three rising bars; exit on two falling bars.
if ta.rising(close, 3)
strategy.entry("Long", strategy.long)
if ta.falling(close, 2)
strategy.close("Long")
// Calculate the average trade duration.
avgTradeDuration() =>
sumTradeDuration = 0
for i = 0 to strategy.closedtrades - 1
sumTradeDuration += strategy.closedtrades.exit_time(i) - strategy.closedtrades.entry_time(i)
result = nz(sumTradeDuration / strategy.closedtrades)
// Display average duration converted to seconds and formatted using 2 decimal points.
if barstate.islastconfirmedhistory
label.new(bar_index, high, str.tostring(avgTradeDuration() / 1000, "#.##") + " seconds")
X초 후에 매장된 거래가 재개됩니다.
예를 들어
strategy("strategy.closedtrades.exit_time Example 2")
// Strategy calls to emulate a single long trade at the first bar.
if bar_index == 0
strategy.entry("Long", strategy.long)
reopenPositionAfter(timeSec) =>
if strategy.closedtrades > 0
if time - strategy.closedtrades.exit_time(strategy.closedtrades - 1) >= timeSec * 1000
strategy.entry("Long", strategy.long)
// Reopen last closed position after 120 sec.
reopenPositionAfter(120)
if ta.change(strategy.opentrades)
strategy.exit("Long", stop = low * 0.9, profit = high * 2.5)
매개변수
trade_num(series int) 평점 거래의 거래 번호。 첫 번째 거래의 번호는 0。
이 부분도 참조하십시오.
strategy.closedtrades.entry_time
strategy.risk.allow_entry_in
이 함수는 strategy.entry 함수가 어느 시장 방향에 입장을 열 수 있는지 지정하는 데 사용할 수 있습니다.
strategy.risk.allow_entry_in(value)
예를 들어
pine
strategy("strategy.risk.allow_entry_in")
strategy.risk.allow_entry_in(strategy.direction.long)
strategy.entry("Long", strategy.long, when = open > close)
// Instead of opening a short position with 10 contracts, this command will close long entries.
strategy.entry("Short", strategy.short, when = open < close, qty = 10)
매개변수
value(simple string) 허용되는 방향. 가능한 값:strategy.direction.all、strategy.direction.long、strategy.direction.short
strategy.risk.max_position_size
이 규칙의 목적은 시장 위치의 최대 값을 결정하는 것입니다. 이 규칙은 다음과 같은 기능에 영향을 미칩니다:strategy.entryᄒ <unk>entry<unk>의 수는 계약/주식/손/단위 수로 줄일 수 있으며, 따라서 포지션의 총값은 'strategy.risk.max_position_size'에서 지정된 값을 초과하지 않습니다. ᄂ 최소 수가 여전히 규칙을 위반하면 주문이 배치되지 않습니다.
strategy.risk.max_position_size(contracts)
예를 들어
pine
strategy("risk.max_position_size Demo", default_qty_value = 100)
strategy.risk.max_position_size(10)
strategy.entry("buy", strategy.long, when = open > close)
plot(strategy.position_size) // max plot value will be 10
매개변수
contracts(simple int/float) 필요한 파라미터 △ 포지션의 계약/주/손/단위 최대 수
math
math.abs
만약...number >= 0,number절대값은number그렇지 않으면 -number。
math.abs(number)
값을 반환합니다.
number△0의 절대값
math.acos
acos 함수는 cos ((acos ((y)) = y의 범위에서 y와 같은 숫자의 반사선 (((를弧形으로 나타냅니다.[-1, 1]。
math.acos(angle)
값을 반환합니다.
반음성값. y가 범위를 벗어난 경우[-1,1], 반환 각은[0,Pi] 또는 na의 범위에서
math.random
가짜 무작위 값을 반환한다. 이 함수는 각 스크립트 실행에 대해 다른 일련의 값을 생성한다. 선택 가능한 seed 변수에 대해 동일한 값을 사용하는 것은 반복되는 일련의 값을 생성한다.
math.random(min, max, seed)
값을 반환합니다.
무작위 값.
매개변수
min(series int/float) 무작위 값 범위의 하위 <unk>. 그 값은 범위에 포함되지 않는다. 0을 기본값으로 한다.max(series int/float) 무작위 값 범위의 상한. 이 값은 범위에 포함되지 않는다. 기본값은 1 ᄂ이다.seed(input int) 선택 가능한 변수。 동일한 seed 을 사용할 때, 반복적으로 이 함수를 호출하여 반복 가능한 값의 집합을 생성하는 것이 허용된다。
math.asin
asin 함수는 숫자의 반소인 (((기하의 곡선으로 표현된) 을 반환하며, 소인 ((asin ((y)) = y 는 y 범위 안에 있다.[-1, 1]。
math.asin(angle)
값을 반환합니다.
반소음값. y가 범위를 벗어나면[-1,1], 반환 각은[-Pi / 2,Pi / 2] 또는 na의 범위에서
math.atan
atan 함수는 숫자의 반직선 (((을 아크로 표현한다), tan (((atan ((y)) = 어떤 y의 y。
math.atan(angle)
값을 반환합니다.
역 절단 값;[-Pi / 2,Pi / 2]의 범위에서
math.ceil
상향이온 함수는 대수 (Argument) 보다 크거나 같을 수 있는 최소 (최근 음의 무한) 정수를 반환한다.
math.ceil(number)
값을 반환합니다.
주어진 숫자의 최소 정수보다 작거나 같을 수 있습니다.
이 부분도 참조하십시오.
math.floor math.round
math.cos
cos 함수는 각을 반환하는 삼각형의 아연
math.cos(angle)
값을 반환합니다.
뿔의 삼각형 <unk>
매개변수
angle(series int/float) 각, 곡선으로
math.exp
numbere의 exp 함수는number대분모, 여기서 e는 오라 수이다.
math.exp(number)
값을 반환합니다.
e의 값을 나타내는 값은number<unk>
이 부분도 참조하십시오.
math.pow
math.floor
math.floor(number)
값을 반환합니다.
주어진 숫자의 최대 정수보다 작거나 같다.
이 부분도 참조하십시오.
math.ceil math.round
math.log
아무 것도number0보다 더 큰 자연 대수인 y는 y의 유일한 자연 대수입니다number。
math.log(number)
값을 반환합니다.
number자연 상수
이 부분도 참조하십시오.
math.log10
math.log10
number10을 10으로 세는 것은 10을 10으로 세는 것입니다.number。10^y = number。
math.log10(number)
값을 반환합니다.
number10의 밑에 있는 대수
이 부분도 참조하십시오.
math.log
math.pow
수학 <unk> 함수
math.pow(base, exponent)
예를 들어
pine
// math.pow
plot(math.pow(close, 2))
값을 반환합니다.
base증가exponent<unk>base그리고 이것은 <unk>을 <unk> 수 있습니다. <unk>을 <unk> 수 있습니다.
매개변수
base(series int/float) 사용하려는 기반을 지정한다.exponent(series int/float) 지수를 지정한다.
이 부분도 참조하십시오.
math.sqrt math.exp
math.sign
<unk>number<unk>이 0이면, <unk>number<unk>의 기호는 0이고, <unk>number<unk>이 0보다 크면 1.0이고, <unk>number<unk>이 0보다 작으면-1.0。
math.sign(number)
값을 반환합니다.
파라미터의 로그
math.sin
정사진 함수는 한 각의 삼각형 정사진을 반환한다.
math.sin(angle)
값을 반환합니다.
뿔의 삼각형 정사각형
매개변수
angle(series int/float) 각, 곡선으로
math.sqrt
어떤numbery의 제곱근이 0이 되면 y의 제곱근이 0이 됩니다number。
math.sqrt(number)
값을 반환합니다.
number제곱근
이 부분도 참조하십시오.
math.pow
math.tan
tan 함수가 반환하는 각의 삼각형 정사각형
math.tan(angle)
값을 반환합니다.
각의 삼각형은 직사각형이다.
매개변수
angle(series int/float) 각, 곡선으로
math.round
돌아와number<unk>값을 가장 가까운 정수까지 <unk>다. <unk>값을 <unk>다.precision변수, 그러면 작은 자리 수에 4개의 칸을 넣은 부동점 값을 반환한다.
math.round(number)
math.round(number, precision)
값을 반환합니다.
number값은 가장 근접한 정수, 또는 정확도에 따라 <unk>.
매개변수
number(series int/float) 4개로 둥글게 묶어 놓아야 합니다.precision(series int) 선택 가능한 변수number소수점의 숫자를 사각지대로 한다. 변수가 제공되지 않을 때, 가장 가까운 정수점의 숫자를 사각지대로 한다.
참고 사항
'na' 값에 대해 함수는 'na'을 반환한다.
이 부분도 참조하십시오.
math.ceil math.floor
math.max
여러 값 중 가장 큰 값을 반환합니다.
math.max(number0, number1, ...)
예를 들어
pine
// math.max
plot(math.max(close, open))
plot(math.max(close, math.max(open, 42)))
값을 반환합니다.
여러 개의 주어진 값 중 가장 큰 값
이 부분도 참조하십시오.
math.min
math.min
여러 값 중 가장 작은 값을 반환합니다.
math.min(number0, number1, ...)
예를 들어
pine
// math.min
plot(math.min(close, open))
plot(math.min(close, math.min(open, 42)))
값을 반환합니다.
여러 주어진 값들 중 최소값
이 부분도 참조하십시오.
math.max
math.avg
모든 일련의 평균값을 계산한다.
math.avg(number0, number1, ...)
값을 반환합니다.
평균
이 부분도 참조하십시오.
math.sum ta.cum ta.sma
math.round_to_mintick
상품에 둥근 둥근 둥근 둥근 둥근 둥근 둥근 둥근 둥근 둥근 둥근 둥근 둥근 둥근 둥근 둥근 둥근 둥근 둥근 둥근 둥근 둥근 둥근 둥근 둥근 둥근 둥근 둥근 둥근 둥근 둥근 둥근 둥근 둥근 둥근 둥근 둥근 둥근 둥근 둥근
math.round_to_mintick(number)
값을 반환합니다.
number틱까지 정확하게 4회 5회 득점
매개변수
number(series int/float) 4개로 둥글게 묶어 놓아야 합니다.
이 부분도 참조하십시오.
math.ceil math.floor
math.sum
sum 함수는 x의 마지막 y값의 슬라이드 합성값을 반환한다.
math.sum(source, length)
값을 반환합니다.
lengthK선으로 돌아온source합계 <unk>
매개변수
source(series int/float) 실행중인 일련값length(series int) K 줄의 수 (연장).
math.todegrees
<unk>도 단위에서의 각에서, <unk>도 단위에서의 근사동치 각으로 돌아온다.
math.todegrees(radians)
값을 반환합니다.
단위로 측정된 각값.
매개변수
radians(series int/float) 아크도 단위에서의 각
math.toradians
단위 단위의 각에서, 구도 단위의 근사 동치 각으로 돌아온다.
math.toradians(degrees)
값을 반환합니다.
아크도 단위로 각값.
매개변수
degrees(series int/float) 측정된 단위에서의 각
others
fixnan
주어진 시리즈에 대해 NaN 값을 이전 비 NaN 값으로 대체한다.
fixnan(source)
값을 반환합니다.
<unk>은 <unk>의 <unk>을 <unk>다.
매개변수
source(series int/float/bool/color)
nz
NaN값을 시리즈의 0 (또는 지정된 숫자) 로 대체하십시오.
nz(source, replacement)
nz(source)
예를 들어
pine
// nz
plot(nz(ta.sma(close, 100)))
값을 반환합니다.
source이 값이 아닌 경우na만약source이 값은na1을 사용한다면 0을 반환합니다replacement변수
매개변수
source(series int/float/bool/color) 실행해야 하는 일련 값replacement(series int/float/bool/color) 는 <unk>source <unk> 시리즈의 모든 <unk>na <unk>값의 값을 대체한다.
na
만약 NaN이라면, 테스트 값은 <unk>.
na(x)
값을 반환합니다.
x가 유효숫자가 아니라면 true (x는 NaN), 그렇지 않으면 false (x는 NaN) 이다.
int
na를 변환하거나 float값을 int로 단절한다.
int(x)
값을 반환합니다.
int 이후의 변수 값으로 변환한다.
이 부분도 참조하십시오.
float bool color string
float
n는 floating로 설정한다.
float(x)
값을 반환합니다.
float 후의 변수값으로 변환한다.
이 부분도 참조하십시오.
int bool color string
alert
실시간 K선 중에 호출될 때 알람 이벤트를 트리거하고, 이전에 알람 기능 이벤트에 기반한 알람을 알람 창구 대화 상자를 통해 알람 창구 대화 상자에 지표 또는 정책으로 생성한다.
alert(message, freq)
예를 들어
pine
// alert() example
ma = ta.sma(close, 14)
xUp = ta.crossover(close, ma)
if xUp
// Trigger the alert the first time a cross occurs during the real-time bar.
alert("Price (" + str.tostring(close) + ") crossed over MA (" + str.tostring(ma) + ").", alert.freq_once_per_bar)
plot(ma)
plotchar(xUp, "xUp", "▲", location.top, size = size.tiny)
매개변수
message(series string) 경보가 트리거될 때 전송되는 메시지.freq(input string) 트리핑 빈도。 가능한 값은: alert.freq_all (모든 함수 호출은 트리핑 알람), alert.freq_once_per_bar (K 줄의 첫 번째 함수 호출은 트리핑 알람), alert.freq_once_per_bar_close (함수 호출은 실시간 K 줄의 마지막 스크립트 연동 동안만 발생하면 닫으면 알람이 트리핑된다) 디폴트 값은 alert.freq_once_per_bar。
참고 사항
도움말 센터에서는 이러한 경고를 만드는 방법에 대해 설명합니다.
alertcondition과 달리, alert 호출은 추가적인 그림으로 간주되지 않는다.
함수 호출은 전 세계적 및 지역적 범위에 있을 수 있다.
함수 호출은 그래프에 아무 것도 표시하지 않습니다.
<unk>freq<unk> 매개 변수는 이 함수 호출이 사용되는 곳에서 발생하는 <unk>의 빈도에만 영향을 준다.
이 부분도 참조하십시오.
alertcondition
alertcondition
알림 조건을 생성하는 것은 알림을 생성하는 대화 상자에서 사용할 수 있습니다. 알림 조건을 생성하는 것은 알림을 생성하지 않습니다. 알림 조건을 생성하는 대화 상자에서 더 많은 옵션을 제공합니다. 또한, 알림 조건은 그래프에서 보이지 않습니다.
alertcondition(condition, title, message)
예를 들어
pine
// alertcondition
alertcondition(close >= open, title='Alert on Green Bar', message='Green Bar!')
매개변수
condition(series bool) 경보에 사용되는 일련의 bool값. True값은 경보를 트리거하고, false값은 경보를 트리거하지 않는다. 필요한 변수이다.title(const string) 경보 조건의 제목. 선택 가능한 파라미터.message(const string) 알람이 터지면 메시지를 표시하십시오.
참고 사항
참고로, Pine v4에서는 경고 조건 호출이 추가적인 그래프를 생성합니다. 각 스크립트의 출력 시리즈 수를 계산할 때, 이러한 모든 호출이 고려됩니다.
이 부분도 참조하십시오.
alert
indicator
호환하기 위해Trading View정책 코드는 실제로 호출할 필요가 없습니다.
이 부분도 참조하십시오.
strategy
time
time 함수는 지정된 시간 범위와 거래 시간에 대한 현재 K 선의 UNIX 시간을 반환하며, 거래 시간에 포함되지 않으면 NaN을 반환합니다. 참고: FMZ는 지원되지 않습니다.session변수
time(timeframe, session, timezone)
time(timeframe, session)
time(timeframe)
예를 들어
pine
timeinrange(res, sess) => not na(time(res, sess, "America/New_York")) ? 1 : 0
plot(timeinrange("1", "1300-1400"), color=color.red)
// This plots 1.0 at every start of 10 minute bar on a 1 minute chart:
newbar(res) => ta.change(time(res)) == 0 ? 0 : 1
plot(newbar("10"))
회담을 설정할 때, 여러분은 시간과 분 뿐만 아니라, 특정 주일 날짜도 지정할 수 있습니다.
날짜가 지정되지 않은 경우, 거래 시간대가 일요일 (1) 부터 토요일 (7) 까지 설정되어 있다고 가정합니다. 즉, 1100-2000<unk>은 1100-1200: 1234567<unk>과 동일합니다.
날짜를 지정하여 변경할 수 있습니다. 예를 들어, 주 7일 거래되는 상품과 24시간 거래되는 상품의 경우, 아래의 스크립트는 토요일과 일요일에는 색을 띄지 않습니다.
예를 들어
pine
// Time
t1 = time(timeframe.period, "0000-0000:23456")
bgcolor(t1 ? color.new(color.blue, 90) : na)
하나session매개 변수는 여러 개의 다른 거래 시간을 포함할 수 있으며, 코마로 구분된다. 예를 들어, 다음 스크립트는 10:00부터 11:00까지 그리고 14:00부터 15:00까지 (일요일에만) K선 도표를 강조합니다.
예를 들어
pine
// Time
t1 = time(timeframe.period, "1000-1100,1400-1500:23456")
bgcolor(t1 ? color.new(color.blue, 90) : na)
값을 반환합니다.
유닉스 시간
매개변수
timeframe(simple string) 시간 주기 △ 빈 문자열은 그래프의 현재 시간 주기 △로 해석된다.sessiontimezone(simple string)session매개 변수의 시간대。는 세션<unk>이 지정된 경우에만 사용할 수。 옵션。 기본값은 syminfo.timezone。 GMT 표기법 ((예: GMT-5<unk>) 또는 IANA 시간대 데이터베이스 이름 ((예: America/New_York<unk>) 을 사용하여 지정할 수。
참고 사항
UNIX 시간은 1970년 1월 1일 UTC 00:00:00부터 지난 밀리초수를 의미한다.
year
year(time)
year(time, timezone)
값을 반환합니다.
UNIX 시간을 제공하는 해 ((교환 시간대) <unk>
매개변수
time(series int) 밀리초 단위의 유닉스 시간timezone(series string) 선택 가능한 파라미트。 시간대。
참고 사항
UNIX 시간은 1970년 1월 1일 UTC 00:00:00 이후의 밀리초수이다. 기본적으로 시간대는 syminfo.timezone이다. 가능한 값을 타임스탬프로 확인할 수 있다.
참고로, 이 함수는 K 선의 개시 시간에 따라 연도를 반환한다. 야간 거래 시간 (예: EURUSD 월요일 거래 시간은 일요일 17:00 UTC-4에서 시작됩니다) 에 대해, 이 값은 거래 날의 연도보다 낮을 수 있다.
이 부분도 참조하십시오.
year time month dayofmonth dayofweek hour minute second
month
month(time)
month(time, timezone)
값을 반환합니다.
UNIX 시간을 제공하는 달 ((교환 시간대) <unk>
매개변수
time(series int) 밀리초 단위의 유닉스 시간timezone(series string) 선택 가능한 파라미트。 시간대。
참고 사항
UNIX 시간은 1970년 1월 1일 UTC 00:00:00 이후의 밀리초수이다. 기본적으로 시간대는 syminfo.timezone이다. 가능한 값을 타임스탬프로 확인할 수 있다.
참고로, 이 함수는 K 선의 개방 시간에 따라 달을 반환한다. 밤새 거래 시간 (예를 들어, EURUSD 월요일 거래 시간은 일요일 17:00 UTC-4에서 시작된다) 에 대해, 이 값은 거래일보다 낮을 수 있다.
이 부분도 참조하십시오.
month time year dayofmonth dayofweek hour minute second
hour
hour(time)
hour(time, timezone)
값을 반환합니다.
UNIX 시간을 제공하는 시간 ((교환 시간대) <unk>)
매개변수
time(series int) 밀리초 단위의 유닉스 시간timezone(series string) 선택 가능한 파라미트。 시간대。
참고 사항
UNIX 시간은 1970년 1월 1일 UTC 00:00:00 이후의 밀리초수이다. 기본적으로 시간대는 syminfo.timezone이다. 가능한 값을 타임스탬프로 확인할 수 있다.
이 부분도 참조하십시오.
hour time year month dayofmonth dayofweek minute second
minute
minute(time)
minute(time, timezone)
값을 반환합니다.
UNIX 시간을 제공하는 분 ((교환 시간대) <unk>)
매개변수
time(series int) 밀리초 단위의 유닉스 시간timezone(series string) 선택 가능한 파라미트。 시간대。
참고 사항
UNIX 시간은 1970년 1월 1일 UTC 00:00:00 이후의 밀리초수이다. 기본적으로 시간대는 syminfo.timezone이다. 가능한 값을 타임스탬프로 확인할 수 있다.
이 부분도 참조하십시오.
minute time year month dayofmonth dayofweek hour second
second
second(time)
second(time, timezone)
값을 반환합니다.
UNIX 시간을 제공 하는 초수 ((교환 시간대) <unk>)
매개변수
time(series int) 밀리초 단위의 유닉스 시간timezone(series string) 선택 가능한 파라미트。 시간대。
참고 사항
UNIX 시간은 1970년 1월 1일 UTC 00:00:00 이후의 밀리초수이다. 기본적으로 시간대는 syminfo.timezone이다. 가능한 값을 타임스탬프로 확인할 수 있다.
이 부분도 참조하십시오.
second time year month dayofmonth dayofweek hour minute
weekofyear
weekofyear(time)
weekofyear(time, timezone)
값을 반환합니다.
UNIX 시간 주기 ((교환 시간대) 을 제공한다.
매개변수
time(series int) 밀리초 단위의 유닉스 시간timezone(series string) 선택 가능한 파라미트。 시간대。
참고 사항
UNIX 시간은 1970년 1월 1일 UTC 00:00:00 이후의 밀리초수이다. 기본적으로 시간대는 syminfo.timezone이다. 가능한 값을 타임스탬프로 확인할 수 있다.
참고로, 이 함수는 K 선의 개방 시간에 따라 주일을 반환한다. 밤새 거래 시간 (예: EURUSD, 월요일 거래 시간은 일요일 17:00부터 시작됩니다) 에 대해, 이 값은 거래일보다 낮을 수 있다.
이 부분도 참조하십시오.
weekofyear time year month dayofmonth dayofweek hour minute second
dayofweek
dayofweek(time)
dayofweek(time, timezone)
값을 반환합니다.
UNIX 시간을 제공하는 주일 날짜 ((교환 시간대) <unk>)
매개변수
time(series int) 밀리초 단위의 유닉스 시간timezone(series string) 선택 가능한 파라미트。 시간대。
참고 사항
참고로, 이 함수는 K 선의 개방 시간에 따라 날짜를 반환한다. 밤새 거래 시간 (예: EURUSD 월요일 거래 시간은 일요일 17:00부터 시작된다) 에 대해, 이 값은 거래 날의 날짜보다 낮을 수 있다.
UNIX 시간은 1970년 1월 1일 UTC 00:00:00 이후의 밀리초수이다. 기본적으로 시간대는 syminfo.timezone이다. 가능한 값을 타임스탬프로 확인할 수 있다.
이 부분도 참조하십시오.
time dayofmonth
dayofmonth
dayofmonth(time)
dayofmonth(time, timezone)
값을 반환합니다.
UNIX 시간을 제공하는 월 날짜 ((교환 시간대) <unk>)
매개변수
time(series int) 밀리초 단위의 유닉스 시간timezone(series string) 선택 가능한 파라미트。 시간대。
참고 사항
UNIX 시간은 1970년 1월 1일 UTC 00:00:00 이후의 밀리초수이다. 기본적으로 시간대는 syminfo.timezone이다. 가능한 값을 타임스탬프로 확인할 수 있다.
참고로, 이 함수는 K 선의 개방 시간에 따라 날짜를 반환한다. 밤새 거래 시간 (예: EURUSD 월요일 거래 시간은 일요일 17:00 UTC-4에서 시작됩니다) 에 대해, 이 값은 거래 날의 날짜보다 낮을 수 있다.
timestamp
시간<unk> 기능은 UNIX 시간의 지정된 날짜와 시간을 반환한다.
timestamp(dateString)
timestamp(year, month, day, hour, minute, second)
timestamp(timezone, year, month, day, hour, minute, second)
예를 들어
pine
// timestamp
plot(timestamp(2016, 01, 19, 09, 30), linewidth=3, color=color.green)
plot(timestamp(syminfo.timezone, 2016, 01, 19, 09, 30), color=color.blue)
plot(timestamp(2016, 01, 19, 09, 30), color=color.yellow)
plot(timestamp("GMT+6", 2016, 01, 19, 09, 30))
plot(timestamp(2019, 06, 19, 09, 30, 15), color=color.lime)
plot(timestamp("GMT+3", 2019, 06, 19, 09, 30, 15), color=color.fuchsia)
plot(timestamp("Feb 01 2020 22:10:05"))
plot(timestamp("2011-10-10T14:48:00"))
plot(timestamp("04 Dec 1995 00:12:00 GMT+5"))
값을 반환합니다.
유닉스 시간
매개변수
timezone(series string) 시간대 △ 선택 △ 기본값은 syminfo.timezone △ GMT 표기법 ((예를 들어, GMT-5<unk>) 또는 IANA 시간대 데이터베이스 이름 ((예를 들어, America/New_York<unk>)) 을 사용하여 지정할 수 있다 △year(series int) 해month(series int) 달day(series int) 날짜hour(series int) (선택할 수 있는 변수) 시간. 기본값은 0minute(series int) (선택할 수 있는 변수) 분. 기본값은 0second(series int) (선택 가능한 변수) Second。 기본값은 0。dateString(const string) 날짜와 선택할 수 있는 시간대와 시간대를 포함하는 문자열이다. 그 형식은 IETF RFC 2822 또는 ISO 8601 표준에 따라 되어야 한다 ((<unk>DD MMM YYYY hh:mm:ss±hhmm<unk> 또는 ?? YYYYY-MM-DDThh:mm:ss±hh:mm<unk>, 따라서 ?? 2020-02-20 ?? 또는 ?? 2020-02-20 ??) ᅲ.ᅲ.ᅲ. 만약 시간이 제공되지 않으면 ?? 00:00 ?? 을 사용한다. 만약 시간대가 제공되지 않으면 GMT+0을 사용한다. 참고로, 이것은 함수의 일반적인 행동과는 달리 거래소가 있는 시간대의 시간을 반환한다.
참고 사항
UNIX 시간은 1970년 1월 1일 UTC 00:00:00부터 지난 밀리초수를 의미한다.
이 부분도 참조하십시오.
time timenow syminfo.timezone
fill
제공된 색을 사용하여 두 그림 또는 hline 사이의 배경을 채우십시오.
fill(hline1, hline2, color, title, editable, fillgaps, display)
fill(plot1, plot2, color, title, editable, show_last, fillgaps, display)
예를 들어
pine
h1 = hline(20)
h2 = hline(10)
fill(h1, h2, color=color.new(color.blue, 90))
p1 = plot(open)
p2 = plot(close)
fill(p1, p2, color=color.new(color.green, 90))
매개변수
hline1(hline) 첫 번째 hline 객체. 필요한 변수.hline2(hline) 두 번째 hline 객체. 필요한 변수.plot1(plot) 첫 번째 그림 객체. 필수 변수.plot2(plot) 두 번째 그림 객체. 필요한 변수.color(series color) 그림의 색. 'color = red' 또는 'color =#ff001a'와 같은 상수를 사용할 수 있고 'color = close >= open ? green: red'와 같은 복잡한 표현을 사용할 수 있습니다.title(const string) 개체 채우는 제목이 만들어졌습니다.editable(const bool) 만약 true라면, 채우기 스타일은 포맷 대화 상자에서 편집할 수 있다.show_last(input int) 만약 설정되어 있다면, 그래프를 채우는 k줄 수를 정의한다.fillgaps(const bool) 공백의 연속적인 채우기를 제어한다. 즉, plot() 호출 중 하나가 na값을 반환할 때. true로 설정하면 마지막 채우는 공백을 채우기를 계속한다.display(plot_display) 채워진 디스플레이 위치를 제어한다. 가능한 값은:display.none,display.all。 디스플레이.all。입니다.
이 부분도 참조하십시오.
plot barcolor bgcolor hline
hline
주어진 고정 가격 수준에서 수평선을 나타냅니다.
hline(price, title, color, linestyle, linewidth, editable, display)
예를 들어
pine
// input.hline
hline(3.14, title='Pi', color=color.blue, linestyle=hline.style_dotted, linewidth=2)
// You may fill the background between any two hlines with a fill() function:
h1 = hline(20)
h2 = hline(10)
fill(h1, h2, color=color.new(color.green, 90))
값을 반환합니다.
fill에 사용할 수 있는 hline 객체들.
매개변수
price(input int/float) 객체가 표시할 값은 △ 필수 변수 △title(const string) 객체의 제목color(input color) 렌딩 라인의 색. 반드시 상수 ((비표현식) 이어야 한다. 선택 가능한 파라미트이다.linestyle(hline_style) 렌딩 라인의 스타일。 가능한 값은: solid, dotted, dotted。 선택 가능한 파라미터。linewidth(input int) 렌딩 라인의 너비 <unk>. 기본값은 1 <unk>.editable(const bool) 만약 true라면,hline 스타일은 포맷 대화 상자에서 편집할 수 있다.display(plot_display) 컨트롤 라인의 표시 위치。 가능한 값은:display.none,display.all。 디폴트 display.all。overlay(const bool) FMZ 플랫폼 확장된 파라미터, 현재 함수를 설정하는 데 사용된다. 현재 함수가 메인 그래프 (설정 true) 또는 부그라프 (설정 false) 에 그림으로 표시되며, 기본값은 false이다. 이 파라미터를 지정하지 않으면 다음과 같이 나타납니다.strategy또는indicator~ 안에overlay이 문서를 클릭하면strategy또는indicator설정이 없습니다.overlay변수, 기본 변수대로 처리한다.
bgcolor
지정된 색으로 K 라인의 배경을 채우십시오.
bgcolor(color, offset, editable, show_last, title, display, overlay)
예를 들어
pine
// bgcolor example
bgcolor(close < open ? color.new(color.red,70) : color.new(color.green, 70))
매개변수
color(series color) 배경의 색을 채웁니다. 여러분은 ?? red ?? 또는 ?? #ff001a ?? 같은 상수를 사용할 수 있고 'close >= open ? green: red' 같은 복잡한 표현을 사용할 수 있습니다. 필수 파라미터를 사용합니다.offset(series int) k줄의 특정 수에 대해 왼쪽 또는 오른쪽으로 이동하는 색상 시리즈. 0을 기본으로 설정한다.editable(const bool) 만약 true라면, bgcolor 스타일은 포맷 대화 상자에서 편집할 수 있다.show_last(input int) 만약 설정되어 있다면, 그래프를 채우는 k줄 수를 정의한다.title(const string) bgcolor의 제목。 선택 가능한 파라미터。display(plot_display) bgcolor의 표시 위치를 제어한다. 가능한 값은:display.none,display.all。 디폴트 display.all。overlay(const bool) FMZ 플랫폼 확장된 파라미터, 현재 함수를 설정하는 데 사용된다. 현재 함수가 메인 그래프 (설정 true) 또는 부그라프 (설정 false) 에 그림으로 표시되며, 기본값은 false이다. 이 파라미터를 지정하지 않으면 다음과 같이 나타납니다.strategy또는indicator~ 안에overlay이 문서를 클릭하면strategy또는indicator설정이 없습니다.overlay변수, 기본 변수대로 처리한다.
이 부분도 참조하십시오.
plot
barcolor
K선 색을 설정한다.
barcolor(color, offset, editable, show_last, title, display)
예를 들어
pine
barcolor(close < open ? color.black : color.white)
매개변수
color(series color) K선 색 ᄂ. 당신은 <unk>red<unk> 또는 <unk>#ff001a<unk> 같은 상수를 사용할 수 있으며, 'close >= open ? green: red' 같은 복잡한 표현을 사용할 수 있습니다.offset(series int) k줄의 특정 수에 대해 왼쪽 또는 오른쪽으로 이동하는 색상 시리즈. 0을 기본으로 설정한다.editable(const bool) 만약 true라면, barcolor 스타일은 포맷 대화 상자에서 편집할 수 있다.show_last(input int) 만약 설정되어 있다면, 그래프를 채우는 k줄 수를 정의한다.title(const string) Barcolor 제목 ᅲ.ᅲdisplay(plot_display) K선 색상의 디스플레이 위치를 제어한다. 가능한 값은: display.none, display.all. 디스플레이.all.
이 부분도 참조하십시오.
bgcolor plot fill
error
PINE v4 버전과 호환됩니다.error기능과runtime.error동의합니다.
내장 변수
order
order.ascending
배열을 최소에서 최대까지 정렬하십시오.
유형
sort_order
이 부분도 참조하십시오.
array.new_float array.sort
order.descending
배열을 최대부터 최소까지 정렬하십시오.
유형
sort_order
이 부분도 참조하십시오.
array.new_float array.sort
timeframe
timeframe.isdaily
현재 해상도가 일일 해상도라면 true를 반환하고, 그렇지 않으면 false를 반환한다.
유형
simple bool
이 부분도 참조하십시오.
timeframe.isdwm timeframe.isintraday timeframe.isminutes timeframe.isseconds timeframe.isweekly timeframe.ismonthly
timeframe.isdwm
현재 해상도가 일일 또는 주간 또는 월간 해상도라면 true를 반환하고, 그렇지 않으면 false를 반환한다.
유형
simple bool
이 부분도 참조하십시오.
timeframe.isintraday timeframe.isminutes timeframe.isseconds timeframe.isdaily timeframe.isweekly timeframe.ismonthly
timeframe.isintraday
만약 현재 주기가 일 (일, 분, 초) 의 주기가 있다면, true를 반환하고, 그렇지 않으면 false를 반환한다.
유형
simple bool
이 부분도 참조하십시오.
timeframe.isminutes timeframe.isseconds timeframe.isdwm timeframe.isdaily timeframe.isweekly timeframe.ismonthly
timeframe.isminutes
현재 주기가 분주기인 경우 true를 반환하고, 그렇지 않은 경우 false를 반환한다.
유형
simple bool
이 부분도 참조하십시오.
timeframe.isdwm timeframe.isintraday timeframe.isseconds timeframe.isdaily timeframe.isweekly timeframe.ismonthly
timeframe.ismonthly
현재 해상도가 월간 해상도라면 true를 반환하고, 그렇지 않으면 false를 반환한다.
유형
simple bool
이 부분도 참조하십시오.
timeframe.isdwm timeframe.isintraday timeframe.isminutes timeframe.isseconds timeframe.isdaily timeframe.isweekly
timeframe.isseconds
현재 주기가 초인 경우 true를 반환하고, 그렇지 않으면 false를 반환합니다.
유형
simple bool
이 부분도 참조하십시오.
timeframe.isdwm timeframe.isintraday timeframe.isminutes timeframe.isdaily timeframe.isweekly timeframe.ismonthly
timeframe.isweekly
현재 해상도가 주당 해상도라면 true를 반환하고, 그렇지 않으면 false를 반환한다.
유형
simple bool
이 부분도 참조하십시오.
timeframe.isdwm timeframe.isintraday timeframe.isminutes timeframe.isseconds timeframe.isdaily timeframe.ismonthly
timeframe.multiplier
시간주기의 곱하기, 예를 들어 '60' - 60, 'D' - 1, '5D' - 5, '12M' - 12。
유형
simple int
이 부분도 참조하십시오.
syminfo.ticker syminfo.tickerid timeframe.period
timeframe.period
시간주기: 60분, D일, W주, M달, 5일, 12월, 1년, 3월, 1분
유형
simple string
이 부분도 참조하십시오.
syminfo.ticker syminfo.tickerid timeframe.multiplier
display
display.none
이름 상수, 그림의 표시 위치를 지정한다. 어디에도 표시되지 않는다. 경고 템플릿 메시지에서 사용할 수 있다.
유형
plot_display
이 부분도 참조하십시오.
plot plotshape plotchar
display.all
이름 상수, 그림의 위치를 지정한다. 모든 위치를 표시한다.
유형
plot_display
이 부분도 참조하십시오.
plot plotshape plotchar plotarrow plotbar plotcandle
shape
shape.xcross
plotshape 기능의 모양 스타일
유형
const string
이 부분도 참조하십시오.
plotshape
shape.cross
plotshape 기능의 모양 스타일
유형
const string
이 부분도 참조하십시오.
plotshape
shape.triangleup
plotshape 기능의 모양 스타일
유형
const string
이 부분도 참조하십시오.
plotshape
shape.triangledown
plotshape 기능의 모양 스타일
유형
const string
이 부분도 참조하십시오.
plotshape
shape.flag
plotshape 기능의 모양 스타일
유형
const string
이 부분도 참조하십시오.
plotshape
shape.circle
plotshape 기능의 모양 스타일
유형
const string
이 부분도 참조하십시오.
plotshape
shape.arrowup
plotshape 기능의 모양 스타일
유형
const string
이 부분도 참조하십시오.
plotshape
shape.arrowdown
plotshape 기능의 모양 스타일
유형
const string
이 부분도 참조하십시오.
plotshape
shape.labelup
plotshape 기능의 모양 스타일
유형
const string
이 부분도 참조하십시오.
plotshape
shape.labeldown
plotshape 기능의 모양 스타일
유형
const string
이 부분도 참조하십시오.
plotshape
shape.square
plotshape 기능의 모양 스타일
유형
const string
이 부분도 참조하십시오.
plotshape
shape.diamond
plotshape 기능의 모양 스타일
유형
const string
이 부분도 참조하십시오.
plotshape
color
color.aqua
#00BCD4 색상의 명칭 상수입니다.
유형
const color
color.black
#363A45 색상의 명칭 상수이다.
유형
const color
color.blue
#2962ff 색상의 명명 상수이다.
유형
const color
color.fuchsia
#E040FB 색상의 명칭 상수입니다.
유형
const color
color.gray
#787B86 색상의 명명 상수이다.
유형
const color
color.green
4CAF50 색상의 명칭 상수입니다.
유형
const color
color.lime
#00E676 색상의 명칭 상수입니다.
유형
const color
color.maroon
#880E4F 색상의 명명 상수
유형
const color
color.navy
#311B92 색상의 명명 상수이다.
유형
const color
color.olive
#808000 색상의 명칭 상수입니다.
유형
const color
color.orange
#FF9800 색상의 명칭 상수입니다.
유형
const color
color.purple
9C27B0 색상의 명칭 상수이다.
유형
const color
color.red
#FF5252 색상의 명칭 상수입니다.
유형
const color
color.silver
#B2B5BE 색상의 명칭 상수
유형
const color
color.teal
color.teal
#00897B 색상의 명명 상수입니다.
유형
const color
color.white
#FFFFFF 색깔의 명칭 상수입니다.
유형
const color
color.yellow
#FFEB3B 색상의 명칭 상수입니다.
유형
const color
plot
plot.style_line
'Line' 스타일의 명명 상수, plot 함수에서 사용style변수의 변수
유형
plot_style
이 부분도 참조하십시오.
plot plot.style_linebr plot.style_stepline plot.style_stepline_diamond plot.style_histogram plot.style_cross plot.style_area plot.style_areabr plot.style_columns plot.style_circles
plot.style_linebr
'Line With Breaks' 스타일의 명명 상수, plot 함수에서 사용style플롯.스타일_라인과 비슷하지만 데이터의 공백은 채우지 않는다.
유형
plot_style
이 부분도 참조하십시오.
plot plot.style_line plot.style_stepline plot.style_stepline_diamond plot.style_histogram plot.style_cross plot.style_area plot.style_areabr plot.style_columns plot.style_circles
plot.style_histogram
'Histogram' 형식의 명명 상수, plot 함수에서 사용style변수의 변수
유형
plot_style
이 부분도 참조하십시오.
plot plot.style_line plot.style_linebr plot.style_stepline plot.style_stepline_diamond plot.style_cross plot.style_area plot.style_areabr plot.style_columns plot.style_circles
plot.style_columns
'Columns' 형식의 명명 상수, plot 함수에서 사용style변수의 변수
유형
plot_style
이 부분도 참조하십시오.
plot plot.style_line plot.style_linebr plot.style_stepline plot.style_stepline_diamond plot.style_histogram plot.style_cross plot.style_area plot.style_areabr plot.style_circles
plot.style_circles
'Circles' 스타일의 명명 상수, plot 함수에서 사용style변수의 변수
유형
plot_style
이 부분도 참조하십시오.
plot plot.style_line plot.style_linebr plot.style_stepline plot.style_stepline_diamond plot.style_histogram plot.style_cross plot.style_area plot.style_areabr plot.style_columns
plot.style_area
'Area' 스타일의 명명 상수, plot 함수에서 사용style변수의 변수
유형
plot_style
이 부분도 참조하십시오.
plot plot.style_line plot.style_linebr plot.style_stepline plot.style_stepline_diamond plot.style_histogram plot.style_areabr plot.style_cross plot.style_columns plot.style_circles
plot.style_areabr
'Area With Breaks' 스타일의 명명 상수, plot 함수에서 사용style플롯.스타일_에리아와 비슷하지만 데이터의 빈 공간이 채우지 않습니다.
유형
plot_style
이 부분도 참조하십시오.
plot plot.style_line plot.style_linebr plot.style_stepline plot.style_stepline_diamond plot.style_histogram plot.style_cross plot.style_area plot.style_columns plot.style_circles
plot.style_cross
'Cross' 스타일의 명명 상수, plot 함수에서 사용style변수의 변수
유형
plot_style
이 부분도 참조하십시오.
plot plot.style_line plot.style_linebr plot.style_stepline plot.style_stepline_diamond plot.style_histogram plot.style_area plot.style_areabr plot.style_columns plot.style_circles
plot.style_stepline
'Step Line' 스타일의 명명 상수, plot 함수에서 사용style변수의 변수
유형
plot_style
이 부분도 참조하십시오.
plot plot.style_stepline_diamond plot.style_linebr plot.style_histogram plot.style_cross plot.style_area plot.style_areabr plot.style_columns plot.style_circles
plot.style_stepline_diamond
'Step Line With Diamonds' 스타일의 명칭 상수, plot 함수에서 사용style변수의 변수。는 plot.style_stepline와 비슷하며, 데이터 변화 이외에도 <unk>형으로 표시된다。
유형
plot_style
이 부분도 참조하십시오.
plot plot.style_line plot.style_linebr plot.style_histogram plot.style_cross plot.style_area plot.style_areabr plot.style_columns plot.style_circles
location
location.abovebar
location.abovebar
plotshape,plotchar 함수의 위치 값。 모양은 주 시리즈 k 선 위에 그려진다。
유형
const string
이 부분도 참조하십시오.
plotshape plotchar location.belowbar location.top location.bottom location.absolute
location.belowbar
plotshape,plotchar 함수의 위치값. 모양은 주요 시리즈 k의 아래로 그려진다.
유형
const string
이 부분도 참조하십시오.
plotshape plotchar location.abovebar location.top location.bottom location.absolute
location.top
plotshape, plotchar 기능의 위치값. 모양은 상단 그래프 경계 근처에 그려진다.
유형
const string
이 부분도 참조하십시오.
plotshape plotchar location.abovebar location.belowbar location.bottom location.absolute
location.bottom
plotshape,plotchar 기능의 위치값. 모양은 바닥의 도표 경계 근처에 그려진다.
유형
const string
이 부분도 참조하십시오.
plotshape plotchar location.abovebar location.belowbar location.top location.absolute
location.absolute
plotshape, plotchar 기능의 위치값. 모양은 차트에 그려지고, 지표값을 가격 좌표로 사용합니다.
유형
const string
이 부분도 참조하십시오.
plotshape plotchar location.abovebar location.belowbar location.top location.bottom
size
size.auto
size.auto
plotshape,plotchar 기능의 크기 값. 모양의 크기는 자동으로 k 선의 크기에 적응한다.
유형
const string
이 부분도 참조하십시오.
plotshape plotchar size.tiny size.small size.normal size.large size.huge
size.tiny
plotshape,plotchar 기능의 크기의 값. 모양의 크기는 미세하다.
유형
const string
이 부분도 참조하십시오.
plotshape plotchar size.auto size.small size.normal size.large size.huge
size.small
plotshape,plotchar 기능의 크기의 값. 모양의 크기는 작다.
유형
const string
이 부분도 참조하십시오.
plotshape plotchar size.auto size.tiny size.normal size.large size.huge
size.normal
plotshape,plotchar 기능의 크기의 값. 모양의 크기는 일반적이다.
유형
const string
이 부분도 참조하십시오.
plotshape plotchar size.auto size.tiny size.small size.large size.huge
size.large
plotshape,plotchar 기능의 크기의 값. 모양의 크기는 큰。
유형
const string
이 부분도 참조하십시오.
plotshape plotchar size.auto size.tiny size.small size.normal size.huge
size.huge
plotshape, plotchar 기능의 크기. 모양의 크기는 거대하다.
유형
const string
이 부분도 참조하십시오.
plotshape plotchar size.auto size.tiny size.small size.normal size.large
alert
alert.freq_once_per_bar
alert() 함수의 'freq' 변수와 함께 사용되는 명명 상수
K줄의 첫 번째 함수 호출이 알람을 <unk>니다.
유형
const string
이 부분도 참조하십시오.
alert
alert.freq_all
alert() 함수의 'freq' 변수와 함께 사용되는 명명 상수
모든 함수 호출이 알람을 <unk>니다.
유형
const string
이 부분도 참조하십시오.
alert
alert.freq_once_per_bar_close
alert() 함수의 'freq' 변수와 함께 사용되는 명명 상수
이 함수 호출은 실시간 K 라인의 마지막 스크립트 연산 동안만 발생하면, 종료 시에는 알람을 쏘아 올린다.
유형
const string
이 부분도 참조하십시오.
alert
format
format.inherit
이름 상수이다.
유형
const string
이 부분도 참조하십시오.
format.price format.volume
format.price
이름 상수이다.
유형
const string
참고 사항
format.price 이면, 기본 정확도 값을 설정한다. 당신은 지표 함수의 precision arguments를 사용하여 정확도 값을 변경할 수 있다.
이 부분도 참조하십시오.
format.inherit format.volume
format.volume
이름 상수이다.
유형
const string
이 부분도 참조하십시오.
format.inherit format.price
syminfo
syminfo.ticker
거래소 전자가 없는 상품 코드, 예를 들어 'MSFT'。
유형
simple string
이 부분도 참조하십시오.
syminfo.tickerid timeframe.period timeframe.multiplier
syminfo.tickerid
거래소 전용을 가진 상품 코드, 예를 들어 BATS:MSFT<unk>, NASDAQ:MSFT<unk>.
유형
simple string
이 부분도 참조하십시오.
syminfo.ticker timeframe.period timeframe.multiplier
syminfo.basecurrency
상품의 기본 통화. 상품 코드<unk> BTCUSD<unk>, 반환<unk> BTC<unk>.
유형
simple string
이 부분도 참조하십시오.
syminfo.currency syminfo.ticker
syminfo.currency
현재 상품의 통화. 반환 통화 코드: <unk> USD<unk>, <unk> EUR<unk> 등.
유형
simple string
이 부분도 참조하십시오.
syminfo.basecurrency syminfo.ticker
syminfo.type
현재 상품 코드의 유형。 가능한 값은 stock, futures, index, forex, crypto, fund, dr。
유형
simple string
이 부분도 참조하십시오.
syminfo.ticker
syminfo.mintick
현재 품종의 최소 측정값. FMZ에서, 디스크/검색 인터페이스에서 "Pine 언어 거래 클래스 라이브러리"에 있는 템플릿 파라미터가격 통화 정확도이 값을 제어할 수 있습니다.가격 통화 정확도2를 설정하면 거래시 가격이 소수점 두 번째 자리까지 정확하며, 이 때 가격의 최소 변화 단위는 0.01。syminfo.mintick의 값은 0.01。이다.
유형
simple float
이 부분도 참조하십시오.
syminfo.pointvalue
syminfo.pointvalue
현재 상품의 점값
유형
simple float
이 부분도 참조하십시오.
syminfo.mintick
syminfo.timezone
차트 주요 시리즈의 교환 시간대 <unk>. 가능한 값은 timestamp <unk> 참조.
유형
simple string
이 부분도 참조하십시오.
timestamp
barstate
barstate.islastconfirmedhistory
시장이 닫힐 때 스크립트가 데이터 세트의 마지막 K 라인에 실행되는 경우, 또는 스크립트가 실시간 K 라인에 앞서 K 라인에 실행되는 경우, 시장이 열리면 true 를 반환한다. 그렇지 않으면 false 를 반환한다.
유형
series bool
참고 사항
이 변수를 이용한 파인스크립트 코드는 역사 기록과 실시간 데이터에 대해 다른 계산을 할 수 있다.
이 변수/함수를 사용하면 지표가 다시 그려질 수 있습니다.
이 부분도 참조하십시오.
barstate.isfirst barstate.islast barstate.ishistory barstate.isrealtime barstate.isnew
barstate.isnew
만약 스크립트가 현재 새로운 k 라인에서 계산하고 있다면, true를 반환하고, 그렇지 않으면 false를 반환한다.
유형
series bool
참고 사항
이 변수를 이용한 파인스크립트 코드는 역사 기록과 실시간 데이터에 대해 다른 계산을 할 수 있다.
이 변수/함수를 사용하면 지표가 다시 그려질 수 있습니다.
이 부분도 참조하십시오.
barstate.isfirst barstate.islast barstate.ishistory barstate.isrealtime barstate.isconfirmed barstate.islastconfirmedhistory
barstate.isfirst
현재 k줄이 k줄집의 첫 번째 k줄이라면 true를 반환하고, 그렇지 않으면 false를 반환한다.
유형
series bool
참고 사항
이 변수를 이용한 파인스크립트 코드는 역사 기록과 실시간 데이터에 대해 다른 계산을 할 수 있다.
이 변수/함수를 사용하면 지표가 다시 그려질 수 있습니다.
이 부분도 참조하십시오.
barstate.islast barstate.ishistory barstate.isrealtime barstate.isnew barstate.isconfirmed barstate.islastconfirmedhistory
barstate.islast
현재 k줄이 k줄집의 마지막 k줄이라면 true를 반환하고, 그렇지 않으면 false를 반환한다.
유형
series bool
참고 사항
이 변수를 이용한 파인스크립트 코드는 역사 기록과 실시간 데이터에 대해 다른 계산을 할 수 있다.
이 변수/함수를 사용하면 지표가 다시 그려질 수 있습니다.
이 부분도 참조하십시오.
barstate.isfirst barstate.ishistory barstate.isrealtime barstate.isnew barstate.isconfirmed barstate.islastconfirmedhistory
barstate.ishistory
현재 k줄이 역사 k줄이라면 true를 반환하고, 그렇지 않으면 false를 반환한다.
유형
series bool
참고 사항
이 변수를 이용한 파인스크립트 코드는 역사 기록과 실시간 데이터에 대해 다른 계산을 할 수 있다.
이 변수/함수를 사용하면 지표가 다시 그려질 수 있습니다.
이 부분도 참조하십시오.
barstate.isfirst barstate.islast barstate.isrealtime barstate.isnew barstate.isconfirmed barstate.islastconfirmedhistory
barstate.isconfirmed
만약 스크립트가 현재 k 라인의 마지막 () 종료) 업데이트를 계산하고 있다면, true를 반환한다. 다음 스크립트는 새로운 K 라인 데이터에서 계산된다.
유형
series bool
참고 사항
이 변수를 이용한 파인스크립트 코드는 역사 기록과 실시간 데이터에 대해 다른 계산을 할 수 있다.
request.security 표현식에서 barstate.isconfirmed를 사용하는 것은 권장되지 않습니다. request.security 요청의 값은 예측할 수 없습니다.
이 변수/함수를 사용하면 지표가 다시 그려질 수 있습니다.
이 부분도 참조하십시오.
barstate.isfirst barstate.islast barstate.ishistory barstate.isrealtime barstate.isnew barstate.islastconfirmedhistory
barstate.isrealtime
현재 k줄이 실제 k줄이라면 true를 반환하고, 그렇지 않으면 false를 반환한다.
유형
series bool
참고 사항
이 변수를 이용한 파인스크립트 코드는 역사 기록과 실시간 데이터에 대해 다른 계산을 할 수 있다.
이 변수/함수를 사용하면 지표가 다시 그려질 수 있습니다.
이 부분도 참조하십시오.
barstate.isfirst barstate.islast barstate.ishistory barstate.isnew barstate.isconfirmed barstate.islastconfirmedhistory
barstate.time
현재
ta
ta.accdist
축적/배포 지수
유형
series float
ta.iii
디스크의 강도 지수
유형
series float
예를 들어
pine
// Intraday Intensity Index
plot(ta.iii, color=color.yellow)
// the same on pine
f_iii() =>
(2 * close - high - low) / ((high - low) * volume)
plot(f_iii())
ta.nvi
음량 지표
유형
series float
예를 들어
pine
// Negative Volume Index
plot(ta.nvi, color=color.yellow)
// the same on pine
f_nvi() =>
float ta_nvi = 1.0
float prevNvi = (nz(ta_nvi[1], 0.0) == 0.0) ? 1.0: ta_nvi[1]
if nz(close, 0.0) == 0.0 or nz(close[1], 0.0) == 0.0
ta_nvi := prevNvi
else
ta_nvi := (volume < nz(volume[1], 0.0)) ? prevNvi + ((close - close[1]) / close[1]) * prevNvi : prevNvi
result = ta_nvi
plot(f_nvi())
ta.pvi
정량 지표
유형
series float
예를 들어
pine
// Positive Volume Index
plot(ta.pvi, color=color.yellow)
// the same on pine
f_pvi() =>
float ta_pvi = 1.0
float prevPvi = (nz(ta_pvi[1], 0.0) == 0.0) ? 1.0: ta_pvi[1]
if nz(close, 0.0) == 0.0 or nz(close[1], 0.0) == 0.0
ta_pvi := prevPvi
else
ta_pvi := (volume > nz(volume[1], 0.0)) ? prevPvi + ((close - close[1]) / close[1]) * prevPvi : prevPvi
result = ta_pvi
plot(f_pvi())
ta.obv
에너지 흐름 지표
유형
series float
예를 들어
pine
// On Balance Volume
plot(ta.obv, color=color.yellow)
// the same on pine
f_obv() =>
ta.cum(math.sign(ta.change(close)) * volume)
plot(f_obv())
ta.pvt
가격 동향 지표
유형
series float
예를 들어
pine
// Price-Volume Trend
plot(ta.pvt, color=color.yellow)
// the same on pine
f_pvt() =>
ta.cum((ta.change(close) / close[1]) * volume)
plot(f_pvt())
ta.wad
윌리엄 도어 항공력계.
유형
series float
예를 들어
pine
// Williams Accumulation/Distribution
plot(ta.wad, color=color.yellow)
// the same on pine
f_wad() =>
trueHigh = math.max(high, close[1])
trueLow = math.min(low, close[1])
mom = ta.change(close)
gain = (mom > 0) ? close - trueLow : (mom < 0) ? close - trueHigh : 0
ta.cum(gain)
plot(f_wad())
ta.wvad
윌리엄 변이 분산량.
유형
series float
예를 들어
pine
// Williams Variable Accumulation/Distribution
plot(ta.wvad, color=color.yellow)
// the same on pine
f_wvad() =>
(close - open) / (high - low) * volume
plot(f_wvad())
math
math.e
오라 숫자의 명칭 상수이다. 그것은 2.7182818284590452에 해당한다.
유형
const float
이 부분도 참조하십시오.
math.phi math.pi math.rphi
math.phi
황금분할의 명칭 상수 △는 1.6180339887498948 △과 같다.
유형
const float
이 부분도 참조하십시오.
math.e math.pi math.rphi
math.pi
아키메데스 상수의 명칭 상수이다. 그것은 3.1415926535897932에 해당한다.
유형
const float
이 부분도 참조하십시오.
math.e math.phi math.rphi
math.rphi
황금분비율의 명칭 상수이다. 그것은 0.6180339887498948에 해당한다.
유형
const float
이 부분도 참조하십시오.
math.e math.pi math.phi
strategy
strategy.equity
현재 권익 ((strategy.initial_capital + strategy.netprofit + strategy.openprofit) <unk>)
유형
series float
이 부분도 참조하십시오.
strategy.netprofit strategy.openprofit strategy.position_size
strategy.position_size
현재 시장 포지션의 방향과 규모. 값> 0이면 시장 포지션이 길다. 값<0이면 시장 포지션이 짧다. 절대 값은 거래 중인 계약/주식/손/단위 수 (위치 크기) 이다.
유형
series float
이 부분도 참조하십시오.
strategy.position_avg_price
strategy.position_avg_price
현재 시장 위치 평균 입시 가격 <unk>. 시장 위기가 평평하면, NaN<unk>은 후퇴한다.
설명하다
FMZ PINE 스크립트의 평균 가격은 모두 수료가 포함된 가격이다. 예를 들어: 하청 가격은 8000, 판매 방향, 수량 1개, 매매 후 평균 가격은 8000이 아니라 8000보다 낮다.
유형
series float
이 부분도 참조하십시오.
strategy.position_size
strategy.long
다중 방향
유형
strategy_direction
이 부분도 참조하십시오.
strategy.entry strategy.exit
strategy.short
공허함 방향
유형
strategy_direction
이 부분도 참조하십시오.
strategy.entry strategy.exit
strategy.closedtrades
전체 거래 간격에서 닫힌 거래의 수
유형
series int
이 부분도 참조하십시오.
strategy.position_size strategy.opentrades
strategy.opentrades
닫히지 않거나 계속 보유한 거래의 수. 그렇지 않으면 0을 표시합니다.
유형
series int
이 부분도 참조하십시오.
strategy.position_size
strategy.netprofit
모든 거래의 총 통화 가치
유형
series float
이 부분도 참조하십시오.
strategy.openprofit strategy.position_size strategy.grossprofit
strategy.grossprofit
모든 거래의 총 통화 가치
유형
series float
이 부분도 참조하십시오.
strategy.netprofit
strategy.openprofit
현재 포지션이 없는 상태에서 실현되지 않은 손실.
유형
series float
이 부분도 참조하십시오.
strategy.netprofit strategy.position_size
strategy.direction.long
더 많은 것을 할 수 있는 전략
유형
const string
이 부분도 참조하십시오.
strategy.risk.allow_entry_in
strategy.direction.short
이 전략은 무효입니다.
유형
const string
이 부분도 참조하십시오.
strategy.risk.allow_entry_in
strategy.direction.all
이 전략은 더 많은 것을 할 수 있고, 더 많은 것을 할 수 있는 것을 허용합니다.
유형
const string
이 부분도 참조하십시오.
strategy.risk.allow_entry_in
dayofweek
dayofweek
교환 시간대의 현재 k선 시간의 주.
유형
series int
참고 사항
참고로, 이 변수는 K 선의 개방 시간에 따라 날을 반환한다. 밤새 거래 시간 (예: EURUSD, 월요일 거래 시간은 일요일 17:00부터 시작된다) 에 대해, 이 값은 거래 날보다 낮을 수 있다.
당신은 dayofweek.sunday, dayofweek.monday, dayofweek.tuesday, dayofweek.wednesday, dayofweek.thursday, dayofweek.friday 및 dayofweek.saturday 변수를 사용하여 비교할 수 있습니다.
이 부분도 참조하십시오.
time dayofmonth
dayofweek.sunday
dayofweek 함수의 반환값과 dayofweek 변수의 값의 명명 상수이다.
유형
const int
이 부분도 참조하십시오.
dayofweek.monday dayofweek.tuesday dayofweek.wednesday dayofweek.thursday dayofweek.friday dayofweek.saturday
dayofweek.monday
dayofweek 함수의 반환값과 dayofweek 변수의 값의 명명 상수이다.
유형
const int
이 부분도 참조하십시오.
dayofweek.sunday dayofweek.tuesday dayofweek.wednesday dayofweek.thursday dayofweek.friday dayofweek.saturday
dayofweek.tuesday
dayofweek 함수의 반환값과 dayofweek 변수의 값의 명명 상수이다.
유형
const int
이 부분도 참조하십시오.
dayofweek.sunday dayofweek.monday dayofweek.wednesday dayofweek.thursday dayofweek.friday dayofweek.saturday
dayofweek.wednesday
dayofweek 함수의 반환값과 dayofweek 변수의 값의 명명 상수이다.
유형
const int
이 부분도 참조하십시오.
dayofweek.sunday dayofweek.monday dayofweek.tuesday dayofweek.thursday dayofweek.friday dayofweek.saturday
dayofweek.thursday
dayofweek 함수의 반환값과 dayofweek 변수의 값의 명명 상수이다.
유형
const int
이 부분도 참조하십시오.
dayofweek.sunday dayofweek.monday dayofweek.tuesday dayofweek.wednesday dayofweek.friday dayofweek.saturday
dayofweek.friday
dayofweek 함수의 반환값과 dayofweek 변수의 값의 명명 상수이다.
유형
const int
이 부분도 참조하십시오.
dayofweek.sunday dayofweek.monday dayofweek.tuesday dayofweek.wednesday dayofweek.thursday dayofweek.saturday
dayofweek.saturday
dayofweek 함수의 반환값과 dayofweek 변수의 값의 명명 상수이다.
유형
const int
이 부분도 참조하십시오.
dayofweek.sunday dayofweek.monday dayofweek.tuesday dayofweek.wednesday dayofweek.thursday dayofweek.friday
hline
hline.style_dashed
Hline 함수의 점무늬 스타일의 명명 상수이다.
유형
hline_style
이 부분도 참조하십시오.
hline.style_solid hline.style_dotted
hline.style_dotted
hline.style_dotted
Hline 함수의 점실선형의 명명 상수이다.
유형
hline_style
이 부분도 참조하십시오.
hline.style_solid hline.style_dashed
hline.style_solid
Hline 함수의 정중심선형의 명명 상수이다.
유형
hline_style
이 부분도 참조하십시오.
hline.style_dotted hline.style_dashed
barmerge
barmerge.gaps_on
요청된 데이터 통합 전략에 △△△△△△△△△△△△△△△△△△△△△△△△△△△△△△△△△△△△△△△△△△△△△△△△△△△△△△△△△△△△△△△△△△△△△△△△△△△△△△△△△△△△△△△△△△△△△△△△△△△△△△△△△△△△△△△△△△△△△△△△△△△△△△△△△△△△△△△△△△△△△△△△△△△△△△△△△△△△△△△△△△△△△△△△△△△△△△△△△△△△△△△△△△△△△△△△△△△△△△△△△△△△△△△△△△△△△△△△△△△△△△△△△△△△△△△△△△△△△△△△△△△△△△△△
유형
barmerge_gaps
이 부분도 참조하십시오.
request.security barmerge.gaps_off
barmerge.gaps_off
병합이 요청된 데이터에 대한 전략. 데이터들은 연속적으로 병합되며, 모든 틈은 이전 가장 최근의 현존하는 값으로 채워진다.
유형
barmerge_gaps
이 부분도 참조하십시오.
request.security barmerge.gaps_on
barmerge.lookahead_on
통합된 데이터 위치를 요청하는 전략. 요청된 바리그램과 현재 바리그램은 k선 오픈 시간에 따라 통합된다. 이러한 통합 전략은 미래 <unk>에서 데이터를 얻는 데이터 계산 역사에 부정적인 영향을 미칠 수 있다. 이것은 역행 테스트 전략에서 받아들여지지 않지만 지표에서 사용할 수 있다.
유형
barmerge_lookahead
이 부분도 참조하십시오.
request.security barmerge.lookahead_off
barmerge.lookahead_off
통합된 데이터 위치를 요청하는 전략. 요청된 바리그램과 현재 바리그램은 k선 종료 시간에 따라 통합된다. 이러한 통합 전략은 <unk> 미래<unk>에서 데이터를 얻는 데이터 계산 역사의 영향을 금지한다.
유형
barmerge_lookahead
이 부분도 참조하십시오.
request.security barmerge.lookahead_on
others
hl2
[최고 가격 + 최저 가격]/2의 단축키
유형
series float
이 부분도 참조하십시오.
open high low close volume time hlc3 hlcc4 ohlc4
hlc3
[최고 가격+최저 가격+폐쇄 가격]/3의 단축키
유형
series float
이 부분도 참조하십시오.
open high low close volume time hl2 hlcc4 ohlc4
hlcc4
[고 + 저 + 끝 + 끝]/4의 단축키
유형
series float
이 부분도 참조하십시오.
open high low close volume time hl2 hlc3 ohlc4
ohlc4
[오프닝 가격 + 최고 가격 + 최저 가격 + 클로즈 가격]/4의 단축키
유형
series float
이 부분도 참조하십시오.
open high low close volume time hl2 hlc3 hlcc4
na
Double.NaN 값 (비 숫자) <unk>
유형
simple na
예를 들어
pine
// na
plot(bar_index < 10 ? na : close) // CORRECT
plot(close == na ? close[1] : close) // INCORRECT!
plot(na(close) ? close[1] : close) // CORRECT
참고 사항
NaN () 는 NaN () 의 값과 NaN () 의 값을 비교하는 데 사용된다. NaN () 는 NaN () 의 값과 NaN () 의 값을 비교하는 데 사용된다.
이 부분도 참조하십시오.
na
bar_index
현재 가격 막대 지수 <unk>. 번호는 0에서 시작하여 첫 번째 항목의 인덱스는 0 <unk>.
유형
series int
예를 들어
pine
// bar_index
plot(bar_index)
plot(bar_index > 5000 ? close : 0)
참고 사항
참고로, bar_index은 버전 4의 n 변수를 대체했다.
참고로, K 인덱스는 첫 번째 역사 K 선부터 0 ≠ 0 ≠ 0 ≠ 0 ≠ 0 ≠ 0 ≠ 0 ≠ 0 ≠ 0 ≠ 0 ≠ 0 ≠ 0 ≠ 0 ≠ 0 ≠ 0 ≠ 0
이 변수/함수를 사용하면 지표가 다시 그려질 수 있습니다.
이 부분도 참조하십시오.
barstate.isfirst barstate.islast barstate.isrealtime
last_bar_index
마지막 K 선의 인덱스. K 선은 첫 번째 K 선에서 0으로 시작합니다.
유형
series int
예를 들어
strategy("Mark Last X Bars For Backtesting", overlay = true, calc_on_every_tick = true)
lastBarsFilterInput = input.int(100, "Bars Count:")
// Here, we store the 'last_bar_index' value that is known from the beginning of the script's calculation.
// The 'last_bar_index' will change when new real-time bars appear, so we declare 'lastbar' with the 'var' keyword.
var lastbar = last_bar_index
// Check if the current bar_index is 'lastBarsFilterInput' removed from the last bar on the chart, or the chart is traded in real-time.
allowedToTrade = (lastbar - bar_index <= lastBarsFilterInput) or barstate.isrealtime
bgcolor(allowedToTrade ? color.new(color.green, 80) : na)
값을 반환합니다.
클로즈오브의 마지막 역사 K 인덱스, 또는 클로즈오브의 실시간 K 인덱스
참고 사항
이 변수를 사용하면 지표가 다시 그려질 수 있습니다.
이 부분도 참조하십시오.
bar_index last_bar_time barstate.ishistory barstate.isrealtime
time
UNIX 형식의 현재 k선 시간。 이것은 1970년 1월 1일 00:00:00 UTC 이후의 밀리초수。
timenow
UNIX 포맷의 현재 시간. 1970년 1월 1일 00:00:00 UTC 이후의 밀리초수이다.
유형
series int
참고 사항
이 변수/함수를 사용하면 지표가 다시 그려질 수 있습니다.
이 부분도 참조하십시오.
timestamp time dayofmonth dayofweek
유형
series int
참고 사항
참고로 이 변수는 K 선의 개시 시간에 따라 시간<unk>을 반환한다. 따라서, 야간 거래 시간 (예: EURUSD, 월요일 시간대는 일요일 17:00부터 시작된다) 에 대해, 이 변수는 거래일 지정 날짜 이전의 시간을 반환할 수 있다. 예를 들어, EURUSD에서, ?? dayofmonth (예: time) ?? 은 거래일 날짜보다 낮아질 수 있다. 왜냐하면 현재 날짜의 K 선은 실제로 전날 열렸기 때문이다.
이 부분도 참조하십시오.
time dayofmonth dayofweek
year
교환 시간대의 현재 연도 k선
유형
series int
참고 사항
참고로, 이 변수는 K 선의 개시 시간에 따라 연도를 반환한다. 밤새 거래 시간 (예: EURUSD, 월요일 거래 시간은 일요일 17:00부터 시작된다) 에 대해, 이 값은 거래 날의 연도보다 낮을 수 있다.
이 부분도 참조하십시오.
year time month weekofyear dayofmonth dayofweek hour minute second
month
거래소 시간대의 현재 달선 k
유형
series int
참고 사항
참고로, 이 변수는 K 선의 개시 시간에 따라 달을 반환한다. 밤새 거래 시간 (예: EURUSD, 월요일 거래 시간은 일요일 17:00부터 시작된다) 에 대해, 이 값은 거래 날짜의 달보다 낮을 수 있다.
이 부분도 참조하십시오.
month time year weekofyear dayofmonth dayofweek hour minute second
hour
거래소 시간대의 현재 시간 k선.
유형
series int
이 부분도 참조하십시오.
hour time year month weekofyear dayofmonth dayofweek minute second
minute
거래소 시간대의 현재 분 k선
유형
series int
이 부분도 참조하십시오.
minute time year month weekofyear dayofmonth dayofweek hour second
second
거래소 시간대의 현재 초선 k선
유형
series int
이 부분도 참조하십시오.
second time year month weekofyear dayofmonth dayofweek hour minute
open
현재 오픈 가격.
유형
series float
참고 사항
괄호 연산자를 사용할 수 있습니다.[[ ]은 이전 값, 예를 들어 △ open[1],open[2]。
이 부분도 참조하십시오.
high low close volume time hl2 hlc3 hlcc4 ohlc4
high
현재 최고 가격.
유형
series float
참고 사항
괄호 연산자를 사용할 수 있습니다.[[]은 이전 값, 예를 들어 <unk> high로 이동합니다.[1],high[2]。
이 부분도 참조하십시오.
open low close volume time hl2 hlc3 hlcc4 ohlc4
low
현재 최저 가격.
유형
series float
참고 사항
괄호 연산자를 사용할 수 있습니다.[[ ]은 이전 값, 예를 들어 <unk> low로 이동합니다.[1],low[2]。
이 부분도 참조하십시오.
open high close volume time hl2 hlc3 hlcc4 ohlc4
close
현재 K 라인이 닫힌 시점의 종결 가격, 또는 아직 완료되지 않은 실시간 K 라인의 마지막 거래 가격.
유형
series float
참고 사항
괄호 연산자를 사용할 수 있습니다.[[] 이전 값, 예를 들어 <unk> close[1],close[2]。
이 부분도 참조하십시오.
open high low volume time hl2 hlc3 hlcc4 ohlc4
volume
현재 K선 통행량.
유형
series float
참고 사항
괄호 연산자를 사용할 수 있습니다.[[] 이전 값, 예를 들어, △ volume[1],volume[2]。
이 부분도 참조하십시오.
open high low close time hl2 hlc3 hlcc4 ohlc4
weekofyear
교환 시간대의 현재 k선 시간대의 주수
유형
series int
참고 사항
참고로, 이 변수는 K 선의 개시 시간에 따라 주로 돌아갑니다. 밤새 거래 시간 (예를 들어 EURUSD, 월요일 거래 시간은 일요일 17:00에서 시작됩니다) 에 대해, 이 값은 거래 날의 주보다 낮을 수 있습니다.
이 부분도 참조하십시오.
weekofyear time year month dayofmonth dayofweek hour minute second
dayofmonth
교환 시간대의 현재 k선 시간의 날짜.
유형
series int
참고 사항
참고로, 이 변수는 K 선의 개방 시간에 따라 날을 반환한다. 밤새 거래 시간 (예: EURUSD, 월요일 거래 시간은 일요일 17:00부터 시작된다) 에 대해, 이 값은 거래 날보다 낮을 수 있다.


- 1