더블 EMA 골든 크로스와 데스 크로스 트레이딩 전략


생성 날짜: 2023-10-17 13:56:54 마지막으로 수정됨: 2023-10-17 13:56:54
복사: 0 클릭수: 709
avatar of ChaoZhang ChaoZhang
1
집중하다
1617
수행원

더블 EMA 골든 크로스와 데스 크로스 트레이딩 전략

개요

이 전략은 두 개의 EMA 일률선의 황금 포크 사각형을 사용하여 입점과 출구를 판단한다. 구체적으로, 빠른 EMA 라인이 하향에서 느린 EMA 라인을 돌파 할 때 황금 포크 신호를 생성하고, 더 많이 한다. 빠른 EMA 라인이 상향에서 하향으로 느린 EMA 라인을 돌파 할 때 죽은 포크 신호를 생성하고, 공백한다. 이 전략은 간단하고 쉽게 실행되며, 매우 일반적인 거래 전략이다.

전략 원칙

이 전략의 핵심 코드는 다음과 같습니다.

fast = input(25, title="Fast") 
slow = input(75, title="Slow")

matype1=ema(source, fast)
matype2=ema(source, slow)

longCondition = crossover(matype1, matype2) 
shortCondition = crossunder(matype1, matype2)

if (longCondition)
    strategy.entry("Long", strategy.long)

if (shortCondition)  
    strategy.entry("Short", strategy.short)

이 전략은 먼저 빠르게 두 개의 EMA 평균선을 설정하고, 그 중 빠른 EMA 라인의 주기가 25이고, 느린 EMA 라인의 주기가 75이다. 그리고 두 개의 EMA 라인의 값을 계산한다. 빠른 EMA 라인이 아래쪽에서 느린 EMA 라인을 뚫을 때, longCondition 조건이 참이다; 빠른 EMA 라인이 위쪽에서 아래쪽에서 느린 EMA 라인을 뚫을 때, shortCondition 조건이 참이다.

이 전략은 EMA 평균선의 평평한 특성을 활용하여 시장 노이즈를 효과적으로 필터링 할 수 있으며 동향의 변화를 빠르게 포착 할 수 있습니다. 두 개의 EMA 평균선 사이의 금색 사다리 사다리 교차는 강력한 거래 신호로 거래 위험을 효과적으로 제어 할 수 있습니다.

우위 분석

이 전략에는 다음과 같은 장점이 있습니다.

  1. 운영 방식은 간단하고 직관적이며, 이해하기 쉽다.

  2. 시장의 변동을 평형하기 위해 EMA를 사용하여 False Signal를 효과적으로 필터링하십시오.

  3. 골드 포크는 강력한 거래 신호로 위험을 효과적으로 조절할 수 있다.

  4. 다양한 시장 환경에 적용할 수 있는 EMA 주기를 유연하게 조정할 수 있다.

  5. 다른 기술 지표와 함께 쉽게 사용할 수 있습니다.

  6. EMA 파라미터를 최적화하여 더 나은 전략 효과를 얻을 수 있습니다.

위험 분석

이 전략에는 몇 가지 위험도 있습니다.

  1. 위기상황에서 EMA가 교차하는 경우가 많아서 무효 거래 신호가 많이 발생한다.

  2. EMA는 지연되어 있으며, 단선 기회를 놓칠 수 있습니다.

  3. EMA 교차만으로 트렌드 전환점을 결정할 수 없으며, 일정 수익 상한이 존재한다.

  4. 고정된 EMA 주기는 시장의 변화에 적응할 수 없다.

  5. 더 많은 자금 지원이 필요합니다. 그렇지 않으면 파생의 위험이 있습니다.

  6. 단독 손실이 큰 경우, 엄격한 손해제한이 필요합니다.

최적화 방향

이 전략은 다음과 같은 부분에서 최적화될 수 있습니다.

  1. 다양한 시장 상황에 맞게 EMA 주기의 매개 변수를 최적화한다.

  2. MACD, 브린 띠 등과 같은 다른 지표 필터를 추가하여 신호 품질을 향상시킵니다.

  3. ATR 상쇄, ADX 등과 같은 트렌드 판단 지표를 추가하고 무효 거래를 줄입니다.

  4. 더 많은 시간 주기의 분석과 함께 추세 방향을 판단하십시오.

  5. 기계 학습 방법을 사용하여 EMA 주기를 동적으로 최적화하십시오.

  6. 포지션 관리를 최적화하여 리스크를 제어한다.

  7. 단독 손실을 줄이기 위해 손해 중지 전략을 최적화하십시오.

요약하다

이 전략은 쌍 EMA 평행선의 황금 포크 사형 포크 교차를 거래 신호로 사용하여 고전적 인 추세를 따르는 전략을 형성합니다. 이 전략은 간단하고 쉽게 작동하며 다른 기술 지표와 쉽게 결합되어 추세를 판단하는 데 필요한 인원이 많지 않은 투자자에게 적합합니다.
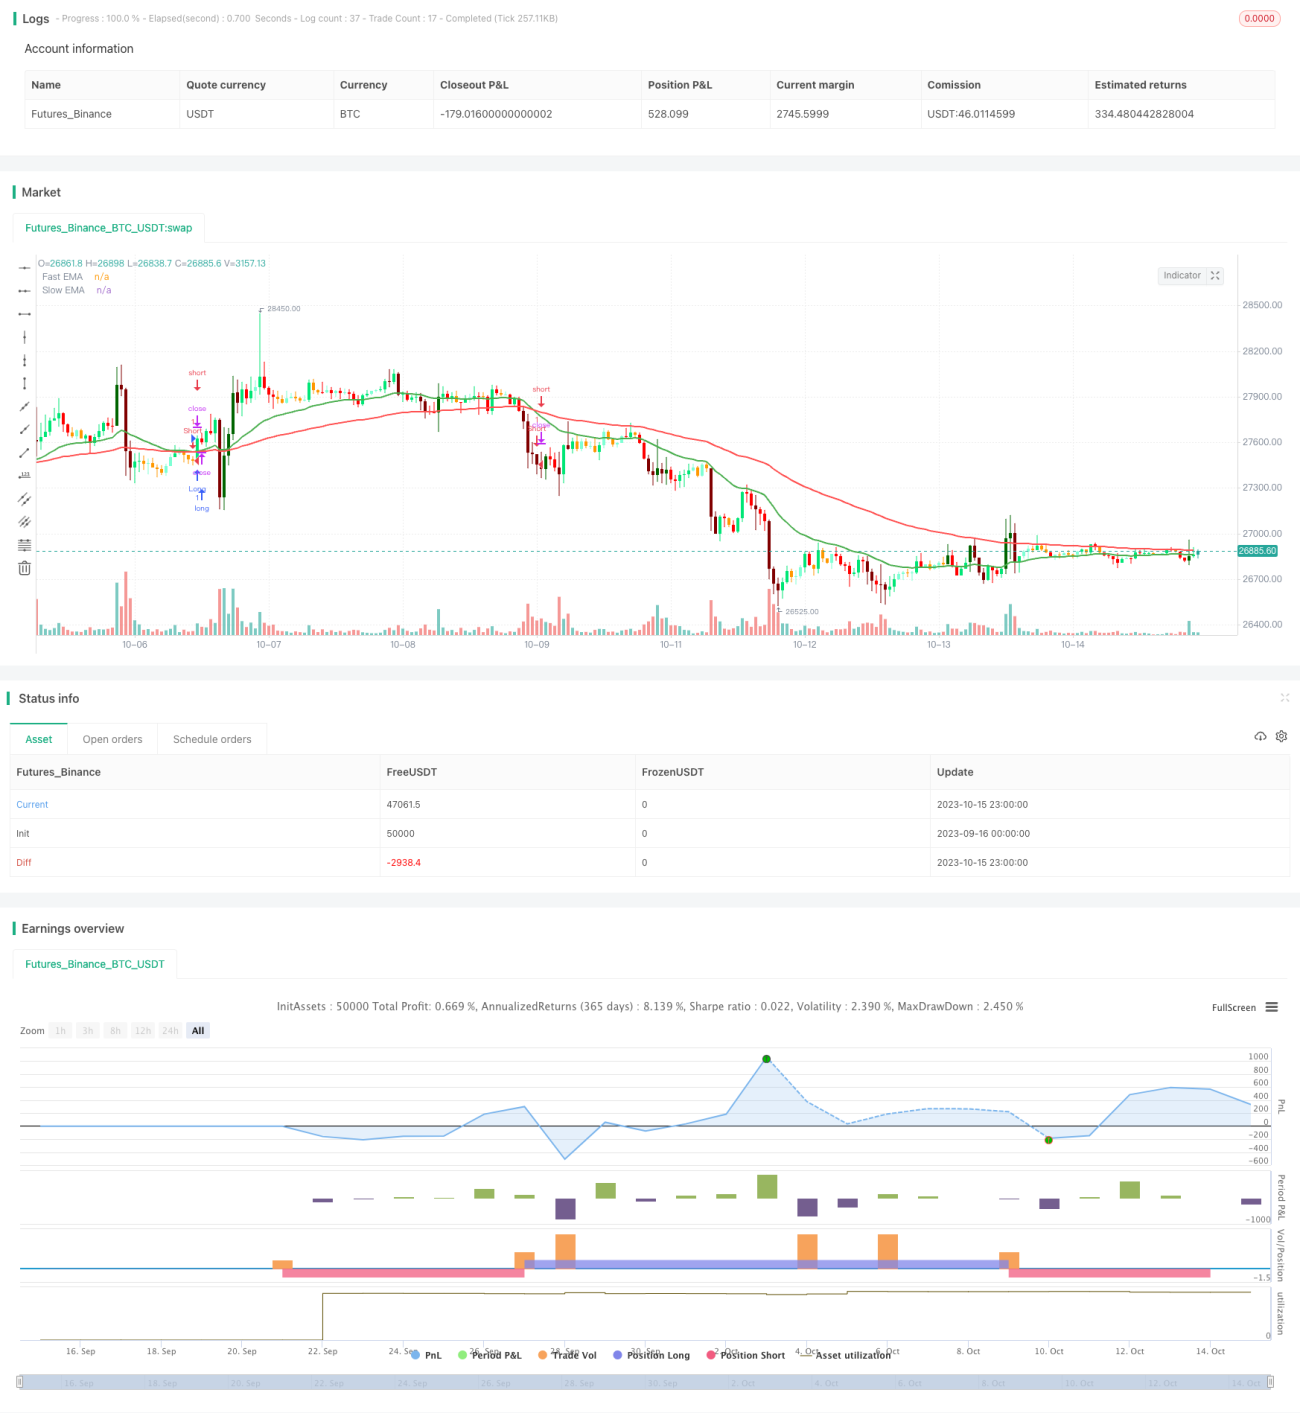
전략 소스 코드
/*backtest
start: 2023-09-16 00:00:00
end: 2023-10-16 00:00:00
period: 1h
basePeriod: 15m
exchanges: [{"eid":"Futures_Binance","currency":"BTC_USDT"}]
*/

// This source code is subject to the terms of the Mozilla Public License 2.0 at https://mozilla.org/MPL/2.0/
// Double EMA CROSS By © EmreE (Emre Ertürk) Also thx for KivancOzbilgic color based bars

//@version=4
strategy(title="Double EMA CROSS", shorttitle="DEC", overlay=true)

matype = input("ema")
hidema = input(false)
sourcetype = input(close, title="Source Type")
source=close
 
// STEP 1:
// Configure backtest start date with inputs
startDate = input(title="Start Date", type=input.integer,
     defval=1, minval=1, maxval=231)
startMonth = input(title="Start Month", type=input.integer,
     defval=1, minval=1, maxval=12) 
startYear = input(title="Start Year", type=input.integer,
     defval=2020, minval=1800, maxval=2100)

// STEP 2:
// See if this bar's time happened on/after start date
afterStartDate = (time >= timestamp(syminfo.timezone,
     startYear, startMonth, startDate, 0, 0))

fast = input(25, title="Fast")
slow = input(75, title="Slow")

matype1=ema(source, fast)
matype2=ema(source, slow)


signalcolor = source > matype2 ? color.blue : color.red
signal = cross(fast, slow) 


hizliema=plot(hidema ? na : matype1, color=color.green, linewidth=2,transp=0, title="Fast EMA")
yavasema=plot(hidema ? na : matype2, color=color.red, linewidth=2,transp=0, title="Slow EMA")
//kesisme=plot(signal, style=cross, color=signalcolor, linewidth=5, title="Kesişme")
 

longCondition = crossover(matype1, matype2)
if (afterStartDate and longCondition)
    strategy.entry("Long", strategy.long)

shortCondition = crossunder(matype1, matype2)
if (afterStartDate and shortCondition)
    strategy.entry("Short", strategy.short)
    

//--------------------------------------------------------

//volume based color bars
length=input(21, "length", minval=1)
avrg=sma(volume,length)

vold1 = volume > avrg*1.5 and close<open
vold2 = volume >= avrg*0.5 and volume<=avrg*1.5 and close<open
vold3 = volume < avrg *0.5 and close<open

volu1 = volume > avrg*1.5 and close>open
volu2 = volume >= avrg*0.5 and volume<=avrg*1.5 and close>open
volu3 = volume< avrg*0.5 and close>open

cold1=#800000
cold2=#FF0000
cold3=color.orange

colu1=#006400
colu2=color.lime
colu3=#7FFFD4

ac = vold1 ? cold1 : vold2 ? cold2 : vold3 ? cold3 : volu1 ? colu1 : volu2 ? colu2 : volu3 ? colu3 : na

barcolor(ac)