트렌드 팔로잉 4가지 요소 전략


생성 날짜: 2023-10-17 14:47:00 마지막으로 수정됨: 2023-10-17 14:47:00
복사: 0 클릭수: 603
avatar of ChaoZhang ChaoZhang
1
집중하다
1617
수행원

트렌드 팔로잉 4가지 요소 전략

개요

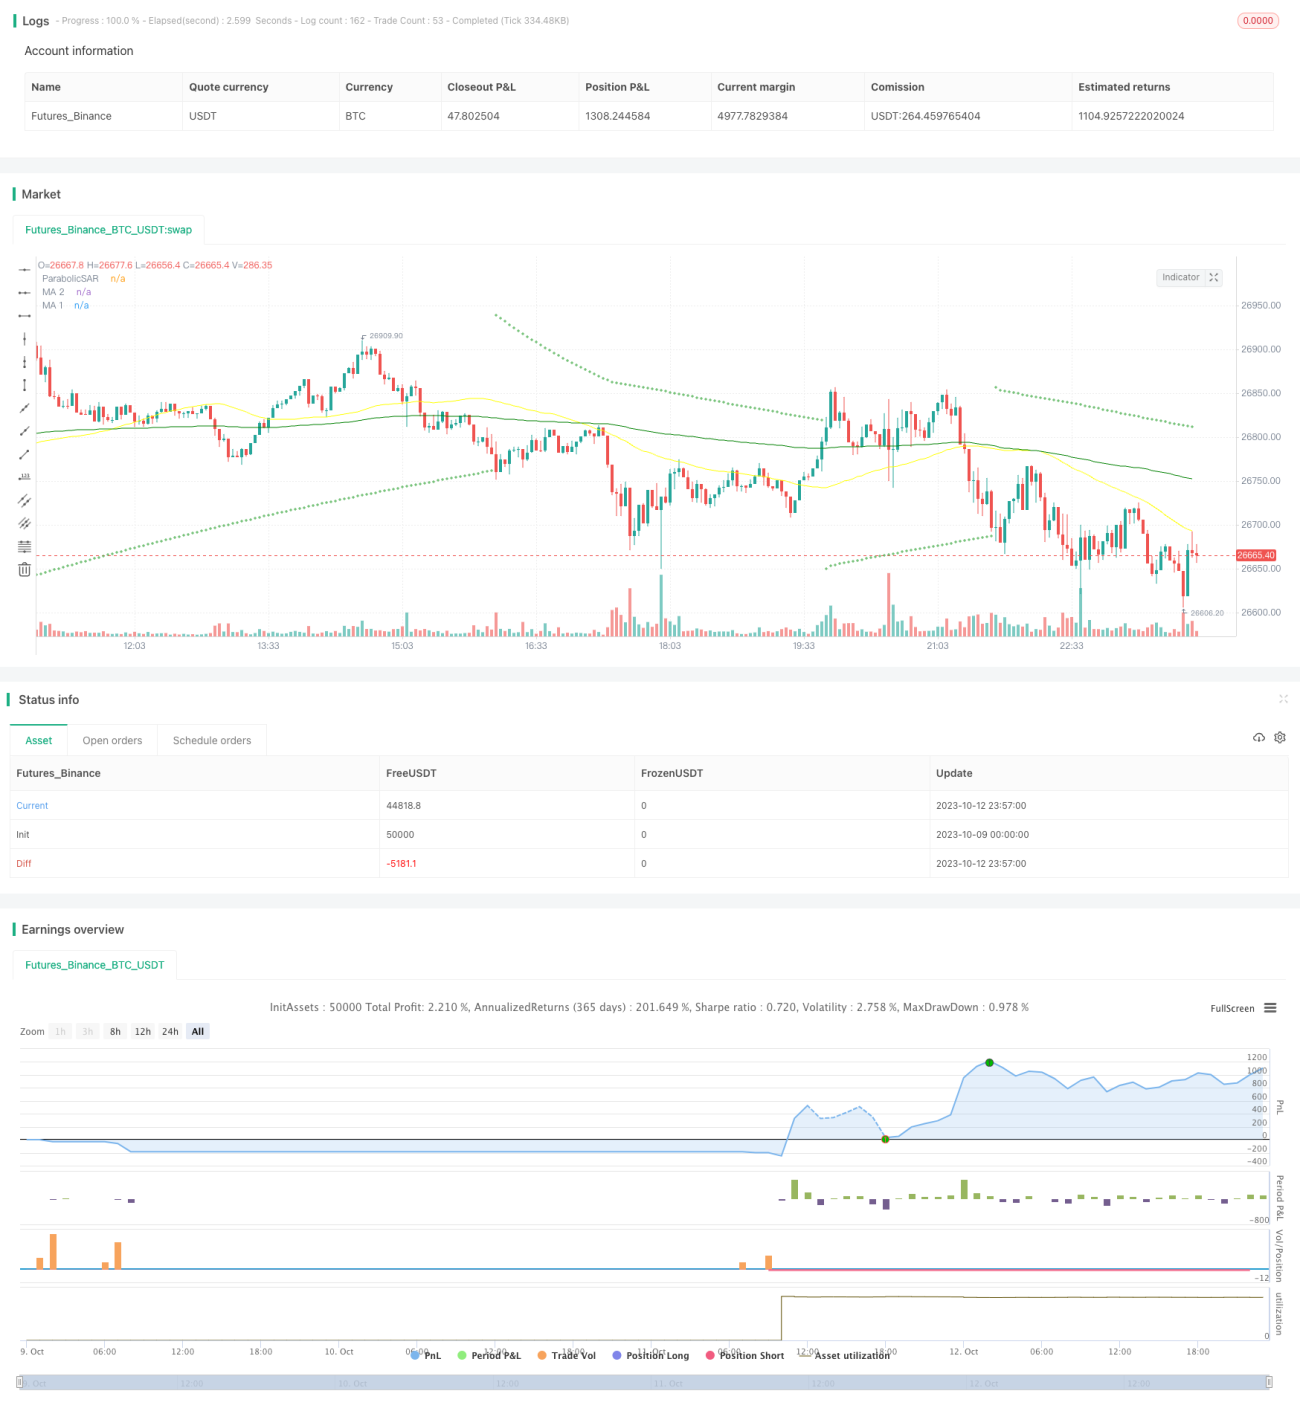
이 전략은 sar 지표, rsi 지표, vol 지표 및 ma 평평선 네 가지 요소를 통합하여 트렌드를 식별하고, 안정적인 위험 관리 조치를 사용하여 트렌드를 추적합니다. 이 전략은 sar 지표를 주축으로하고, rsi 초과 구매 초과 판매 분계 식별 역전 신호, vol 지표는 거래량 특성을 판단하고, ma 평평선은 주류 트렌드 방향을 판단합니다. 여러 지표 조합을 통해 가정을 필터링하고, 신호를 통해 진정한 트렌드 방향을 식별합니다.

전략 원칙

이 전략은 4개의 주요 기술 지표를 사용합니다.

  1. Parabolic SAR: 이 지표는 점과 트렌드 사이의 관계를 사용하여 트렌드 방향과 반전 지점을 판단한다. 점은 가격 위쪽에 있을 때 부양이며, 점은 가격 아래쪽에 있을 때 하락이다. 점은 가격을 통과할 때 트렌드 반전을 나타낸다. 전략은 sar를 주 지표로 하여 트렌드 방향을 판단한다.

  2. RSI: 상대적으로 강한 지표. 이 지표는 0-100 사이의 흔들림으로 시장 오버 바이 오버 소드를 판단한다. RSI 70 이상은 오버 바이 지역, 30 이하는 오버 소드 지역, 50 근처에 돌아가는 중선 지역이다. 전략은 RSI 판단으로 오버 바이 오버 소드 반전 신호이다.

  3. VOL: 거래량 지표. 트렌드를 확인하고 반전 신호 품질을 판단하기 위해 VOL를 사용하여 거래량 증폭 특성을 판단하는 전략.

  4. MA: 이동 평균. 전략은 길고 짧은 평균선을 사용하여 주 하위 트렌드 방향을 판단한다. 짧은 평균선 위에 길고 긴 평균선을 가로지르는 것은 보금자리 신호이며, 짧은 평균선 아래에 길고 긴 평균선을 가로지르는 것은 보금자리 신호이다.

거래 신호 생성 규칙:

다면 조건: SAR 포인트가 K선 아래로 이동하고 RSI가 아래에서 위로 상승하여 중선 영역으로 들어갑니다. VOL 증폭 특성은 분명하며, 짧은 평균선은 아래에서 위로 긴 평균선을 통과합니다.

空頭条件:SAR 포인트가 K선 위로 전환하고 RSI가 위아래로 내려가 중선 영역으로, VOL 증폭 특징이 눈에 띄며, 짧은 평균선은 위아래에서 긴 평균선은 아래로 횡단한다.

이 전략은 또한 스톱 스톱 손실 위험 관리 규칙을 설정한다. 스톱 스톱 목표는 진입 가격의 2 배이며, 스톱 스톱 가격은 진입 가격의 0.8 배이며, 수익을 효과적으로 잠금하고 위험을 통제한다.

우위 분석

이 전략은 다음과 같은 장점을 가지고 있습니다.

  1. 다중 지표 포트폴리오는 가짜 신호를 피하고, 트렌드 전환을 실제로 포착하기 위해 설계되었습니다.

  2. 리스크 관리 설정 스톱 로스 스, 효과적으로 리스크를 제어한다.

  3. 포지션 관리는 매출을 극대화하기 위해 매출을 막기 위해 매출을 막는 것입니다.

  4. 매개 변수는 반복적으로 최적화 테스트를 거쳐 매개 변수 안정성을 보장한다.

  5. 실제 거래 환경을 모방하기 위해 충분한 데이터를 수집했습니다.

  6. 운영 논리는 명확하고 간단하며, 구현을 이해하기 쉽다.

위험 분석

이 전략에는 다음과 같은 위험도 있습니다.

  1. 시장의 비정상적인 변동으로 인해 중지 손실이 뚫렸습니다. 적절한 중지 손실 거리를 완화시키는 것이 좋습니다.

  2. 거래 품종의 유동성이 부족하여 손실을 막을 수 없습니다. 유동성이 좋은 거래 품종을 선택해야합니다.

  3. 체계적 위험은 비정상적인 폭락을 초래한다. 레버리지를 줄이고 가치 기반이 좋은 자산을 보유해야 한다.

  4. 매개 변수를 지나치게 최적화하면 곡선이 너무 우아하게 된다. 매개 변수를 적절히 약화시켜 안정성을 높여야 한다.

  5. 거래 빈도가 너무 높을 때 발생하는 슬라이드 포인트 비용. 거래 신호 생성 간격을 적절히 완화 할 수 있습니다.

  6. 신호 효과 약화 시 적절한 업데이트가 필요합니다. 주기적으로 재검토 및 최적화 매개 변수 설정을 해야 합니다.

최적화 방향

이 전략은 다음과 같은 부분에서 더 개선될 수 있습니다.

  1. MACD, KD와 같은 더 많은 조합을 테스트하여 더 나은 매칭을 찾으십시오.

  2. MA 사이클 파라미터 설정을 최적화하여 주주 트렌드를 더 명확하게 식별한다.

  3. 최적의 리스크/이익 비율을 얻기 위해 스톱 스톱 손실 인수를 최적화하십시오.

  4. 다양한 품종의 매개 변수의 강도를 테스트하고 최적의 매개 변수 조합을 찾습니다.

  5. 트레이딩 신호를 판단하는 데 도움이 되는 기계 학습 모델을 추가한다.

  6. 자율적 제약 알고리즘을 추가하여 제약이 실제 변동에 더 가깝게 설정합니다.

  7. 테스트 더 긴 주기 매개 변수를 설정하고, 정지 범위를 확장한다.

요약하다

이 전략은 여러 지표의 필터링 가짜 신호를 사용하여 트렌드 방향을 결정하고, 스톱 스톱 조치를 설정하여 위험을 제어하고, 변수 최적화 및 포트폴리오 조정을 통해 전략 효과를 지속적으로 향상시킵니다. 어떤 전략도 미래를 완벽하게 예측할 수는 없지만, 시스템의 거래 계획과 함께 좋은 위험 관리는 수익률을 크게 향상시킵니다. 이 전략은 비교적 안정적인 트렌드 추적 프로그램을 제공하며, 장기적으로 안정적인 수익을 추구하는 투자자에게 적합합니다.

전략 소스 코드
/*backtest
start: 2023-10-09 00:00:00
end: 2023-10-13 00:00:00
period: 3m
basePeriod: 1m
exchanges: [{"eid":"Futures_Binance","currency":"BTC_USDT"}]
*/

// This source code is subject to the terms of the Mozilla Public License 2.0 at https://mozilla.org/MPL/2.0/
// © myn

//@version=5
strategy('Strategy Myth-Busting #6 - PSAR+MA+SQZMOM+HVI - [MYN]', max_bars_back=5000, overlay=true, pyramiding=0, initial_capital=20000, currency='USD', default_qty_type=strategy.percent_of_equity, default_qty_value=100.0, commission_value=0.075, use_bar_magnifier = false)


/////////////////////////////////////
//* Put your strategy logic below *//
/////////////////////////////////////
// dOg28adjYWY


//Trading Strategies Used
// Parabolic Sar
// 10 in 1 MA's
// Squeeze Momentum
// HawkEYE Volume Indicator

// Long Condition
// Parabolic Sar shift below price at last dot above and then previous bar needs to breach above that.
// Price action has to be below both MA's and 50MA needs to be above 200MA
// Squeeze Momentum needsd to be in green or close to going green
// HawkEYE Volume Indicator needs to be show a green bar on the histagram

// Short Condition
// Parabolic Sar shift above price at last dot below and then previous bar needs to breach below that.
// Price action needs to be above both MA's and 50MA needs to be below 200MA
// Squeeze Momentum needsd to be in red or close to going red
// HawkEYE Volume Indicator needs to be show a red bar on the histagram


// Parabolic SAR
//░░░░░░░░░░░░░░░░░░░░░░░░░░░░░░░░░░░░░░░░░░░░░░░░░░░░░░░░░░░░░░░░░░░░░░░░░░░░░░░░░░░░░░░░░░░░░░░░░░░░░░░░░░░░░░░░░░░░░░░░░░░░░░░░░░░░░░░░░░░░░░░░░░


//@version=5
//indicator(title="Parabolic SAR", shorttitle="SAR", overlay=true, timeframe="", timeframe_gaps=true)
// Dynamic Max based on trendcode
int TrendCodeAdaptive = switch timeframe.multiplier
    1 => 1
    3 => 1
    5 => 1
    10 => 2
    15 => 3
    30 => 5
    45 => 5
    60 => 7
    120 => 9
    180 => 9
    240 => 13
    300 => 14
    360 => 15
    =>
        int(4)


bool overrideAdaptiveSar = input(false, title="Override Adaptive PSAR", group="Adaptive Parabolic Sar")
TrendCodeOverRide = input(5, title='Trend Code (If Overriding Adaptive PSAR)')


startPSAR = 0.02
increment = 0.02
maximum = overrideAdaptiveSar ? TrendCodeOverRide * 0.005 :  TrendCodeAdaptive * 0.005
PSAR = ta.sar(startPSAR, increment, maximum)
plot(PSAR, "ParabolicSAR", style=plot.style_cross, color=color.green)

//PSARLongEntry = PSAR < close ? 1 : na
//PSARShortEntry = PSAR < close ? na : -1
    
PSARLongEntry = high < PSAR and barstate.isconfirmed
PSARShortEntry = low > PSAR and barstate.isconfirmed


// Squeeze Momentum
//░░░░░░░░░░░░░░░░░░░░░░░░░░░░░░░░░░░░░░░░░░░░░░░░░░░░░░░░░░░░░░░░░░░░░░░░░░░░░░░░░░░░░░░░░░░░░░░░░░░░░░░░░░░░░░░░░░░░░░░░░░░░░░░░░░░░░░░░░░░░░░░░░░

//@version=5
// @author LazyBear 
// List of all my indicators: https://www.tradingview.com/v/4IneGo8h/
//
//indicator(shorttitle='SQZMOM_LB', title='Squeeze Momentum Indicator [LazyBear]', overlay=false)

lengthBB = input(20, title='BB Length', group="Squeeze Momentum")
mult = input(2.0, title='BB MultFactor')
lengthKC = input(20, title='KC Length')
multKC = input(1.5, title='KC MultFactor')

useTrueRange = input(true, title='Use TrueRange (KC)')

// Calculate BB
source = close
basis = ta.sma(source, lengthBB)
dev = multKC * ta.stdev(source, lengthBB)
upperBB = basis + dev
lowerBB = basis - dev

// Calculate KC
ma = ta.sma(source, lengthKC)
range_1 = useTrueRange ? ta.tr : high - low
rangema = ta.sma(range_1, lengthKC)
upperKC = ma + rangema * multKC
lowerKC = ma - rangema * multKC

sqzOn = lowerBB > lowerKC and upperBB < upperKC
sqzOff = lowerBB < lowerKC and upperBB > upperKC
noSqz = sqzOn == false and sqzOff == false

val = ta.linreg(source - math.avg(math.avg(ta.highest(high, lengthKC), ta.lowest(low, lengthKC)), ta.sma(close, lengthKC)), lengthKC, 0)

iff_1 = val > nz(val[1]) ? color.lime : color.green
iff_2 = val < nz(val[1]) ? color.red : color.maroon
bcolor = val > 0 ? iff_1 : iff_2
scolor = noSqz ? color.blue : sqzOn ? color.black : color.gray
//plot(val, color=bcolor, style=plot.style_histogram, linewidth=4)
//plot(0, color=scolor, style=plot.style_cross, linewidth=2)

SQZMOMLongEntry = val > 0
SQZMOMShortEntry = val < 0


// 10 in 1 Different Moving Averages
//░░░░░░░░░░░░░░░░░░░░░░░░░░░░░░░░░░░░░░░░░░░░░░░░░░░░░░░░░░░░░░░░░░░░░░░░░░░░░░░░░░░░░░░░░░░░░░░░░░░░░░░░░░░░░░░░░░░░░░░░░░░░░░░░░░░░░░░░░░░░░░░░░░

// © hiimannshu
//@version=5

// This indicator is just a simple indicator which plot any kind of multiple (atmost 10) moving everage (sma/ema/wma/rma/hma/vwma) on chart.
// Enjoy the new update

//indicator(title='10 in 1 Different Moving Averages ( SMA/EMA/WMA/RMA/HMA/VWMA )', shorttitle=' 10 in 1 MAs', overlay=true)

bool plot_ma_1 = input.bool(true, '', inline='MA 1',group= "Multi Timeframe Moving Averages")
string ma_1_type = input.string(defval='EMA', title='MA 1', options=['RMA', 'SMA', 'EMA', 'WMA','HMA','VWMA'], inline='MA 1',group= "Multi Timeframe Moving Averages")
int ma_1_val = input.int(200, '', minval=1, inline='MA 1',group= "Multi Timeframe Moving Averages")
ma1_tf = input.timeframe(title='', defval='', inline='MA 1',group= "Multi Timeframe Moving Averages")
color ma_1_colour = input.color(color.green, '', inline='MA 1',group= "Multi Timeframe Moving Averages")


bool plot_ma_2 = input.bool(true, '', inline='MA 2',group= "Multi Timeframe Moving Averages")
string ma_2_type = input.string(defval='SMA', title='MA 2 ', options=['RMA', 'SMA', 'EMA', 'WMA','HMA','VWMA'], inline='MA 2',group= "Multi Timeframe Moving Averages")
int ma_2_val = input.int(50, '', minval=1, inline='MA 2',group= "Multi Timeframe Moving Averages")
ma2_tf = input.timeframe(title='', defval='', inline='MA 2',group= "Multi Timeframe Moving Averages")
color ma_2_colour = input.color(color.yellow, '', inline='MA 2',group= "Multi Timeframe Moving Averages")


bool plot_ma_3 = input.bool(false, '', inline='MA 3',group= "Multi Timeframe Moving Averages")
string ma_3_type = input.string(defval='SMA', title='MA 3 ', options=['RMA', 'SMA', 'EMA', 'WMA','HMA','VWMA'], inline='MA 3',group= "Multi Timeframe Moving Averages")
int ma_3_val = input.int(1, '', minval=1, inline='MA 3',group= "Multi Timeframe Moving Averages")
ma3_tf = input.timeframe(title='', defval='', inline='MA 3',group= "Multi Timeframe Moving Averages")
color ma_3_colour = input.color(color.black, '', inline='MA 3',group= "Multi Timeframe Moving Averages")


bool plot_ma_4 = input.bool(false, '', inline='MA 4',group= "Multi Timeframe Moving Averages")
string ma_4_type = input.string(defval='SMA', title='MA 4 ', options=['RMA', 'SMA', 'EMA', 'WMA','HMA','VWMA'], inline='MA 4',group= "Multi Timeframe Moving Averages")
int ma_4_val = input.int(1, '', minval=1, inline='MA 4',group= "Multi Timeframe Moving Averages")
ma4_tf = input.timeframe(title='', defval='', inline='MA 4',group= "Multi Timeframe Moving Averages")
color ma_4_colour = input.color(color.black, '', inline='MA 4',group= "Multi Timeframe Moving Averages")


bool plot_ma_5 = input.bool(false, '', inline='MA 5',group= "Multi Timeframe Moving Averages")
string ma_5_type = input.string(defval='SMA', title='MA 5 ', options=['RMA', 'SMA', 'EMA', 'WMA','HMA','VWMA'], inline='MA 5',group= "Multi Timeframe Moving Averages")
int ma_5_val = input.int(1, '', minval=1, inline='MA 5',group= "Multi Timeframe Moving Averages")
ma5_tf = input.timeframe(title='', defval='', inline='MA 5',group= "Multi Timeframe Moving Averages")
color ma_5_colour = input.color(color.black, '', inline='MA 5',group= "Multi Timeframe Moving Averages")


bool plot_ma_6 = input.bool(false, '', inline='MA 6',group= "Normal Moving Averages")
string ma_6_type = input.string(defval='SMA', title='MA 6 ', options=['RMA', 'SMA', 'EMA', 'WMA','HMA','VWMA'], inline='MA 6',group= "Normal Moving Averages")
int ma_6_val = input.int(1, '', minval=1, inline='MA 6',group= "Normal Moving Averages")
ma_6_src = input.source(defval=close, title='', inline='MA 6',group= "Normal Moving Averages")
color ma_6_colour = input.color(color.black, '', inline='MA 6',group= "Normal Moving Averages")


bool plot_ma_7 = input.bool(false, '', inline='MA 7',group= "Normal Moving Averages")
string ma_7_type = input.string(defval='SMA', title='MA 7 ', options=['RMA', 'SMA', 'EMA', 'WMA','HMA','VWMA'], inline='MA 7',group= "Normal Moving Averages")
int ma_7_val = input.int(1, '', minval=1, inline='MA 7',group= "Normal Moving Averages")
ma_7_src = input.source(defval=close, title='', inline='MA 7',group= "Normal Moving Averages")
color ma_7_colour = input.color(color.black, '', inline='MA 7',group= "Normal Moving Averages")


bool plot_ma_8 = input.bool(false, '', inline='MA 8',group= "Normal Moving Averages")
string ma_8_type = input.string(defval='SMA', title='MA 8', options=['RMA', 'SMA', 'EMA', 'WMA','HMA','VWMA'], inline='MA 8',group= "Normal Moving Averages")
int ma_8_val = input.int(1, '', minval=1, inline='MA 8',group= "Normal Moving Averages")
ma_8_src = input.source(defval=close, title='', inline='MA 8',group= "Normal Moving Averages")
color ma_8_colour = input.color(color.black, '', inline='MA 8',group= "Normal Moving Averages")


bool plot_ma_9 = input.bool(false, '', inline='MA 9',group= "Normal Moving Averages")
string ma_9_type = input.string(defval='SMA', title='MA 9 ', options=['RMA', 'SMA', 'EMA', 'WMA','HMA','VWMA'], inline='MA 9',group= "Normal Moving Averages")
int ma_9_val = input.int(1, '', minval=1, inline='MA 9',group= "Normal Moving Averages")
ma_9_src = input.source(defval=close, title='', inline='MA 9',group= "Normal Moving Averages")
color ma_9_colour = input.color(color.black, '', inline='MA 9',group= "Normal Moving Averages")


bool plot_ma_10 = input.bool(false, '', inline='MA 10',group= "Normal Moving Averages")
string ma_10_type = input.string(defval='SMA', title='MA 10', options=['RMA', 'SMA', 'EMA', 'WMA','HMA','VWMA'], inline='MA 10',group= "Normal Moving Averages")
int ma_10_val = input.int(1, '', minval=1, inline='MA 10',group= "Normal Moving Averages")
ma_10_src = input.source(defval=close, title='', inline='MA 10',group= "Normal Moving Averages")
color ma_10_colour = input.color(color.black, '', inline='MA 10',group= "Normal Moving Averages")


ma_function(source, length, type) =>


    if type == 'RMA'
        ta.rma(source, length)
    else if type == 'SMA'
        ta.sma(source, length)
    else if type == 'EMA'
        ta.ema(source, length)
    else if type == 'WMA'
        ta.wma(source, length)
    else if type == 'HMA'
        if(length<2)
            ta.hma(source,2)
        else
            ta.hma(source, length)
    else 
        ta.vwma(source, length)


ma_1 = plot_ma_1 ? request.security(syminfo.tickerid, ma1_tf, ma_function(close, ma_1_val, ma_1_type)):0
ma_2 = plot_ma_2 ?request.security(syminfo.tickerid, ma2_tf, ma_function(close, ma_2_val, ma_2_type)):0
ma_3 = plot_ma_3 ?request.security(syminfo.tickerid, ma3_tf, ma_function(close, ma_3_val, ma_3_type)):0
ma_4 = plot_ma_4 ? request.security(syminfo.tickerid, ma4_tf, ma_function(close, ma_4_val, ma_4_type)):0
ma_5 = plot_ma_5 ?request.security(syminfo.tickerid, ma5_tf, ma_function(close, ma_5_val, ma_5_type)):0
ma_6 = plot_ma_6 ?ma_function(ma_6_src, ma_6_val, ma_6_type):0
ma_7 = plot_ma_7 ?ma_function(ma_7_src, ma_7_val, ma_7_type):0
ma_8 = plot_ma_8 ?ma_function(ma_8_src, ma_8_val, ma_8_type):0
ma_9 = plot_ma_9 ?ma_function(ma_9_src, ma_9_val, ma_9_type):0
ma_10 = plot_ma_10 ?ma_function(ma_10_src, ma_10_val, ma_10_type):0


plot(plot_ma_1 ? ma_1 : na, 'MA 1', ma_1_colour)
plot(plot_ma_2 ? ma_2 : na, 'MA 2', ma_2_colour)
plot(plot_ma_3 ? ma_3 : na, 'MA 3', ma_3_colour)
plot(plot_ma_4 ? ma_4 : na, 'MA 4', ma_4_colour)
plot(plot_ma_5 ? ma_5 : na, 'MA 5', ma_5_colour)
plot(plot_ma_6 ? ma_6 : na, 'MA 6', ma_6_colour)
plot(plot_ma_7 ? ma_7 : na, 'MA 7', ma_7_colour)
plot(plot_ma_8 ? ma_8 : na, 'MA 8', ma_8_colour)
plot(plot_ma_9 ? ma_9 : na, 'MA 9', ma_9_colour)
plot(plot_ma_10 ? ma_10 : na, 'MA 10', ma_10_colour)


// Long entry -  Price has to be below both MA's and 50MA needs to be above 200MA
MALongEntry = (close > ma_1 and close > ma_2) and (ma_2 > ma_1)

// Short Entry - Price has to be above both MA's and 50MA needs to be below 200MA
MAShortEntry = (close < ma_1 and close < ma_2) and (ma_2 < ma_1)


// HawkEYE Volume Indicator
//░░░░░░░░░░░░░░░░░░░░░░░░░░░░░░░░░░░░░░░░░░░░░░░░░░░░░░░░░░░░░░░░░░░░░░░░░░░░░░░░░░░░░░░░░░░░░░░░░░░░░░░░░░░░░░░░░░░░░░░░░░░░░░░░░░░░░░░░░░░░░░░░░░

//@version=5
// @author LazyBear
// If you use this code, in its original or modified form, do drop me a note. Thx. 
// 
//indicator('HawkEye Volume Indicator [LazyBear]', shorttitle='HVI_LB')
lengthhvi = input(200, group="HawkEye Volume Indicator")
range_1HVI = high - low
rangeAvg = ta.sma(range_1HVI, lengthhvi)

volumeA = ta.sma(volume, lengthhvi)
divisor = input(1)

high1 = high[1]
low1 = low[1]
mid1 = hl2[1]

u1 = mid1 + (high1 - low1) / divisor
d1 = mid1 - (high1 - low1) / divisor

r_enabled1 = range_1HVI > rangeAvg and close < d1 and volume > volumeA
r_enabled2 = close < mid1
r_enabled = r_enabled1 or r_enabled2

g_enabled1 = close > mid1
g_enabled2 = range_1HVI > rangeAvg and close > u1 and volume > volumeA
g_enabled3 = high > high1 and range_1HVI < rangeAvg / 1.5 and volume < volumeA
g_enabled4 = low < low1 and range_1HVI < rangeAvg / 1.5 and volume > volumeA
g_enabled = g_enabled1 or g_enabled2 or g_enabled3 or g_enabled4

gr_enabled1 = range_1HVI > rangeAvg and close > d1 and close < u1 and volume > volumeA and volume < volumeA * 1.5 and volume > volume[1]
gr_enabled2 = range_1HVI < rangeAvg / 1.5 and volume < volumeA / 1.5
gr_enabled3 = close > d1 and close < u1
gr_enabled = gr_enabled1 or gr_enabled2 or gr_enabled3

v_color = gr_enabled ? color.gray : g_enabled ? color.green : r_enabled ? color.red : color.blue
//plot(volume, style=plot.style_histogram, color=v_color, linewidth=5)

HVILongEntry = g_enabled
HVIShortEntry = r_enabled

//////////////////////////////////////
//* Put your strategy rules below *//
/////////////////////////////////////

longCondition = PSARLongEntry and MALongEntry and HVILongEntry and SQZMOMLongEntry
shortCondition = PSARShortEntry and MAShortEntry and HVIShortEntry and SQZMOMShortEntry

//define as 0 if do not want to use
closeLongCondition = 0
closeShortCondition = 0


// ADX
//░░░░░░░░░░░░░░░░░░░░░░░░░░░░░░░░░░░░░░░░░░░░░░░░░░░░░░░░░░░░░░░░░░░░░░░░░░░░░░░░░░░░░░░░░░░░░░░░░░░░░░░░░░░░░░░░░░░░░░░░░░░░░░░░░░░░░░░░░░░░░░░░░░

adxEnabled = input.bool(defval = false , title = "Average Directional Index (ADX)", tooltip = "", group ="ADX" ) 
adxlen = input(14, title="ADX Smoothing", group="ADX")
adxdilen = input(14, title="DI Length", group="ADX")
adxabove = input(25, title="ADX Threshold", group="ADX")

adxdirmov(len) =>
	adxup = ta.change(high)
	adxdown = -ta.change(low)
	adxplusDM = na(adxup) ? na : (adxup > adxdown and adxup > 0 ? adxup : 0)
	adxminusDM = na(adxdown) ? na : (adxdown > adxup and adxdown > 0 ? adxdown : 0)
	adxtruerange = ta.rma(ta.tr, len)
	adxplus = fixnan(100 * ta.rma(adxplusDM, len) / adxtruerange)
	adxminus = fixnan(100 * ta.rma(adxminusDM, len) / adxtruerange)
	[adxplus, adxminus]
adx(adxdilen, adxlen) =>
	[adxplus, adxminus] = adxdirmov(adxdilen)
	adxsum = adxplus + adxminus
	adx = 100 * ta.rma(math.abs(adxplus - adxminus) / (adxsum == 0 ? 1 : adxsum), adxlen)

adxsig = adxEnabled ? adx(adxdilen, adxlen) : na
isADXEnabledAndAboveThreshold = adxEnabled ? (adxsig > adxabove) : true

//Backtesting Time Period (Input.time not working as expected as of 03/30/2021.  Giving odd start/end dates
//░░░░░░░░░░░░░░░░░░░░░░░░░░░░░░░░░░░░░░░░░░░░░░░░░░░░░░░░░░░░░░░░░░░░░░░░░░░░░░░░░░░░░░░░░░░░░░░░░░░░░░░░░░░░░░░░░░░░░░░░░░░░░░░░░░░░░░░░░░░░░░░░░░
useStartPeriodTime = input.bool(true, 'Start', group='Date Range', inline='Start Period')
startPeriodTime = input(timestamp('1 Jan 2019'), '', group='Date Range', inline='Start Period')
useEndPeriodTime = input.bool(true, 'End', group='Date Range', inline='End Period')
endPeriodTime = input(timestamp('31 Dec 2030'), '', group='Date Range', inline='End Period')

start = useStartPeriodTime ? startPeriodTime >= time : false
end = useEndPeriodTime ? endPeriodTime <= time : false
calcPeriod = true

// Trade Direction 
// ░░░░░░░░░░░░░░░░░░░░░░░░░░░░░░░░░░░░░░░░░░░░░░░░░░░░░░░░░░░░░░░░░░░░░░░░░░░░░░░░░░░░░░░░░░░░░░░░░░░░░░░░░░░░░░░░░░░░░░░░░░░░░░░░░░░░░░░░░░░░░░░░░░
tradeDirection = input.string('Long and Short', title='Trade Direction', options=['Long and Short', 'Long Only', 'Short Only'], group='Trade Direction')

// Percent as Points
// ░░░░░░░░░░░░░░░░░░░░░░░░░░░░░░░░░░░░░░░░░░░░░░░░░░░░░░░░░░░░░░░░░░░░░░░░░░░░░░░░░░░░░░░░░░░░░░░░░░░░░░░░░░░░░░░░░░░░░░░░░░░░░░░░░░░░░░░░░░░░░░░░░░
per(pcnt) =>
    strategy.position_size != 0 ? math.round(pcnt / 100 * strategy.position_avg_price / syminfo.mintick) : float(na)

// Take profit 1
// ░░░░░░░░░░░░░░░░░░░░░░░░░░░░░░░░░░░░░░░░░░░░░░░░░░░░░░░░░░░░░░░░░░░░░░░░░░░░░░░░░░░░░░░░░░░░░░░░░░░░░░░░░░░░░░░░░░░░░░░░░░░░░░░░░░░░░░░░░░░░░░░░░░
tp1 = input.float(title='Take Profit 1 - Target %', defval=100, minval=0.0, step=0.5, group='Take Profit', inline='Take Profit 1')
q1 = input.int(title='% Of Position', defval=100, minval=0, group='Take Profit', inline='Take Profit 1')

// Take profit 2
// ░░░░░░░░░░░░░░░░░░░░░░░░░░░░░░░░░░░░░░░░░░░░░░░░░░░░░░░░░░░░░░░░░░░░░░░░░░░░░░░░░░░░░░░░░░░░░░░░░░░░░░░░░░░░░░░░░░░░░░░░░░░░░░░░░░░░░░░░░░░░░░░░░░
tp2 = input.float(title='Take Profit 2 - Target %', defval=100, minval=0.0, step=0.5, group='Take Profit', inline='Take Profit 2')
q2 = input.int(title='% Of Position', defval=100, minval=0, group='Take Profit', inline='Take Profit 2')

// Take profit 3
// ░░░░░░░░░░░░░░░░░░░░░░░░░░░░░░░░░░░░░░░░░░░░░░░░░░░░░░░░░░░░░░░░░░░░░░░░░░░░░░░░░░░░░░░░░░░░░░░░░░░░░░░░░░░░░░░░░░░░░░░░░░░░░░░░░░░░░░░░░░░░░░░░░░
tp3 = input.float(title='Take Profit 3 - Target %', defval=100, minval=0.0, step=0.5, group='Take Profit', inline='Take Profit 3')
q3 = input.int(title='% Of Position', defval=100, minval=0, group='Take Profit', inline='Take Profit 3')

// Take profit 4
// ░░░░░░░░░░░░░░░░░░░░░░░░░░░░░░░░░░░░░░░░░░░░░░░░░░░░░░░░░░░░░░░░░░░░░░░░░░░░░░░░░░░░░░░░░░░░░░░░░░░░░░░░░░░░░░░░░░░░░░░░░░░░░░░░░░░░░░░░░░░░░░░░░░
tp4 = input.float(title='Take Profit 4 - Target %', defval=100, minval=0.0, step=0.5, group='Take Profit')

/// Stop Loss
// ░░░░░░░░░░░░░░░░░░░░░░░░░░░░░░░░░░░░░░░░░░░░░░░░░░░░░░░░░░░░░░░░░░░░░░░░░░░░░░░░░░░░░░░░░░░░░░░░░░░░░░░░░░░░░░░░░░░░░░░░░░░░░░░░░░░░░░░░░░░░░░░░░░
stoplossPercent = input.float(title='Stop Loss (%)', defval=999, minval=0.01, group='Stop Loss') * 0.01
slLongClose = close < strategy.position_avg_price * (1 - stoplossPercent)
slShortClose = close > strategy.position_avg_price * (1 + stoplossPercent)

/// Leverage
// ░░░░░░░░░░░░░░░░░░░░░░░░░░░░░░░░░░░░░░░░░░░░░░░░░░░░░░░░░░░░░░░░░░░░░░░░░░░░░░░░░░░░░░░░░░░░░░░░░░░░░░░░░░░░░░░░░░░░░░░░░░░░░░░░░░░░░░░░░░░░░░░░░░
leverage = input.float(1, 'Leverage', step=.5, group='Leverage')
contracts = math.min(math.max(.000001, strategy.equity / close * leverage), 1000000000)


/// Trade State Management
// ░░░░░░░░░░░░░░░░░░░░░░░░░░░░░░░░░░░░░░░░░░░░░░░░░░░░░░░░░░░░░░░░░░░░░░░░░░░░░░░░░░░░░░░░░░░░░░░░░░░░░░░░░░░░░░░░░░░░░░░░░░░░░░░░░░░░░░░░░░░░░░░░░░

isInLongPosition = strategy.position_size > 0
isInShortPosition = strategy.position_size < 0

/// ProfitView Alert Syntax String Generation
// ░░░░░░░░░░░░░░░░░░░░░░░░░░░░░░░░░░░░░░░░░░░░░░░░░░░░░░░░░░░░░░░░░░░░░░░░░░░░░░░░░░░░░░░░░░░░░░░░░░░░░░░░░░░░░░░░░░░░░░░░░░░░░░░░░░░░░░░░░░░░░░░░░░

alertSyntaxPrefix = input.string(defval='CRYPTANEX_99FTX_Strategy-Name-Here', title='Alert Syntax Prefix', group='ProfitView Alert Syntax')
alertSyntaxBase = alertSyntaxPrefix + '\n#' + str.tostring(open) + ',' + str.tostring(high) + ',' + str.tostring(low) + ',' + str.tostring(close) + ',' + str.tostring(volume) + ','


/// Trade Execution
// ░░░░░░░░░░░░░░░░░░░░░░░░░░░░░░░░░░░░░░░░░░░░░░░░░░░░░░░░░░░░░░░░░░░░░░░░░░░░░░░░░░░░░░░░░░░░░░░░░░░░░░░░░░░░░░░░░░░░░░░░░░░░░░░░░░░░░░░░░░░░░░░░░░

longConditionCalc = (longCondition and isADXEnabledAndAboveThreshold)
shortConditionCalc = (shortCondition and isADXEnabledAndAboveThreshold)

if calcPeriod
    if longConditionCalc and tradeDirection != 'Short Only' and isInLongPosition == false
        strategy.entry('Long', strategy.long, qty=contracts)

        alert(message=alertSyntaxBase + 'side:long', freq=alert.freq_once_per_bar_close)

    if shortConditionCalc and tradeDirection != 'Long Only' and isInShortPosition == false
        strategy.entry('Short', strategy.short, qty=contracts)

        alert(message=alertSyntaxBase + 'side:short', freq=alert.freq_once_per_bar_close)
    
    //Inspired from Multiple %% profit exits example by adolgo https://www.tradingview.com/script/kHhCik9f-Multiple-profit-exits-example/
    strategy.exit('TP1', qty_percent=q1, profit=per(tp1))
    strategy.exit('TP2', qty_percent=q2, profit=per(tp2))
    strategy.exit('TP3', qty_percent=q3, profit=per(tp3))
    strategy.exit('TP4', profit=per(tp4))

    strategy.close('Long', qty_percent=100, comment='SL Long', when=slLongClose)
    strategy.close('Short', qty_percent=100, comment='SL Short', when=slShortClose)

    strategy.close_all(when=closeLongCondition or closeShortCondition, comment='Close Postion')

/// Dashboard
// ░░░░░░░░░░░░░░░░░░░░░░░░░░░░░░░░░░░░░░░░░░░░░░░░░░░░░░░░░░░░░░░░░░░░░░░░░░░░░░░░░░░░░░░░░░░░░░░░░░░░░░░░░░░░░░░░░░░░░░░░░░░░░░░░░░░░░░░░░░░░░░░░░░
// Inspired by https://www.tradingview.com/script/uWqKX6A2/ - Thanks VertMT