이동 평균 경사 교차 추세 추종 전략

개요
이 전략은 두 개의 서로 다른 길이의 지수 이동 평균 ((EMA) 의 기울기를 교차하여 트렌드 추적 신호를 생성합니다. 130 및 400의 EMA를 기본으로 사용하며 두 가지 변수의 조합이 잘 작동합니다.
단선 EMA 경사 위에 느린 EMA 경사와 200주기 이상의 EMA를 가로지르면 더 많이; 단선 EMA 경사 아래에 느린 EMA 경사와 200주기 이하의 EMA를 가로지르면 공백한다.
기울기 방향의 반대 방향으로 교차할 때 평점 <unk>.
이 전략은 비트코인과 유동성이 높은 시장가치를 가진 알트코인에서 가장 잘 작동하지만, 유동성이 높은 자산들, 특히 이러한 자산들이 종종 트렌드상태에 있을 때에도 잘 작동한다.
4시간의 시간 프레임이 가장 적합합니다.
또한 선택적인 변동율 필터를 장착하여 두 경사 사이의 차이는 특정 경사보다 크면만 포지션을 열 수 있으며, 이는 가격 수평 변동이 신호보다 훨씬 큰 소음으로 포지션을 열지 않도록 하기 위해 고안되었습니다.
이 놀라운 효과를 즐기세요!
전략 원칙
이 전략의 핵심은 두 개의 다른 길이의 EMA 지수 이동 평균의 기울기를 비교하는 것이다.
먼저 길이 130과 400의 EMA를 계산하고 각자의 기울기를 계산한 다음 각자의 기울기에 대한 길이 3의 EMA를 계산하여 평형된 기울기 곡선을 얻는다.
단선 EMA 경사위 상의 긴선 EMA 경사위 를 통과할 때 구매 신호가 발생; 단선 EMA 경사위 아래의 긴선 EMA 경사위 를 통과할 때 판매 신호가 발생.
흔들림을 필터하기 위해 200주기의 EMA를 트렌드 필터로 선택할 수 있으며, 이 EMA보다 가격이 높을 때만 더 많은 신호를 고려하고, 이보다 낮을 때 공백 신호를 고려한다.
또한, 오동율 필터를 선택하여 두 경사 사이의 차이는 기본 경사보다 크면만 신호를 발생시켜 경사 교차하지만 오동율이 부족한 경우를 필터링 할 수 있습니다.
지평을 평정하고, 지평이 역으로 교차할 때, 지평을 평정하고, 지평이 역으로 교차할 때, 지평을 평정하고, 지평이 역으로 교차할 때
우위 분석
-
기울기 교차를 사용하여 신호를 생성하여 트렌드를 효과적으로 추적 할 수 있습니다.
-
다양한 시장 환경에 맞게 EMA 주기의 변수 모음을 조정합니다.
-
트렌드 필터는 흔들림의 속임수를 피할 수 있습니다.
-
파동률 필터는 가짜 신호를 필터링
-
규칙은 간단하고 명확하며, 이해하기 쉽다.
-
여러 시간 프레임에서 사용할 수 있습니다.
위험 분석
-
큰 진동이 발생할 경우 Open과 Close이 자주 발생할 수 있습니다.
-
EMA 주기 변수가 잘못되면 트렌드 전환점을 놓칠 수 있습니다.
-
변수 조합은 시장 환경의 변화에 적절하게 조정되어야 합니다.
-
MA 시스템과 비슷하게, 큰 트렌드의 끝에는 손실을 되돌릴 수 있습니다.
최적화 방향
-
다른 EMA 주기 조합 변수를 시도하여 최적의 변수를 찾으십시오.
-
다른 통화 특성과 시장 환경에 따라 선택된 매개 변수
-
리스크 관리를 위한 Stop Loss 전략이 고려될 수 있습니다.
-
동적으로 조정할 수 있는 EMA 주기 변수
-
다른 변동률 절댓값 변수를 시도합니다.
-
다른 시간 프레임에 대한 테스트
요약하다
이 전략의 전체적인 아이디어는 명확하고 이해하기 쉽고, EMA의 기울기 교차를 이용하여 신호를 생성하여 트렌드를 효과적으로 추적할 수 있다. 트렌드 필터와 변동율 필터를 결합하여 노이즈 트레이딩을 줄일 수 있다. EMA 주기의 파라미터 조합을 조정하여 다양한 시장 환경에 적응할 수 있다.
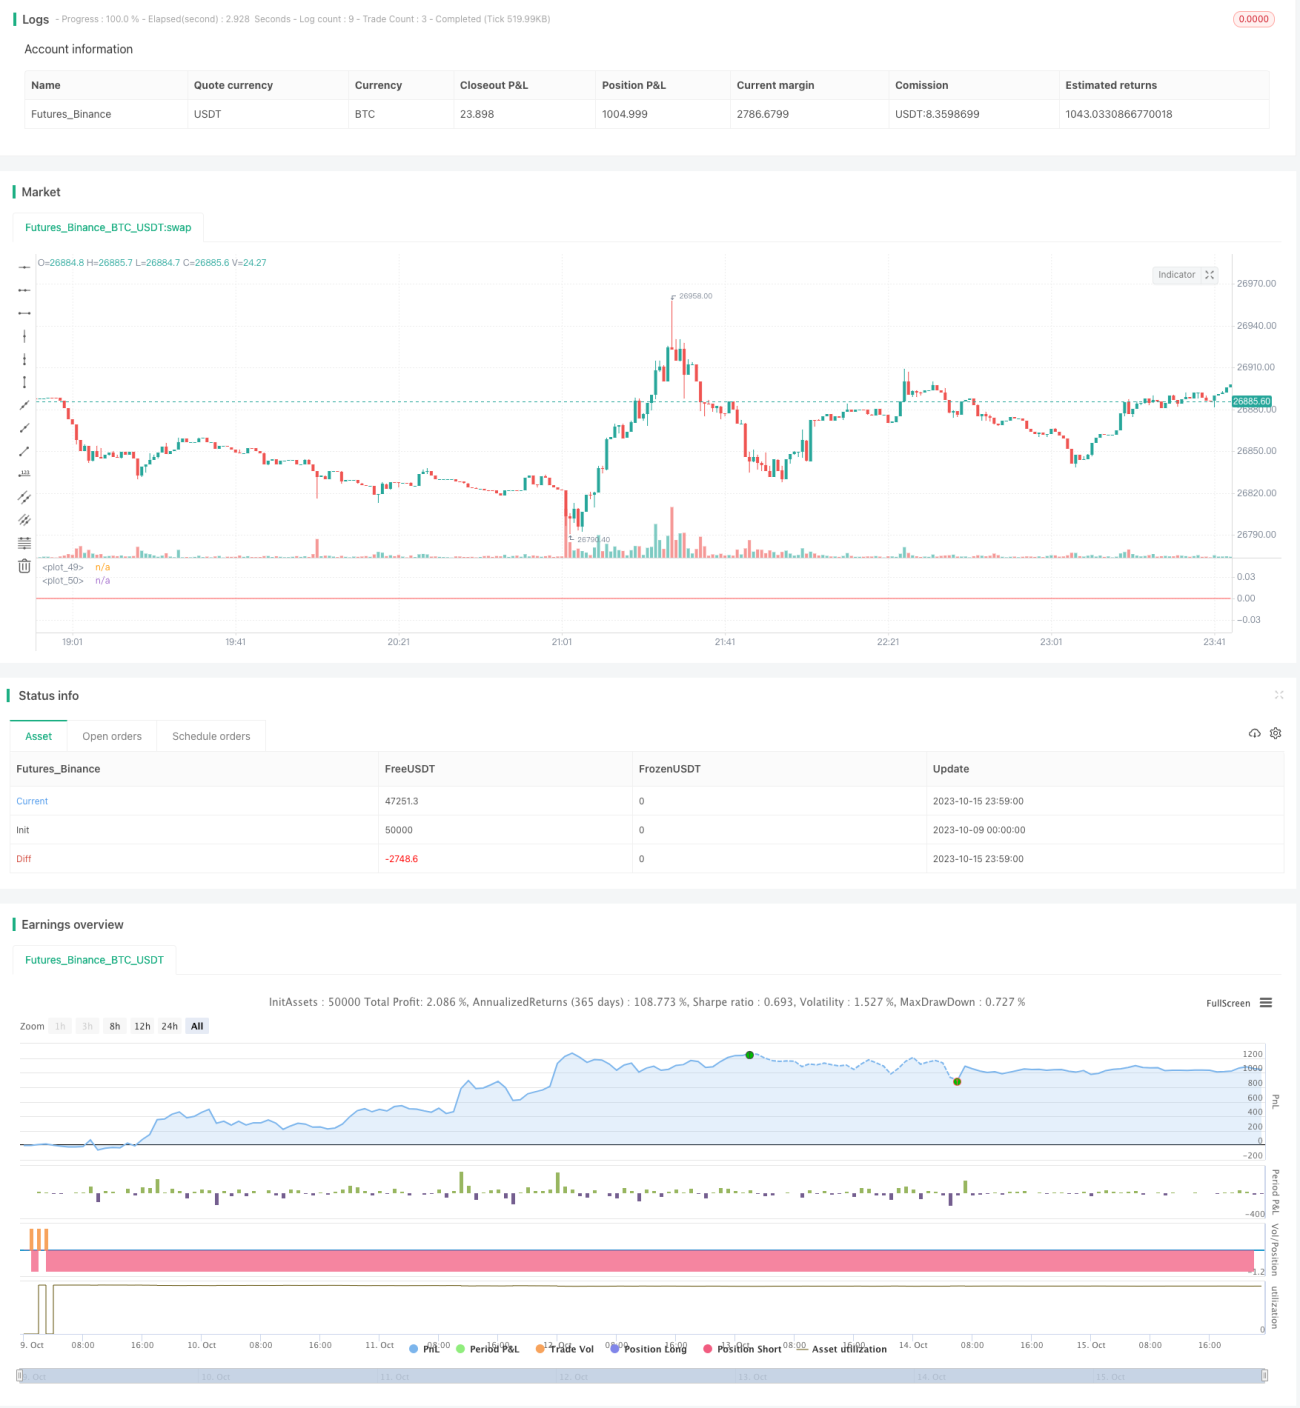
/*backtest
start: 2023-10-09 00:00:00
end: 2023-10-16 00:00:00
period: 1m
basePeriod: 1m
exchanges: [{"eid":"Futures_Binance","currency":"BTC_USDT"}]
*/

//@version=4
// strategy(title="Slopes",initial_capital=1000, default_qty_type=strategy.percent_of_equity, commission_type=strategy.commission.percent, commission_value=0.06, slippage = 2, default_qty_value=30, overlay=false)

//definizione input- 1