상대 펜 이득 이동 평균 교차 전략

개요
이 전략은 주로 일선의 상대적 지체비율 ((RB) 의 평행선 교차 신호를 사용하여 트렌드를 판단하고, 스톱로스 및 스톱 스톱과 함께 자동으로 거래한다. 전략 이름의 ?? 상대적 지체 상승 <unk>은 일선의 상대적 지체 상승 <unk>을 계산하는 평균선을 의미한다.
전략 원칙
이 전략은 Vitelot의 RBI 지표에 기반을 두고 있으며, 이 지표는 일 K 선의 상대적인 펜체스 비율의 이동 평균 ((RB)) 을 계산한다. RB의 계산 방법은 다음과 같다:
공식에서, RB는 양선선의 실체 길이와 K선 전체 길이의 비율에 해당한다. 양선의 RB는 마이너스 값을 취한다. RB의 값은 -1에서 1 사이의 범위이다.
RBI 지표는 RB의 이동 평균을 통해 잡음을 필터링하여 시장의 본질적 특성을 포착합니다. RBI 지표가 신호선을 통과하면 구매 신호가 발생하고 RBI 지표가 신호선을 통과하면 판매 신호가 발생합니다.
다단 불확실성 단계의 가짜 신호를 필터링하기 위해, 이 전략은 RBI 지표에 신호선을 통과할 때, 종결 가격이 13주기 EMA의 평균선보다 높는지 여부를 판단하기도 하며, 그보다 높으면 진정한 구매 신호를 생성하기 위해 다단 전략을 실행한다. 마찬가지로, 종결 가격이 13주기 EMA보다 낮으면 공백 전략을 실행한다.
이 전략은 또한 위험을 제어하고 수익을 잠금하기 위해 중지 및 중지 장치를 설정합니다. 포지션 개설 후 트레일은 설정된 중지 포인트 수를 추적하며 고정 포인트 수를 중지합니다.
우위 분석
-
RBI 지표는 많은 소음을 필터링하여 시장의 추세 특성을 파악하고, 흔들리는 시장의 잘못된 신호에 의해 오해받지 않도록 합니다.
-
평선 필터링과 결합하여, 다중 헤드 불확실한 시기의 거짓 신호를 효과적으로 방지하고, 공중 헤드 손실을 줄일 수 있다.
-
손해 차단 설정은 개별 포지션의 손실 위험을 낮추는 동시에 수익을 잠금하고 전체적으로 수익률을 높이는 데 도움이됩니다.
-
이 전략은 작은 변수들로 구성되어 있으며, 이해하기 쉽고 자동 거래에 적합하다.
위험 분석
-
이 전략은 RBI 지표만을 기반으로 하고, 지표 자체가 잘못된 신호를 내놓으면 전체적인 전략도 실패할 수 있다.
-
부적절한 지표 매개 변수 설정은 거래 신호의 질을 떨어뜨릴 수 있다.
-
어떤 기술 지표도 특정 시장 조건에서 실패할 수 있으며 손실을 완전히 피할 수 없습니다.
-
너무 작은 스톱포인트 설정은 너무 자주 스톱포인트로 이어질 수 있고, 너무 큰 스톱포인트 설정은 단편 손실을 확대할 수 있다.
-
이 계좌의 통제가 부족하면 계좌가 파산할 위험이 있습니다.
최적화 방향
-
RBI 지표의 파라미터를 최적화하기 위해 다양한 변수 조합을 테스트할 수 있다.
-
다른 보조 지표에 필터링을 추가하여 신호 품질을 향상시킬 수 있다.
-
기계 학습 훈련을 통해 스톱 손해 스톱을 최적화할 수 있는 파라미터.
-
전체 포지션과 리스크 <unk>을 제어하는 자금 관리 전략에 참여할 수 있다.
-
야간 포지션이나 쇼트 라인 거래와 같은 다른 포지션 시간 전략을 시도할 수 있습니다.
요약하다
이 전략은 전체적으로 더 간단한 직접적인 트렌드 추적 전략이다. 그것은 일선 대 지수 비율의 평행선 교차를 계산하여 트렌드 방향을 판단하고, 동시에 평행선 필터와 손해 중지 <unk>을 추가하여 위험을 통제하여 흔들리는 시장의 가짜 신호를 효과적으로 방지 할 수 있다. 그러나 어떤 기술 지표 전략도 위험을 완전히 피할 수 없으며, 변수 최적화, 위험 제어 등의 지속적인 개선 최적화에 주의를 기울여야 한다. 장기적으로 안정적인 excess return을 얻기 위해. 전체적으로 말하면, 이 전략의 논리는 명확하고, 이해하기 쉽고, 자동 거래에 적합하며, 매우 실용적인 트렌드 추적 전략이다.
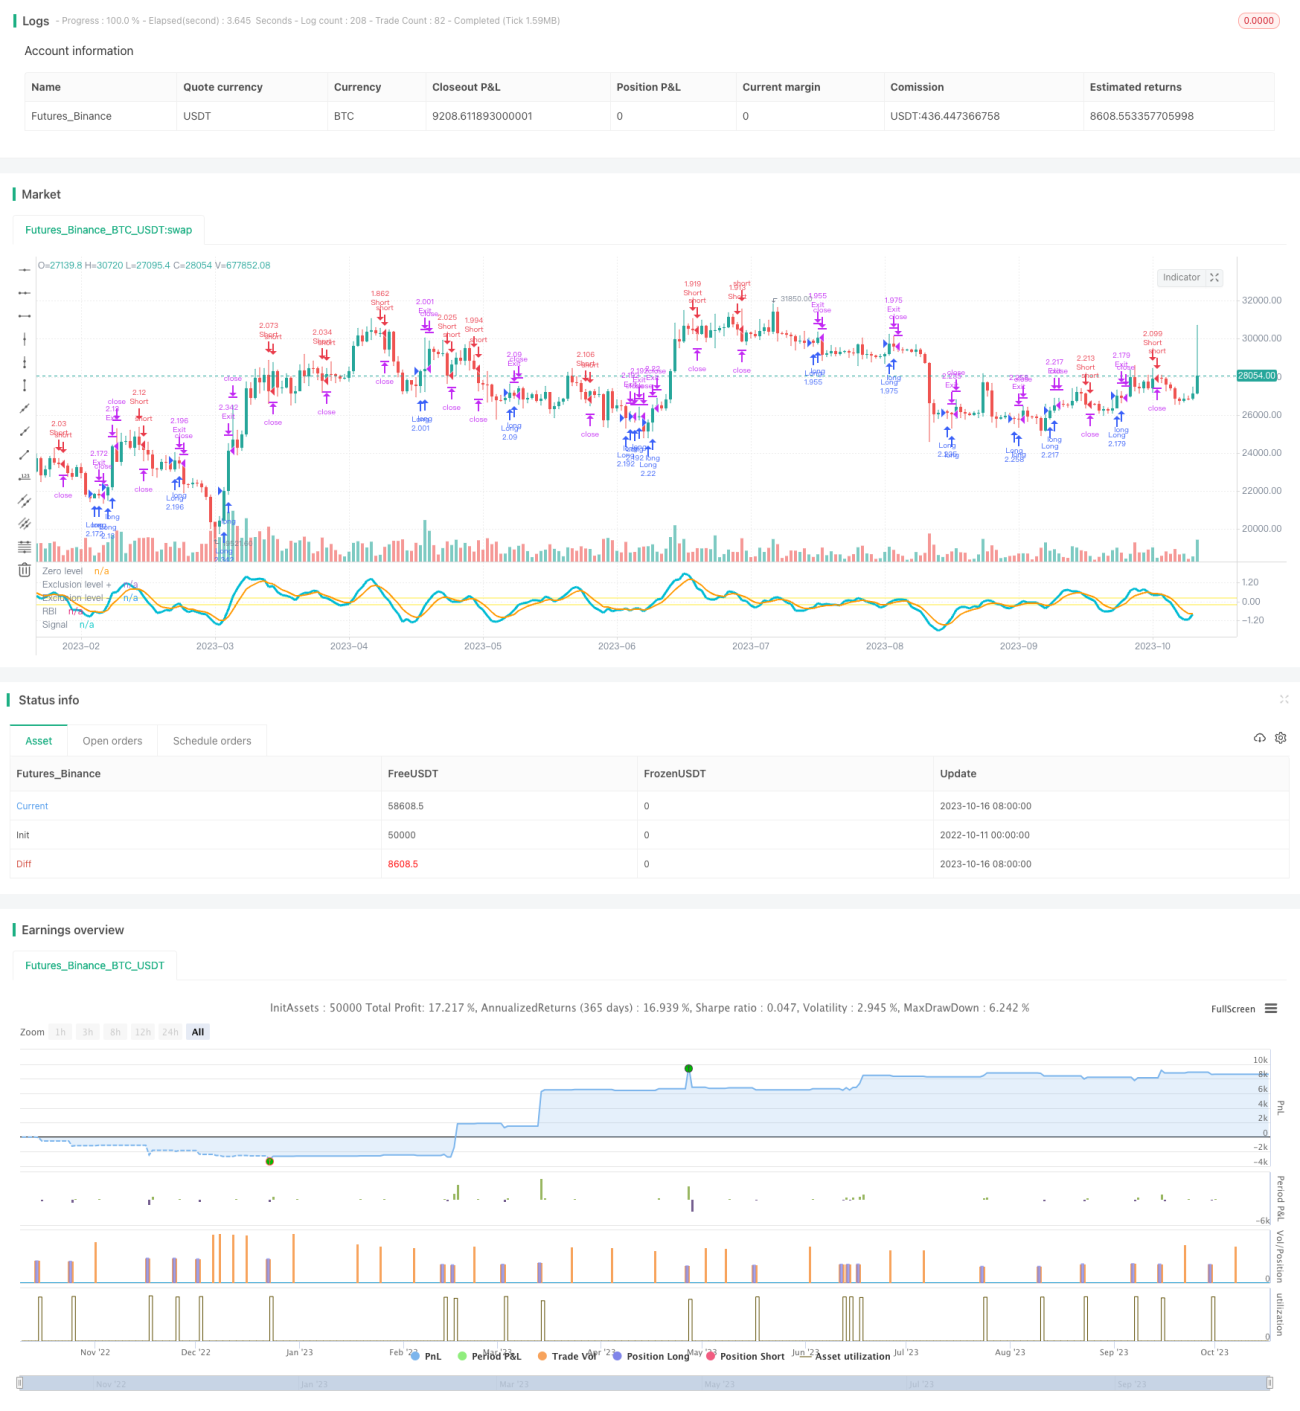
/*backtest
start: 2022-10-11 00:00:00
end: 2023-10-17 00:00:00
period: 1d
basePeriod: 1h
exchanges: [{"eid":"Futures_Binance","currency":"BTC_USDT"}]
*/

//@version=3
strategy("RBI Backtest /w TSSL", shorttitle="RBI Strategy", overlay=false, default_qty_type = strategy.percent_of_equity, default_qty_value = 100, initial_capital = 10000, slippage = 5)
// RBI:
// The EMA of the relative body (RB) of Japanese candles is evaluated.- 1