홀 지표와 확률 지표의 결합 거래 전략

개요
이 전략은 홀 지표를 사용하여 트렌드 방향을 판단하고, 무작위 지표와 결합하여 입시를 한다. 홀 중간 선에서 하향 선을 통과 할 때 <unk> 입시를 하고, 하향 선을 통과 할 때 빈 입시를 한다. 동시에, 무작위 지표 K 선이 초상구역 아래에서 D 선을 통과 할 때 더 하고, 초상구역을 통과 할 때 빈 입시를 한다.
전략 원칙
이 거래 전략은 주로 홀 지표를 사용하여 시장의 경향 방향을 판단하고, 무작위 지표를 사용하여 구체적인 입시를 한다.
우선, 전략에서 홀 지표의 계산 방법을 정의하고, 중궤도, 상궤도 및 하궤도의 계산 공식을 포함한다. 중궤도는 중력 이동 평균 (WMA) 을 이용하여 계산하고, 상궤도 및 하궤도는 각각 중궤도의 오차이다.
다음으로, 중궤도와 상하궤도의 관계에 따라 트렌드 방향을 판단한다. 중궤도 상하궤도를 통과할 때, 상하궤도 상하궤도를 통과할 때, 상하궤도를 통과할 때, 상하궤도를 통과할 때, 상하궤도를 통과할 때, 상하궤도를 통과할 때, 상하궤도를 통과할 때, 상하궤도를 통과할 때, 상하궤도를 통과할 때, 상하궤도를 통과할 때, 상하궤도를 통과할 때, 상하궤도를 통과할 때, 상하궤도를 통과할 때, 상하궤도를 통과할 때, 상하궤도를 통과할 때, 상하궤도를 통과할 때, 상하궤도를 통과할 때, 상하궤도를 통과할 때, 상하궤도를 통과할 때, 상하궤도를 통과할 때, 상하궤도를 통과할 때, 상하궤도를 통과할 때, 상하궤도를 통과할 때, 상하궤도를 통과할 때, 상하궤도를 통과할 때, 상하궤도를 통과할 때, 상하궤도를 통과할 때, 상하궤도를 통과할 때, 상하궤도를
또한, 전략은 K값과 D값의 계산 공식을 포함하여 무작위 지표의 계산 방법을 정의합니다. K값은 RSI의 SMA 평준화를 채택하고, D값은 K값의 다시 SMA 평준화를 사용합니다.
트렌드 방향을 판단한 후, 만약 부자라면, 무작위 지표의 K선이 오버셀 지역 아래에서 D선을 통과할 때 더 많이 한다. 만약 부자라면, K선이 오버빌 지역에서 D선을 통과할 때 더 많이 한다.
이런 식으로, 홀 지표의 트렌드 판단과 무작위 지표의 오버 바이 오버 세일 판단을 결합하여 비교적 안정적이고 정확한 입장을 수행 할 수 있습니다.
우위 분석
이 전략의 가장 큰 장점은 트렌드 판단과 과매매 판단을 결합하여 시장에 대한 다차원적인 분석을 할 수 있다는 점이며, 진입 정확도가 높다는 것이다.
특히, 다음과 같은 장점이 있습니다:
-
홀 지표는 시장의 동향을 효과적으로 판단하고, 대규모의 위치를 결정합니다.
-
무작위적인 지표로 과매매를 판단하여, 구매와 판매의 변화를 파악하고, 시장에 진입할 수 있는 좋은 시점을 파악할 수 있습니다.
-
이 두 가지의 조합은 서로 다른 신호를 검증하고 가짜 신호를 줄일 수 있습니다.
-
파라미터를 조정하여 다양한 품종과 시기를 유연하게 적응할 수 있고, 적용성이 강하다.
-
중간 궤도 편차를 사용하여 위아래 궤도를 형성하는 거래 통로를 구축하여 잠재적인 지원과 저항을 발견 할 수 있습니다.
-
STOP LOSS, EXIT ON TARGETS % used to scale positions 큰 오드 조절
-
Use of hull data Dictionary gives multiple asset class flexibility
-
선택된 최적화 방향은 전략의 안정성과 수익률을 높일 수 있습니다.
위험 분석
이 전략에는 다음과 같은 위험도 있습니다.
-
홀 지표는 추세 전환점을 놓칠 수 있으며 불필요한 손실을 초래할 수 있습니다.
-
무작위 지표 파라미터를 잘못 설정하면 여분의 신호가 발생할 수 있으며, K선과 D선의 교차 신호를 적절히 필터링해야 한다.
-
홀 지표는 무작위 지표와 함께 사용되며, 매개 변수가 적절하지 않으면 잘못된 신호가 발생할 수 있다.
-
위아래 궤도 너비가 너무 크고 너무 작으면 거래 신호의 품질에 영향을 미치며 최적의 매개 변수를 찾기 위해 신중한 테스트가 필요합니다.
-
최근 상황은 불안정하고, 중·장선 지표의 효과가 좋지 않을 수 있다.
-
Data mismatches between hull and stoch causing false signals
-
Sharp trend changes not caught by hull can cause losses
-
Testing on more timeframes/symbols needed to verify robustness
이러한 위험들을 위해 최적화할 수 있는 방법은 다음과 같습니다.
-
홀 지표의 길이를 적절히 줄여서 트렌드 변화에 대한 감수성을 높인다.
-
무작위 지표의 매개 변수를 최적화하여 잘못된 신호를 줄여줍니다.
-
위아래 궤도 파라미터를 조정하여 최적의 통로 폭을 찾습니다.
-
MACD 등과 같은 다른 지표 검증 신호를 추가하십시오.
-
위험을 통제하기 위해 손실을 막는 전략을 추가하십시오.
최적화 방향
이 전략은 다음과 같은 부분에서 최적화될 수 있습니다.
-
더 많은 품종과 더 많은 시간 주기의 변수를 테스트하여 전략의 안정성을 검증하십시오.
-
손실을 막는 메커니즘을 추가하십시오. 추적 손실, 이동 손실과 같은 위험을 더 잘 제어 할 수 있습니다.
-
입시 조건 논리를 최적화하고, 더 엄격한 필터링 조건을 설정하여 잘못된 신호를 줄여줍니다.
-
홀 지표 통로를 이용해서 지원과 저항의 위치를 더 잘 파악할 수 있는 방법을 연구한다.
-
다른 지표의 검증 신호를 추가할 수 있는지 탐색하십시오.
-
매개 변수 최적화. 홀 지표 길이, 무작위 지표 K, D 평형 매개 변수 등의 최적화.
-
포지션 관리 기능이 추가되었다. 포지션 크기를 철회, 연승 등에 따라 조정했다.
-
스톱패스, 스톱<unk> 규칙이 추가되었다.
-
Optimize hull length parameter for better trend sensitivity
-
Add additional filters or confirming indicators to improve signal quality
-
Explore using hull bands to identify dynamic support/resistance levels
-
Parameter optimization for stoch RSI lengths, overbought/oversold levels
-
Introduce better position sizing and risk management rules
요약하다
전체적으로 볼 때, 이 전략은 트렌드 판단과 오버 구매 오버 판매 판단을 통합하여 입시를하는 것이 효과적 인 아이디어입니다. 그러나 지표 자체의 문제가 있기 때문에 거래 신호는 완전히 신뢰할 수 없습니다. 추가 최적화가 필요합니다. 최적의 파라미터 조합을 찾을 수 있다면, 다른 검증 지표 및 위험 제어 수단으로 보조하면, 이 전략의 효과는 기대할 수 있습니다.
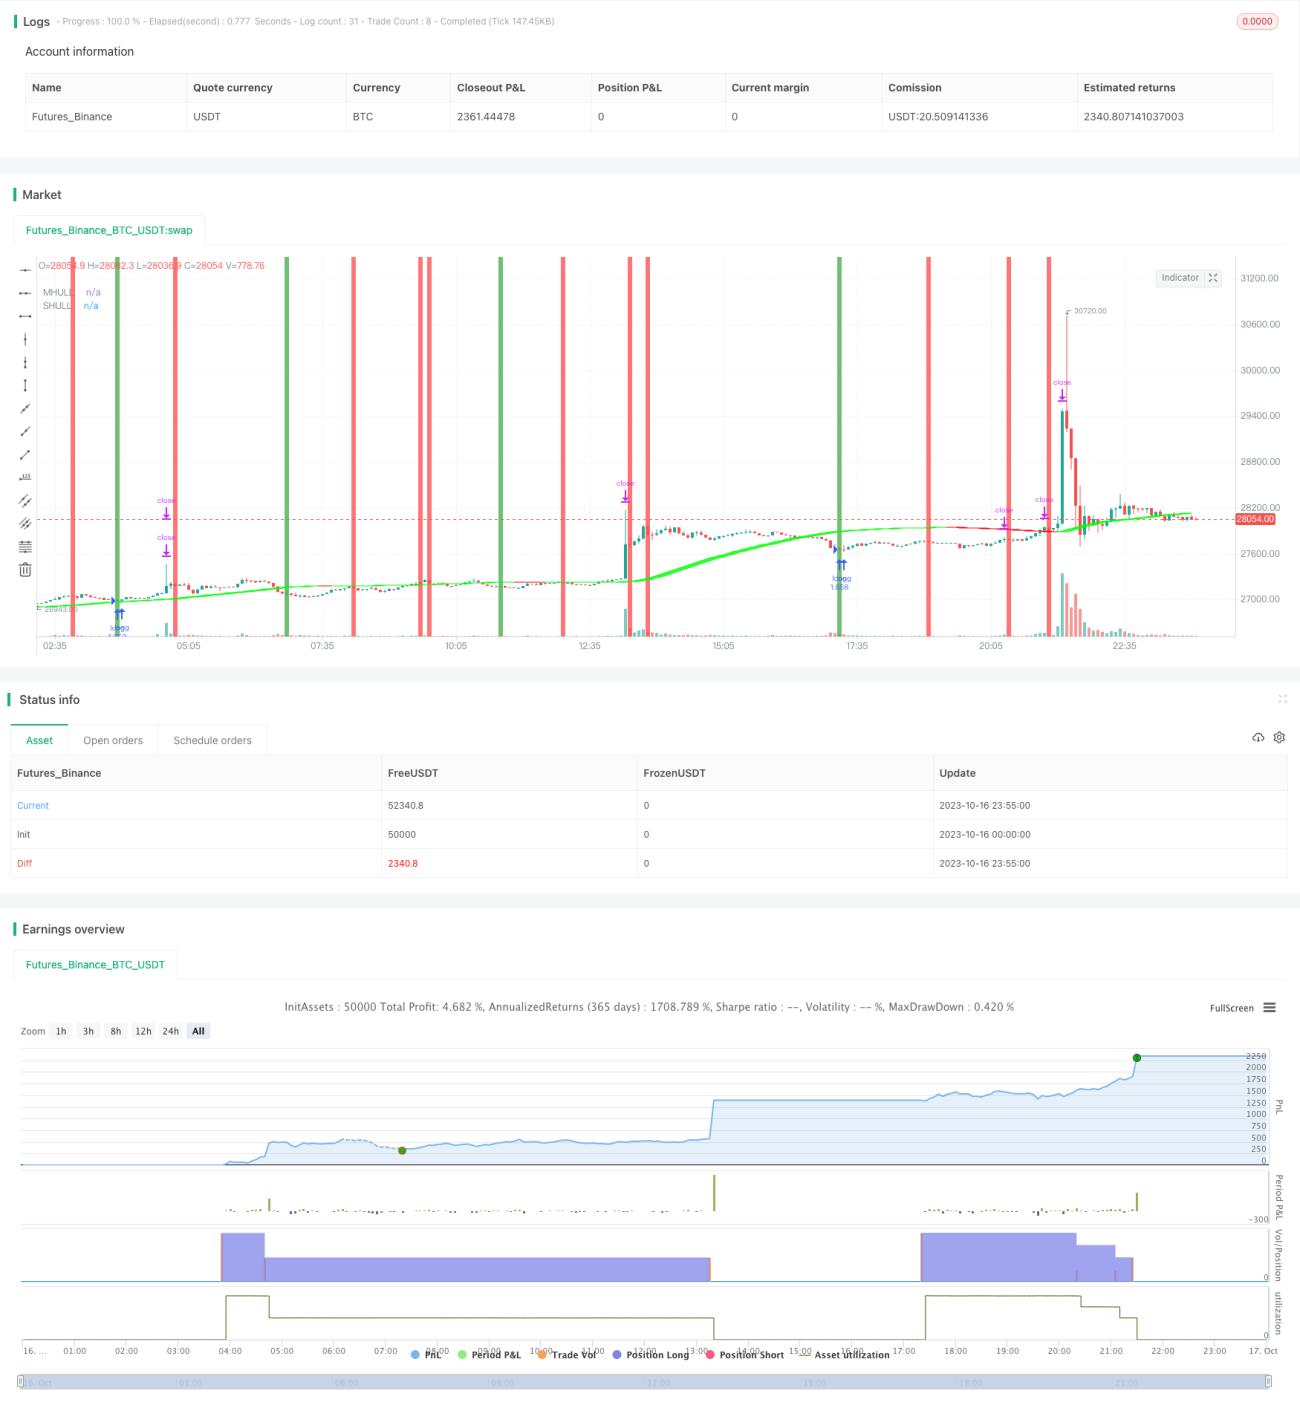
/*backtest
start: 2023-10-16 00:00:00
end: 2023-10-17 00:00:00
period: 5m
basePeriod: 1m
exchanges: [{"eid":"Futures_Binance","currency":"BTC_USDT"}]
*/

//@version=4
//Basic Hull Ma Pack tinkered by InSilico
//Converted to Strategy by DashTrader
strategy("Hull Suite + Stoch RSI Strategy v1.1", overlay=true, pyramiding=1, initial_capital=100, default_qty_type= strategy.percent_of_equity, default_qty_value = 100, calc_on_order_fills=false, slippage=0,commission_type=strategy.commission.percent,commission_value=0.023)- 1