멀티팩터 ​​모멘텀과 반전 조합 전략


생성 날짜: 2023-10-23 15:11:20 마지막으로 수정됨: 2023-10-23 15:11:20
복사: 0 클릭수: 700
avatar of ChaoZhang ChaoZhang
1
집중하다
1617
수행원

멀티팩터 ​​모멘텀과 반전 조합 전략

개요

이 전략은 동력 지표 CMO와 역동 지표 Stochastic을 조합하여 다중 인자 모델을 구현하여 다양한 시장 환경에서 거래 기회를 탐구합니다.

원리 분석

이 전략은 다음의 두 가지 세부 전략으로 구성됩니다.

  1. 123 역전 전략

    • 9일 스토카스틱 지표로 과매매를 판단하는 방법
    • 만약 2일 연속으로 거래소 종결가격이 상승하고 스토카스틱이 50보다 낮다면, 더 많은 돈을 벌 수 있습니다.
    • 2일 연속으로 하락하고, 스토카스틱이 50보다 높으면,
  2. CMO의 절대적 가치 전략

    • CMO의 절대값을 계산하는 방법
    • CMO는 절대값이 70보다 높을 때, 과매매 상태라고 생각하고, 공백을 낸다.
    • CMO는 절대값이 20보다 낮으면 과매매 상태라고 생각하며, 더 많이 합니다.

마지막으로, 두 개의 하위 전략 신호가 일치하면 거래 신호를 발산한다.

이 전략은 동력 지표 CMO와 역전 지표 Stochastic의 장점을 최대한 활용한다. CMO는 트렌드를 더 잘 식별할 수 있고, Stochastic은 단기 반전 기회를 발견할 수 있다. 둘을 결합하여 사용하는 것은 다른 단계에서 거래 기회를 탐색할 수 있다.

우위 분석

이 전략은 다음과 같은 장점을 가지고 있습니다.

  1. 다중 요소 모델, 동량과 역전을 결합하여 다양한 시장 환경에 적응할 수 있습니다.

  2. CMO는 트렌드를 잘 파악하고, Stochastic은 역점을 정확하게 판단합니다.

  3. 두 개의 신호가 일치할 때만 거래하여 잘못된 신호를 피하고 수익을 올릴 수 있습니다.

  4. 파라미터를 최적화 할 수있는 넓은 공간, 다른 품종과 주기에 맞게 조정할 수 있습니다.

  5. 더 많은 거래 기회를 발견할 수 있는 장기 및 단기 주기 지표의 조합

  6. 규칙은 간단하고 명확하며 이해하기 쉬운 구현으로 알고리즘 거래에 적합합니다.

위험 분석

이 전략에는 다음과 같은 위험도 있습니다.

  1. 서브 전략이 잘못된 신호를 발산할 확률이 존재하고, 최적화해야 하는 매개 변수

  2. 급격한 사건으로 인해 트렌드가 뒤집혀 큰 손실이 발생할 수 있습니다.

  3. 거래 빈도가 너무 높을 수 있으며, 거래 비용이 고려해야 할 요소입니다.

  4. 하위 전략은 모두 지연 지표이며, 시간 지연 문제가 있습니다.

  5. 다양한 품종에 대한 변수 조정 필요, 변수 최적화 요구 사항이 높다

대책:

  1. 오피티머 서브 전략 변수, 잘못된 신호의 확률을 낮추기

  2. 단편적 손실을 제어하기 위해

  3. 포지션 개시 조건 조정, 거래 빈도 감소

  4. 실시간 틱 데이터를 활용하여 래그 문제를 줄입니다.

  5. 기계학습을 사용하여 자동으로 최적화합니다.

최적화 방향

이 정책은 다음과 같은 측면에서 최적화될 수 있습니다.

  1. 유동률, 수량 등과 같은 더 많은 요소를 도입하여 체계적인 다중 요소 모델을 형성합니다.

  2. 동적 변수 최적화 메커니즘을 구축하여 시장 상황에 따라 변수를 조정합니다.

  3. 포지션 개시 논리를 최적화하고, 확률과 지수 매끄러짐을 도입하는 방법

  4. 단기간에 장기 포지션을 담보하여 이중적인 목표를 달성합니다.

  5. 더 많은 특징을 추출하고 비선형 거래 규칙을 구축하기 위해 딥러닝을 사용합니다.

  6. 인위적으로 선택된 파라미터의 오차를 방지하기 위한 무변수 모형을 탐색합니다.

  7. 높은 주파수 데이터, 뉴스 이벤트와 결합하여 신호 지연 문제를 줄입니다.

요약하다

이 전략은 운동 지표 CMO와 역전 지표 Stochastic을 사용하여 다인자 모델을 구현하여 교차형 시장에서 더 많은 거래 기회를 탐색한다. 단일 지표에 비해 다인자 조합은 더 복잡한 시장 환경에 적응할 수 있다. 동시에, 이 전략의 파라미터를 최적화하는 공간은 넓고 규칙은 간단하며 알고리즘 거래 개발에 적합하다. 그러나 또한 위험 관리, 파라미터 선택 및 모델 최적화에 대한 요구 사항이 높다.
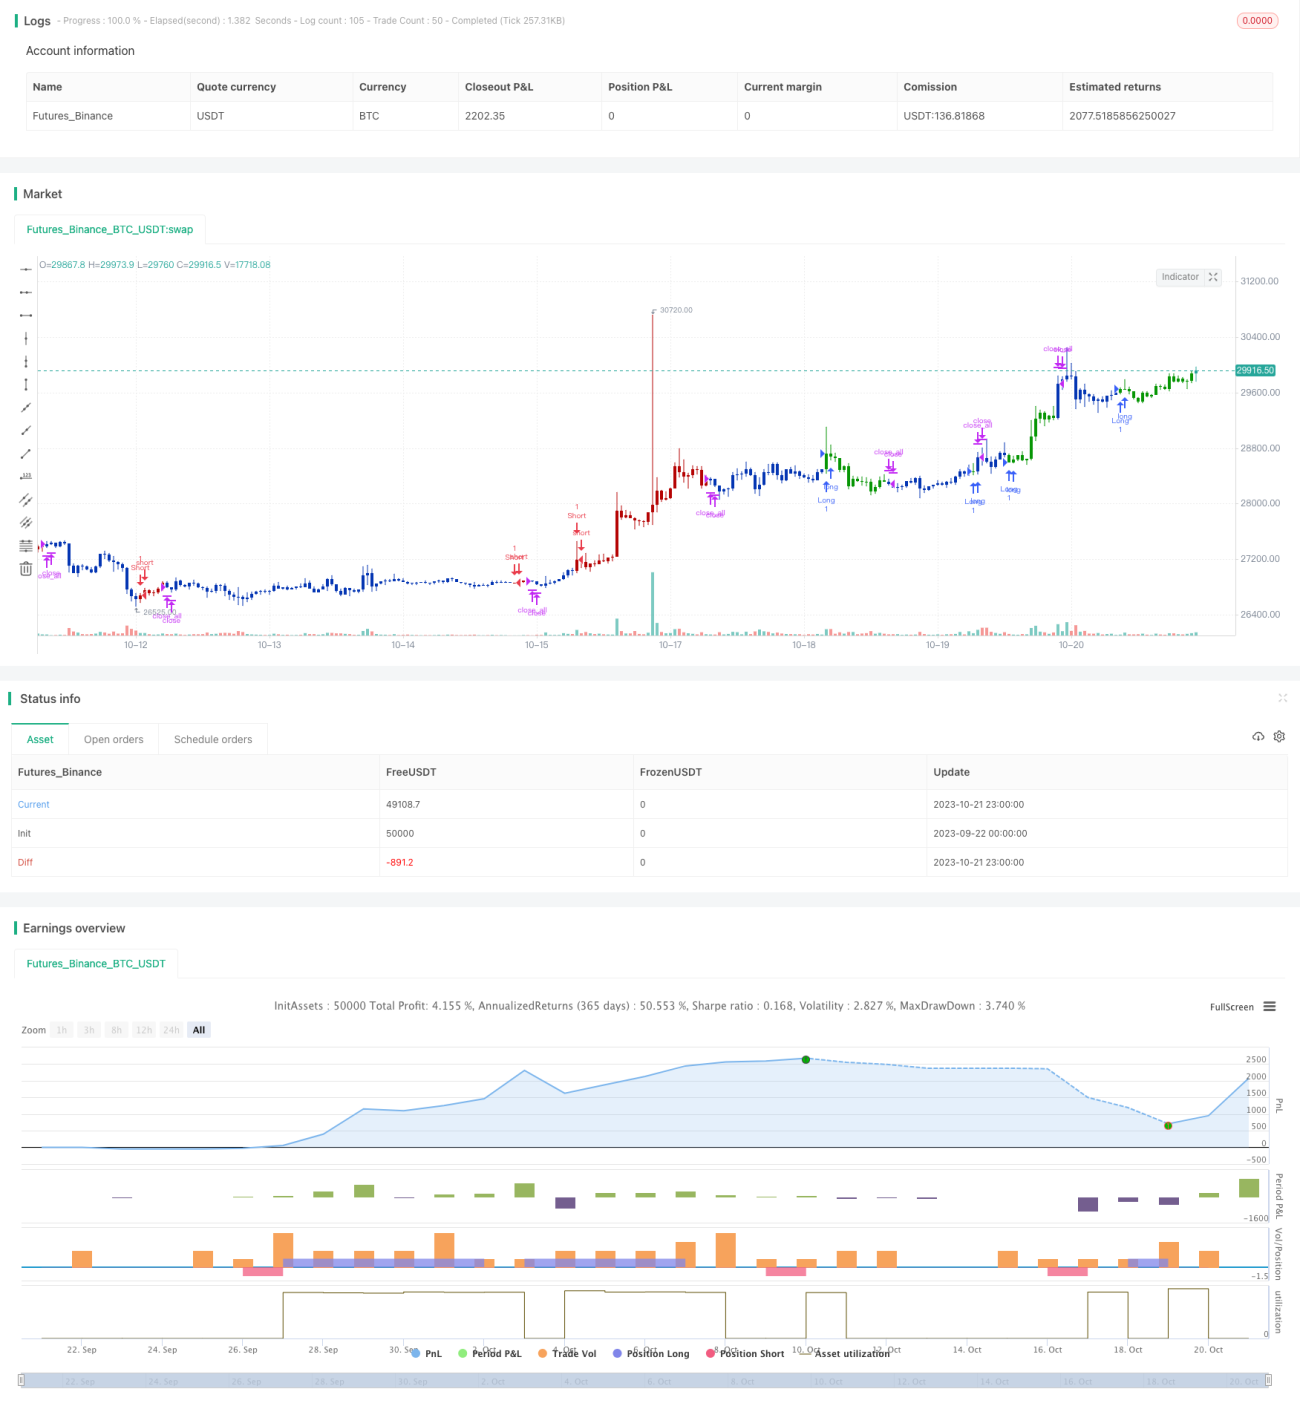
전략 소스 코드
/*backtest
start: 2023-09-22 00:00:00
end: 2023-10-22 00:00:00
period: 1h
basePeriod: 15m
exchanges: [{"eid":"Futures_Binance","currency":"BTC_USDT"}]
*/

//@version=4
////////////////////////////////////////////////////////////
//  Copyright by HPotter v1.0 17/09/2019
// This is combo strategies for get a cumulative signal. 
//
// First strategy
// This System was created from the Book "How I Tripled My Money In The 
// Futures Market" by Ulf Jensen, Page 183. This is reverse type of strategies.
// The strategy buys at market, if close price is higher than the previous close 
// during 2 days and the meaning of 9-days Stochastic Slow Oscillator is lower than 50. 
// The strategy sells at market, if close price is lower than the previous close price 
// during 2 days and the meaning of 9-days Stochastic Fast Oscillator is higher than 50.
//
// Second strategy
//    This indicator plots the absolute value of CMO. CMO was developed by Tushar 
//    Chande. A scientist, an inventor, and a respected trading system developer, 
//    Mr. Chande developed the CMO to capture what he calls "pure momentum". For 
//    more definitive information on the CMO and other indicators we recommend the 
//    book The New Technical Trader by Tushar Chande and Stanley Kroll.
//    The CMO is closely related to, yet unique from, other momentum oriented indicators 
//    such as Relative Strength Index, Stochastic, Rate-of-Change, etc. It is most closely 
//    related to Welles Wilder`s RSI, yet it differs in several ways:
//        - It uses data for both up days and down days in the numerator, thereby directly 
//          measuring momentum;
//        - The calculations are applied on unsmoothed data. Therefore, short-term extreme 
//          movements in price are not hidden. Once calculated, smoothing can be applied to 
//          the CMO, if desired;
//        - The scale is bounded between +100 and -100, thereby allowing you to clearly see 
//          changes in net momentum using the 0 level. The bounded scale also allows you to 
//          conveniently compare values across different securities.
//
// WARNING:
// - For purpose educate only
// - This script to change bars colors.
////////////////////////////////////////////////////////////
Reversal123(Length, KSmoothing, DLength, Level) =>
    vFast = sma(stoch(close, high, low, Length), KSmoothing) 
    vSlow = sma(vFast, DLength)
    pos = 0.0
    pos := iff(close[2] < close[1] and close > close[1] and vFast < vSlow and vFast > Level, 1,
	         iff(close[2] > close[1] and close < close[1] and vFast > vSlow and vFast < Level, -1, nz(pos[1], 0))) 
	pos

CMOabs(Length, TopBand, LowBand) =>
    pos = 0
    xMom = abs(close - close[1])
    xSMA_mom = sma(xMom, Length)
    xMomLength = close - close[Length]
    nRes = abs(100 * (xMomLength / (xSMA_mom * Length)))
    pos := iff(nRes > TopBand, -1,
    	     iff(nRes < LowBand, 1, nz(pos[1], 0))) 
    pos

strategy(title="Combo Backtest 123 Reversal & CMOabs", shorttitle="Combo", overlay = true)
Length = input(14, minval=1)
KSmoothing = input(1, minval=1)
DLength = input(3, minval=1)
Level = input(50, minval=1)
//-------------------------
LengthCMO = input(9, minval=1)
TopBand = input(70, minval=1)
LowBand = input(20, maxval=0)
reverse = input(false, title="Trade reverse")
posReversal123 = Reversal123(Length, KSmoothing, DLength, Level)
posCMOabs = CMOabs(LengthCMO, TopBand, LowBand)
pos = iff(posReversal123 == 1 and posCMOabs == 1 , 1,
	   iff(posReversal123 == -1 and posCMOabs == -1, -1, 0)) 
possig = iff(reverse and pos == 1, -1,
          iff(reverse and pos == -1 , 1, pos))	   
if (possig == 1) 
    strategy.entry("Long", strategy.long)
if (possig == -1)
    strategy.entry("Short", strategy.short)	 
if (possig == 0) 
    strategy.close_all()
barcolor(possig == -1 ? #b50404: possig == 1 ? #079605 : #0536b3 )