RSI MACD 크로스오버 더블 이동 평균 추적 전략

개요
이 전략은 RSI 지표, MACD 지표 및 쌍평등선을 종합적으로 사용하여 트렌드 추적 및 위치 표준 차이의 효과를 달성합니다. 전략은 RSI 지표를 통해 과매매 현상을 판단하고, MACD는 빠른 느린 평평선 교차를 판단하여 구매 판매 시기를 판단하고, 쌍평등선은 일부 잡음 거래 기회를 필터링하여 트렌드에서 이익을 얻습니다.
전략 원칙
- RSI를 계산하여 과매매를 판단합니다.
-
특정 주기 내의 상승과 하락의 변화를 계산한다.
-
RSI는 상승과 하락의 변화로 계산됩니다.
-
과매매하는 판단을 내리는 것
- MACD 지표 판단을 계산하기
-
빠른 선, 느린 선, 신호 선을 계산합니다.
-
그리고 그 다음으로, 이 모든 것은 매우 간단합니다.
-
크로스 표시
- 이중 일률 필터링을 구현
-
빠른 선과 느린 선을 계산합니다.
-
단속선을 이용한 거래만 고려해야 합니다.
-
트렌드 추적을 구현하고 노이즈 필터링
- 여러 지표가 합쳐져 진출을 판단하는 것
-
통합 RSI, MACD, 쌍평평선 다중 조건 필터
-
전략의 안정성을 높여라
우위 분석
-
다중 지표 포지션은 전략의 정확성을 향상시킵니다.
-
트렌드 추적, 노이즈 필터링, 안정성 향상
-
RSI 지표는 과도한 구매와 과도한 판매를 판단하여 전환점을 파악하는 데 도움이 됩니다.
-
MACD의 교차 판단은 간단하고 효율적으로 매매를 판단합니다.
-
양방향 필터링, 대부분의 비주류 방향의 거래 기회를 제거
-
쉽게 이해할 수 있고, 변수가 적어서 학습을 개선하는 데 적합합니다.
위험 분석
-
다중 지표 조합으로 인해 전략이 지나치게 최적화 될 수 있습니다.
-
이중평등은 유연성을 희생하고 기회를 놓치고 있습니다.
-
RSI와 MACD의 변수를 신중하게 선택해야 합니다.
-
거래 품종의 스톱로스에 주의하고 위험을 조절하는 방법
-
장기 사용은 시장에 적응하기 위해 매개 변수를 반복적으로 조정해야 합니다.
최적화 방향
-
RSI 파라미터를 다양한 품종 특성에 맞게 조정
-
트렌드 추적 효과를 최적화하기 위한 쌍평선 주기 조정
-
단독 손실을 통제하기 위한 HAL 전략에 참여하세요.
-
더 많은 지표와 함께 더 풍부한 조건 포지션
-
개발 매개 변수가 적응 모드, 자동 조정 매개 변수
요약하다
이 전략은 RSI, MACD 및 쌍평등선과 같은 여러 지표를 통합하여 추세를 판단하고 추적하고 기회에 대해 여러 층의 필터링을 구현합니다. 이 전략은 초보자 학습 및 개선에 적합합니다. 이 전략의 장점은 간단하고 효율적이며, 쉽게 이해할 수 있으며, 매개 변수를 조정하여 안정적인 수익을 얻을 수 있습니다.
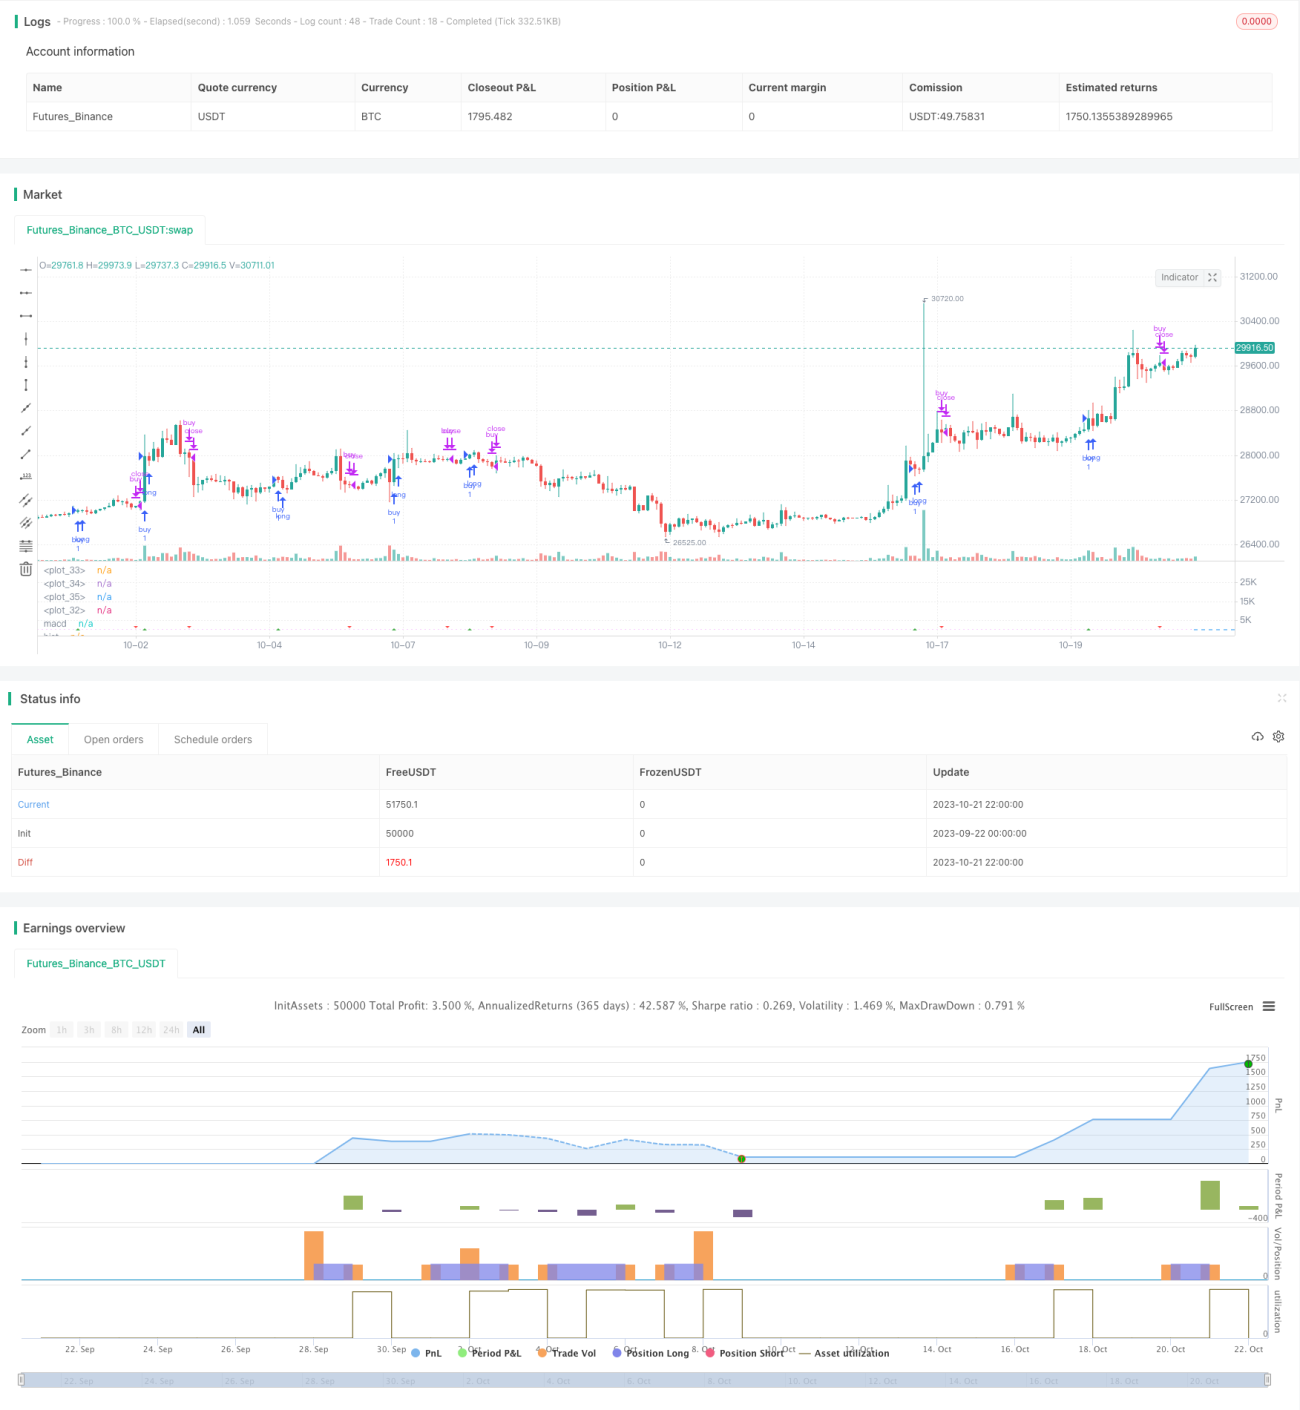
/*backtest
start: 2023-09-22 00:00:00
end: 2023-10-22 00:00:00
period: 2h
basePeriod: 15m
exchanges: [{"eid":"Futures_Binance","currency":"BTC_USDT"}]
*/

//@version=3

// strategy(title="RSI MACD", precision = 6, pyramiding = 1, default_qty_type = strategy.percent_of_equity, default_qty_value = 99, commission_type = strategy.commission.percent, commission_value = 0.25, initial_capital = 1000)
- 1