
개요
이 전략은 이동 평균, 진동 지표와 같은 여러 가지 기술 지표를 사용하여, 평균선 통과 형태와 결합하여, 주식 가격의 추세와 하락의 전환점을 식별하여, 매매를 한다.
원칙
이 전략은 다음과 같은 부분으로 구성됩니다.
-
구간을 선택: K 라인 그래프의 시간 구간 분수, 예를 들어 1분, 5분 등
-
이동 평균을 선택: 일반적으로 사용되는 EMA, SMA 등의 이동 평균의 파라미터를 구성합니다. 10일선, 20일선 등
-
흔들림 지표 선택: RSI, MACD, 윌리엄 지표 등 흔들림 지표의 파라미터를 구성한다.
-
구매 및 판매 신호를 계산합니다: 사용자 정의 함수를 사용하여 이동 평균과 진동 지표의 수치를 계산합니다. 단기 평균선 위에 장기 평균선을 통과하면 구매 신호가 발생하고, 단기 평균선 아래에 장기 평균선을 통과하면 판매 신호가 발생합니다.
-
등급 시스템: 각 지표의 구매 판매 신호를 수치화 스코어, 그리고 평균을 취하여 전체 등급 지수를 얻습니다. 등급 지수는 0보다 큰 구매 신호, 0보다 작은 판매 신호입니다.
-
거래 신호: 등급 지수가 0보다 크거나 작으면 최종 거래 신호를 생성하고, 구매 또는 판매 작업을 수행한다.
이 전략은 여러 가지 지표를 조합하여 가격의 추세와 전환점을 효과적으로 식별하여 신호의 신뢰성을 높입니다. 평행선 통과는 유효한 트렌드 기술 신호이며, 흔들림 지표와 결합하면 가짜 돌파구를 피하는 데 도움이됩니다. 등급 시스템은 거래 신호를 더 명확하게 만듭니다.
장점
- 평평선 통과와 여러 가지 진동 지표가 결합되어 거래 신호가 더 신뢰할 수 있으며 가짜 신호를 피합니다.
- 평가 시스템은 구매와 판매 신호를 더 명확하게 만듭니다.
- 사용자 정의 함수를 사용하여 모듈화 프로그래밍, 코드 구조가 명확하다
- 여러 시간 주기를 사용하여 조합 분석을 수행하여 정확도를 향상시킵니다.
- RSI 길이, MACD 속속 평균주기 등과 같은 변수 설정을 최적화합니다.
- 매개 변수 사용자 정의 지표와 평균선 매개 변수를 통해 유연성을 향상
위험성
- 대시장 추세에 따른 주가 성과에 차이가 있다.
- 거래 빈도가 높을 수 있으며 거래 비용과 지점 위험을 증가시킬 수 있습니다.
- 다양한 주식 특성에 맞게 최적화 변수를 반복적으로 테스트해야 합니다.
- 철수와 손실의 위험이 있습니다.
이 위험은 다음과 같은 방법으로 줄일 수 있습니다.
- 큰 시장의 흐름과 함께 주식을 선택하세요.
- 거래시간을 적절히 조정하고 거래 빈도를 낮추는 것
- 주식 특성에 맞는 최적화 변수 설정
- 손실을 통제하기 위한 전략
최적화 방향
이 전략은 다음의 몇 가지 측면에서 더 개선될 수 있습니다.
- 더 많은 지표, 예를 들어 변동률 지표, 강화 신호
- 기계 학습과 결합된 자동 최적화 매개 변수
- 주식 및 업계 선택 모듈을 추가합니다.
- 양적 선택 방법과 결합
- 적응적 손실, 추적적 손실을 방지하는 방법
- 큰 시장 상황을 고려하고 불확실한 환경을 피하십시오.
- 실물 거래 결과를 분석하고 평가 중량을 조정합니다.
종합적으로, 이 전략은 평균선 돌파와 여러 지표를 통합하여 가격 움직임을 효과적으로 식별할 수 있다. 그러나 지속적으로 최적화를 테스트하고 위험을 제어해야 한다. 포트폴리오 선택 주식, 매개 변수 최적화, 상쇄 측면에서 향후 개선할 수 있다.
요약하다
이 전략은 수평선을 통과하는 것을 주요 거래 신호로 하고, 여러 가지 충격 지표에 의해 확인되고, 점수 시스템을 사용하여 명확한 구매 판매 신호를 생성한다. 가격 추세와 전환점을 효과적으로 식별 할 수 있지만 거래 주파수를 제어하고 거래 비용과 위험을 줄이는 동시에 계속적인 최적화 매개 변수가 필요합니다.
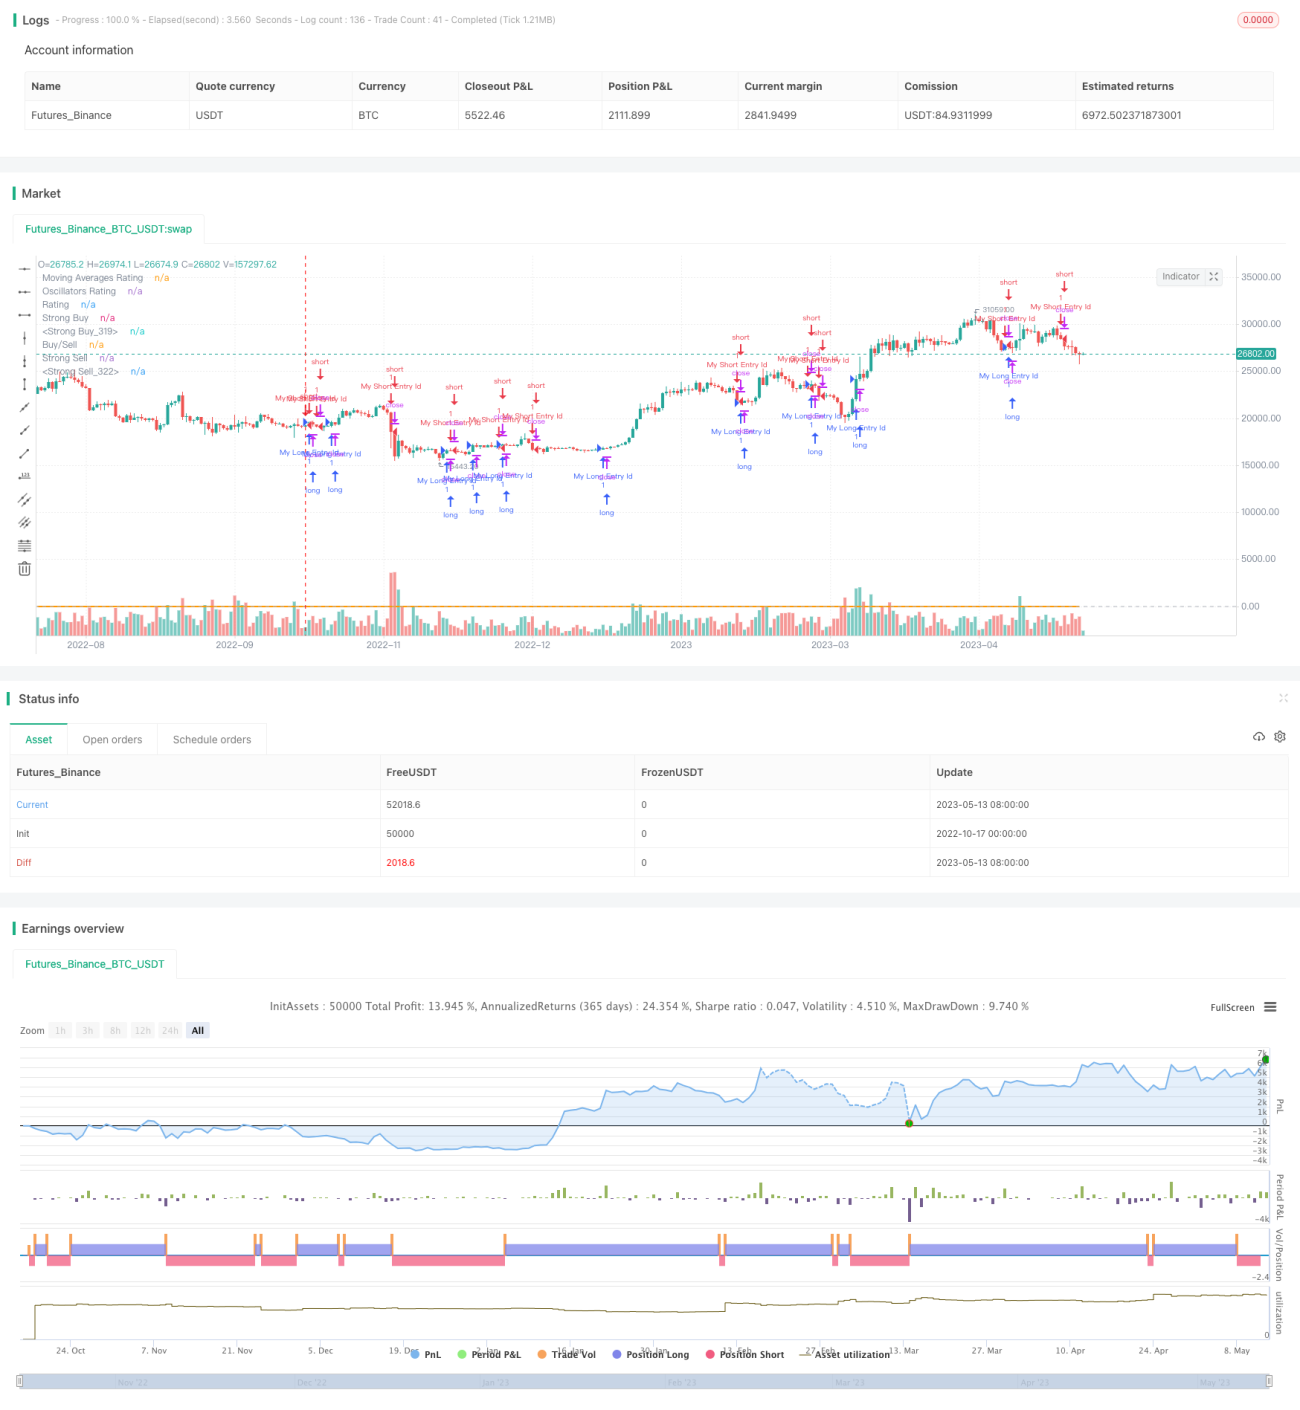
/*backtest
start: 2022-10-17 00:00:00
end: 2023-05-14 00:00:00
period: 1d
basePeriod: 1h
exchanges: [{"eid":"Futures_Binance","currency":"BTC_USDT"}]
*/

//@version=4
strategy("TV Signal", overlay=true, initial_capital = 500, currency = "USD")

// -------------------------------------- GLOBAL SELECTION --------------------------------------------- //- 1