
이 전략은 더 강력한 거래 신호를 얻기 위해 트렌드 반전 전략과 통계적 변동률 전략을 결합한 합동 전략이다.
이 전략은 두 부분으로 구성되어 있습니다.
트렌드 반전 전략
통계적 변동률 전략
마지막으로, 두 가지 전략 신호가 일치하면 거래 신호가 생성됩니다. 즉, 두 가지 전략 신호가 일치하면 거래 신호가 생성됩니다.
이 전략은 신호의 신뢰성을 높일 수 있는 두 가지 다른 유형의 전략을 결합했다.
123 형식 판단은 트렌드 반전 지점을 정확하게 파악하고, 급격한 가격 변동에 미혹되지 않도록 해준다.
통계적 변동률은 최근 한 달 동안의 시장 변동 상황을 반영하여 높은 변동률과 거래 기회가 많은 시기를 필터링 할 수 있습니다.
두 가지 전략은 상호 검증되며, 시장의 중요한 전환점을 더 잘 잡을 수 있는 전략과 결합하여 더 정확한 신뢰할 수 있는 거래 신호를 얻습니다.
123 형태는 가짜 돌파구로 인한 위험을 완전히 피할 수 없습니다. 비정상적인 진동이 발생하면 신호를 잘못 판단 할 수 있습니다.
통계적 변동률은 단지 역사적 데이터를 고려하여 미래의 변동 동향을 예측할 수 없습니다. 시장 변동이 갑자기 확대되거나 축소되면 잘못된 신호가 발생할 수 있습니다.
두 가지 전략 모두 매개 변수 최적화에 의존한다. 매개 변수가 잘못 설정되면 신호 품질이 크게 떨어진다.
연합 전략은 신뢰성을 높였지만, 더 강력한 단일 신호를 놓칠 수도 있습니다.
린베스트, KDJ 등과 같은 더 많은 지표와 함께 투표 메커니즘을 형성합니다.
더 많은 역사적 데이터를 사용하여 트렌드 반전의 가능성을 판단하는 기계 학습 알고리즘을 추가하십시오.
값을 설정하여 신호를 강하게 필터링하고, 노이즈 방해를 방지한다.
다양한 품종, 주기별로 파라미터를 조정하는 최적화 파라미터 설정.
합동 전략의 위험을 통제하기 위한 손해제도 강화.
이 전략은 트렌드 반전 전략과 통계적 변동률 전략을 결합하여 신호 품질을 향상시키고 시장의 중요한 전환점에 비교적 정확한 거래 지시를 줄 수 있습니다. 그러나 잘못된 판단의 위험과 파라미터 최적화 문제에 주의를 기울여야합니다. 더 많은 지표와 기계 학습과 같은 수단을 결합하여 더 안정적이고 신뢰할 수있는 거래를 얻을 수 있습니다.
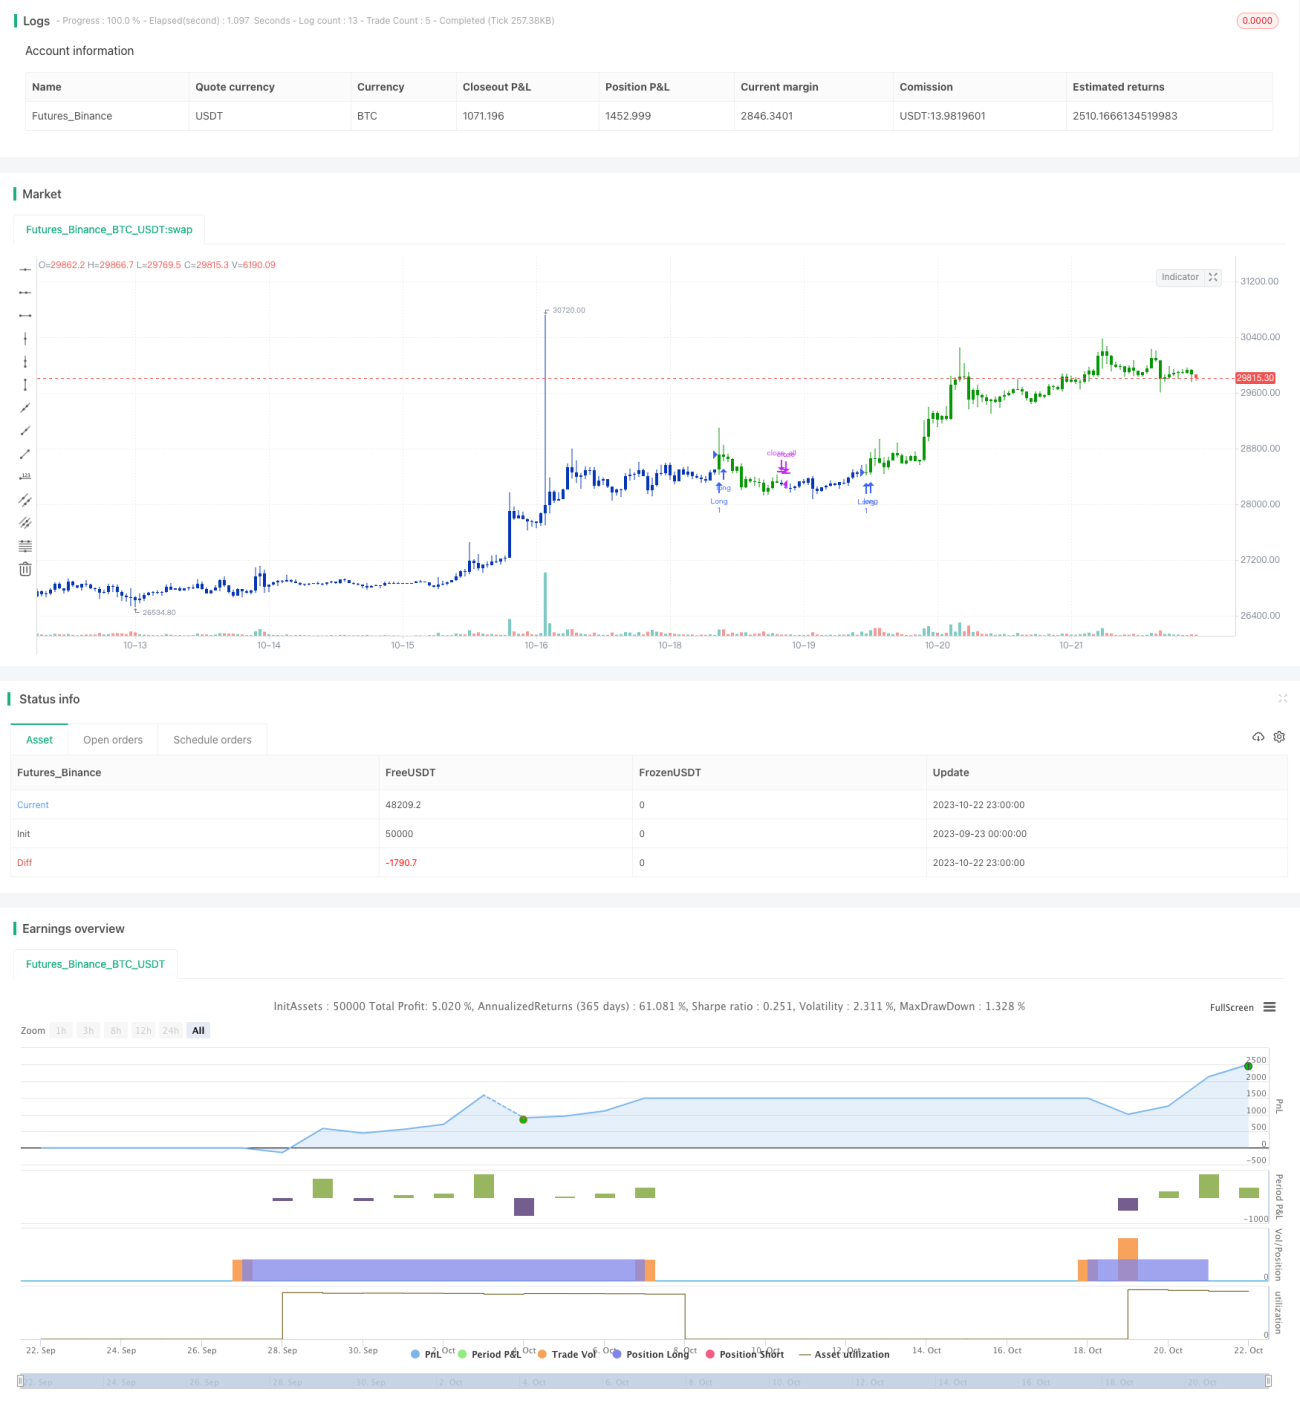
/*backtest
start: 2023-09-23 00:00:00
end: 2023-10-23 00:00:00
period: 1h
basePeriod: 15m
exchanges: [{"eid":"Futures_Binance","currency":"BTC_USDT"}]
*/
//@version=4
////////////////////////////////////////////////////////////
// Copyright by HPotter v1.0 31/07/2021
// This is combo strategies for get a cumulative signal.
//
// First strategy
// This System was created from the Book "How I Tripled My Money In The
// Futures Market" by Ulf Jensen, Page 183. This is reverse type of strategies.
// The strategy buys at market, if close price is higher than the previous close
// during 2 days and the meaning of 9-days Stochastic Slow Oscillator is lower than 50.
// The strategy sells at market, if close price is lower than the previous close price
// during 2 days and the meaning of 9-days Stochastic Fast Oscillator is higher than 50.
//
// Second strategy
// This indicator used to calculate the statistical volatility, sometime
// called historical volatility, based on the Extreme Value Method.
// Please use this link to get more information about Volatility.
//
// WARNING:
// - For purpose educate only
// - This script to change bars colors.
////////////////////////////////////////////////////////////
Reversal123(Length, KSmoothing, DLength, Level) =>
vFast = sma(stoch(close, high, low, Length), KSmoothing)
vSlow = sma(vFast, DLength)
pos = 0.0
pos := iff(close[2] < close[1] and close > close[1] and vFast < vSlow and vFast > Level, 1,
iff(close[2] > close[1] and close < close[1] and vFast > vSlow and vFast < Level, -1, nz(pos[1], 0)))
pos
SV(Length,TopBand,LowBand) =>
pos = 0.0
xMaxC = highest(close, Length)
xMaxH = highest(high, Length)
xMinC = lowest(close, Length)
xMinL = lowest(low, Length)
SqrTime = sqrt(253 / Length)
Vol = ((0.6 * log(xMaxC / xMinC) * SqrTime) + (0.6 * log(xMaxH / xMinL) * SqrTime)) * 0.5
nRes = iff(Vol < 0, 0, iff(Vol > 2.99, 2.99, Vol))
pos := iff(nRes > TopBand, 1,
iff(nRes < LowBand, -1, nz(pos[1], 0)))
pos
strategy(title="Combo Backtest 123 Reversal & Statistical Volatility", shorttitle="Combo", overlay = true)
line1 = input(true, "---- 123 Reversal ----")
Length = input(14, minval=1)
KSmoothing = input(1, minval=1)
DLength = input(3, minval=1)
Level = input(50, minval=1)
//-------------------------
line2 = input(true, "---- Statistical Volatility ----")
LengthSV = input(30, minval=1)
TopBand = input(0.005, step=0.001)
LowBand = input(0.0016, step=0.001)
reverse = input(false, title="Trade reverse")
posReversal123 = Reversal123(Length, KSmoothing, DLength, Level)
posSV = SV(LengthSV,TopBand,LowBand)
pos = iff(posReversal123 == 1 and posSV == 1 , 1,
iff(posReversal123 == -1 and posSV == -1, -1, 0))
possig = iff(reverse and pos == 1, -1,
iff(reverse and pos == -1 , 1, pos))
if (possig == 1 )
strategy.entry("Long", strategy.long)
if (possig == -1 )
strategy.entry("Short", strategy.short)
if (possig == 0)
strategy.close_all()
barcolor(possig == -1 ? #b50404: possig == 1 ? #079605 : #0536b3 )