롱앤숏 파워 전략 백테스팅

1
Follow
1781
Followers
개요
다중 공간 힘 전략은 알렉산더 엘더 박사가 개발한 것으로, 시장의 구매와 판매 압력을 엘더-레이 지표로 측정한다. 엘더-레이 지표는 일반적으로 3 화면 거래 시스템과 함께 사용되지만, 독립적으로도 사용할 수 있다.
알렉산더 엘더 박사는 13일 지수 이동 평균 ((EMA) 을 사용하여 시장 가치의 공감대를 나타냅니다. 다중 힘은 구매자가 가치 공감대보다 가격을 높일 수있는 능력을 나타냅니다. 공중 힘은 판매자가 평균 가치 공감대보다 가격을 낮출 수있는 능력을 나타냅니다.
다중력 (多頭力) 은 13일 EMA를 빼고 고점을 계산한다. 공중력 (空頭力) 은 13일 EMA를 빼고 저점을 계산한다.
전략 원칙
이 전략은 공중력 지표를 계산하여 시장의 공중 상태를 판단한다.
- 13일 EMA를 시장 가치 합의로 계산합니다.
- 다중력 계산: 13일 EMA를 빼고 하루 최고가
- 공백력을 계산: 13일 EMA를 빼면 당일 최저값
- 다중 머리 힘과 공허 머리 힘의 밀도와 관계, 다중 공허 신호를 판단하기
- 역거래를 선택할 수 있습니다.
다중 힘이 <unk>값보다 크면 다중 신호로, 공중 힘이 <unk>값보다 크면 공백 신호로. 반전 거래도 선택할 수 있다.
우위 분석
- 시장의 공백을 판단하기 위해 공백력 지표를 사용하세요.
- 구성 가능한 매개 변수 유연성, <unk>값 및 주기 조정
- 다양한 시장 환경에 적응할 수 있는 역거래 옵션
- 급격한 사건에 대한 감수성이 낮은 지수 이동 평균
위험 분석
- 다공력 지표는 잘못된 신호를 유발할 수 있으며, 추세와 다른 지표의 필터링이 필요합니다.
- 고정 사이클은 시장 변화에 적응할 수 없으며, 적응 사이클 최적화를 적용할 수 있다.
- 시장이 너무 큰 손실을 초래할 수 있는 손해배상 장치가 없습니다.
- 시장에 진입할 시기가 부족하다는 판단에 불과하다.
스톱로스를 설정하고, 이동 평균 주기를 최적화하고, 트렌드 지표와 결합하여 최적화할 수 있다.
최적화 방향
- 이동 평균 주기 변수를 최적화하여 적응 주기 EMA를 사용합니다.
- 트렌드 지표 필터를 추가하여 역전 거래를 피하십시오.
- 단편적 손실을 통제하기 위한 손실 차단 전략을 강화
- 다른 지표와 함께 시장에 진입할 때
- 기계 학습 기술을 적용하여 최적화 파라미터 설정
요약하다
다공간력 전략은 Elder-ray 지표를 통해 시장 다공간 상태를 판단하며, 간단하고 직관적이며, 파라미터가 구성할 수 있다. 그러나 잘못된 신호를 발생시키는 경향이 있으므로 추세 판단과 상쇄를 추가로 최적화해야 한다. 이 전략은 학습할 가치가 있지만, 직접 적용할 때는 신중해야 한다.
Source
Pine
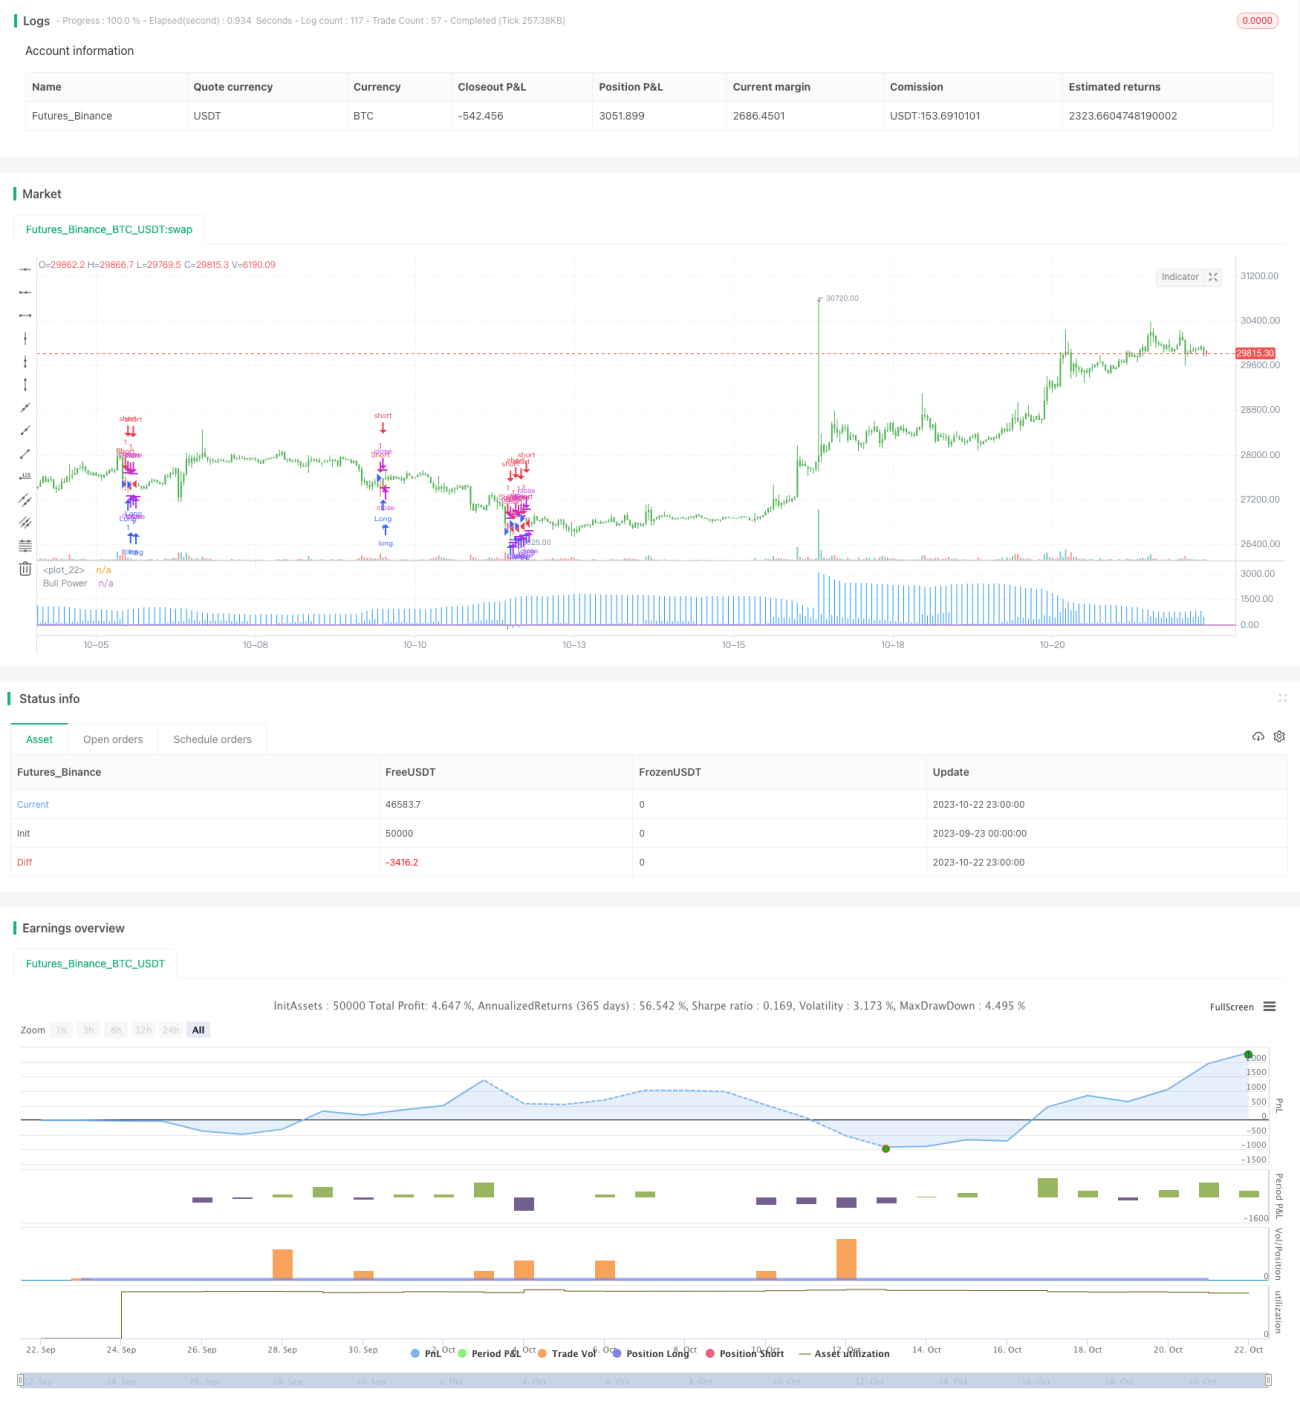
/*backtest
start: 2023-09-23 00:00:00
end: 2023-10-23 00:00:00
period: 1h
basePeriod: 15m
exchanges: [{"eid":"Futures_Binance","currency":"BTC_USDT"}]
*/

//@version = 2
////////////////////////////////////////////////////////////
//  Copyright by HPotter v1.0 08/12/2016
// Developed by Dr Alexander Elder, the Elder-ray indicator measures buying Strategy parameters
Related strategies
Comment
All comments (0)
No data
- 1