
이중 EMA 황록 거래 시스템은 이중 지수 이동 평균에 기반한 트렌드 추적 거래 시스템이다. 이 시스템은 두 개의 다른 주기의 EMA 평균을 사용하여 가격과 EMA 평균의 관계에 따라 현재 트렌드 방향을 판단하고 거래 결정을 내린다. 이 시스템은 논리적으로 간단하고 조작하기 쉽고 시장 추세를 잘 포착하여 중장기 투자자에게 적합하다.
이 전략은 주로 두 개의 EMA 평균선에 의존합니다. 각각 더 빠른 주기 EMA 평균선과 더 느린 주기 EMA 평균선입니다. 빠른 EMA가 느린 EMA 위에있을 때, bullish로 간주됩니다. 빠른 EMA가 느린 EMA 아래에있을 때, bearish로 간주됩니다.
가격과 두 EMA 평행선의 관계에 따라, K 선은 서로 다른 거래 구역으로 나눌 수 있다:
빠른 EMA가 느린 EMA 위에 있고, 가격이 빠른 EMA 위에 있을 때 ((G1), 강렬한 구매 영역을 위해, 이 때 구매할 수 있다.
빠른 EMA가 느린 EMA 아래에 있고, 가격이 빠른 EMA 아래에 있을 때, R1은 강세를 위해 판매하는 영역을 판매할 수 있다.
빠른 느린 EMA가 교차할 때, 가격과 두 EMA의 관계에 따라 노란색 ((예보) 와 오렌지 (관심)) 영역을 구분할 수 있다. 이 두 영역은 트렌드 전환의 가능성을 나타내고, 다른 영역과 다른 지표와 결합하여 거래를 결정해야 한다.
이 전략은 다른 거래 구역에서 가격의 변화에 따라 구매 및 판매 신호를 발송합니다. 강도 영역 G1 및 R1에서 전략은 직접 신호를 생성합니다. 사전 경고 및 전망 영역에서는 다른 지표가 확인되어야합니다.
또한, 이 전략은 StochRSI를 도입하여 매매 시점을 결정하는 데 도움을 줍니다. StochRSI의 과매매 시기는 추가적인 매매 신호로 사용될 수 있습니다.
전략의 논리는 간단하고 명확하며, 이해하기 쉽고 실행이 가능합니다.
트렌드 기반의 운영으로 중·장기적 트렌드를 효과적으로 포착할 수 있습니다.
거래 신호가 더 신뢰할 수 있는 강도 지역과 트렌드를 반대하는 경고/관측 지역을 구분합니다.
스토치RSI와 결합하면 매매 시점을 더 정확하게 판단할 수 있다.
순수 트렌드 시스템, 명확한 트렌드가 없는 시장에서는 거래 효과가 떨어질 수 있습니다.
잘못된 EMA 주기의 설정으로 인해 잘못된 신호가 발생할 수 있습니다.
예고 및 감시 구역은 거래의 위험성이 높기 때문에 신중하게 처리해야 합니다.
손실이 커질 위험도 고려하지 않았습니다.
위험은 다음과 같은 방법으로 줄일 수 있습니다.
트렌드가 뚜렷한 품종을 선택하고, 트렌드가 약한 품종을 거래하지 않도록 한다.
가짜 신호의 확률을 낮추기 위해 EMA 주기 변수를 최적화합니다.
다른 지표들을 도입하여 거래의 위험을 줄이는 것을 확인하기 위해 경보와 관측 구역에서;
단편적 손실을 통제하기 위해 스톱포드를 설정하십시오.
이 전략은 다음과 같은 부분에서 최적화될 수 있습니다.
더 많은 MACD, KDJ 등과 같은 지표를 도입하여 신호 품질을 향상시킵니다.
거래 구역에서 필터링 조건을 도입하여 거래량을 늘리고 거래의 성공률을 높여줍니다.
시장 상황에 따라 동적으로 EMA 파라미터를 조정하고, 최적화 파라미터를 설정합니다.
손실이 일정 비율에 도달했을 때 손실을 막는 전략을 늘립니다.
자본 관리를 최적화하고 합리적인 포지션 관리를 설정합니다.
다양한 품종에서 최적화를 테스트하여 최적의 변수 조합을 찾습니다.
더 많은 보조 판단 지표, 동적 변수 최적화, 손실 중지 전략 등의 시스템을 안정화하고, 재원 관리 등의 관점에서 위험을 줄이는 전략을 도입함으로써 더 나은 거래 효과를 얻을 수 있습니다.
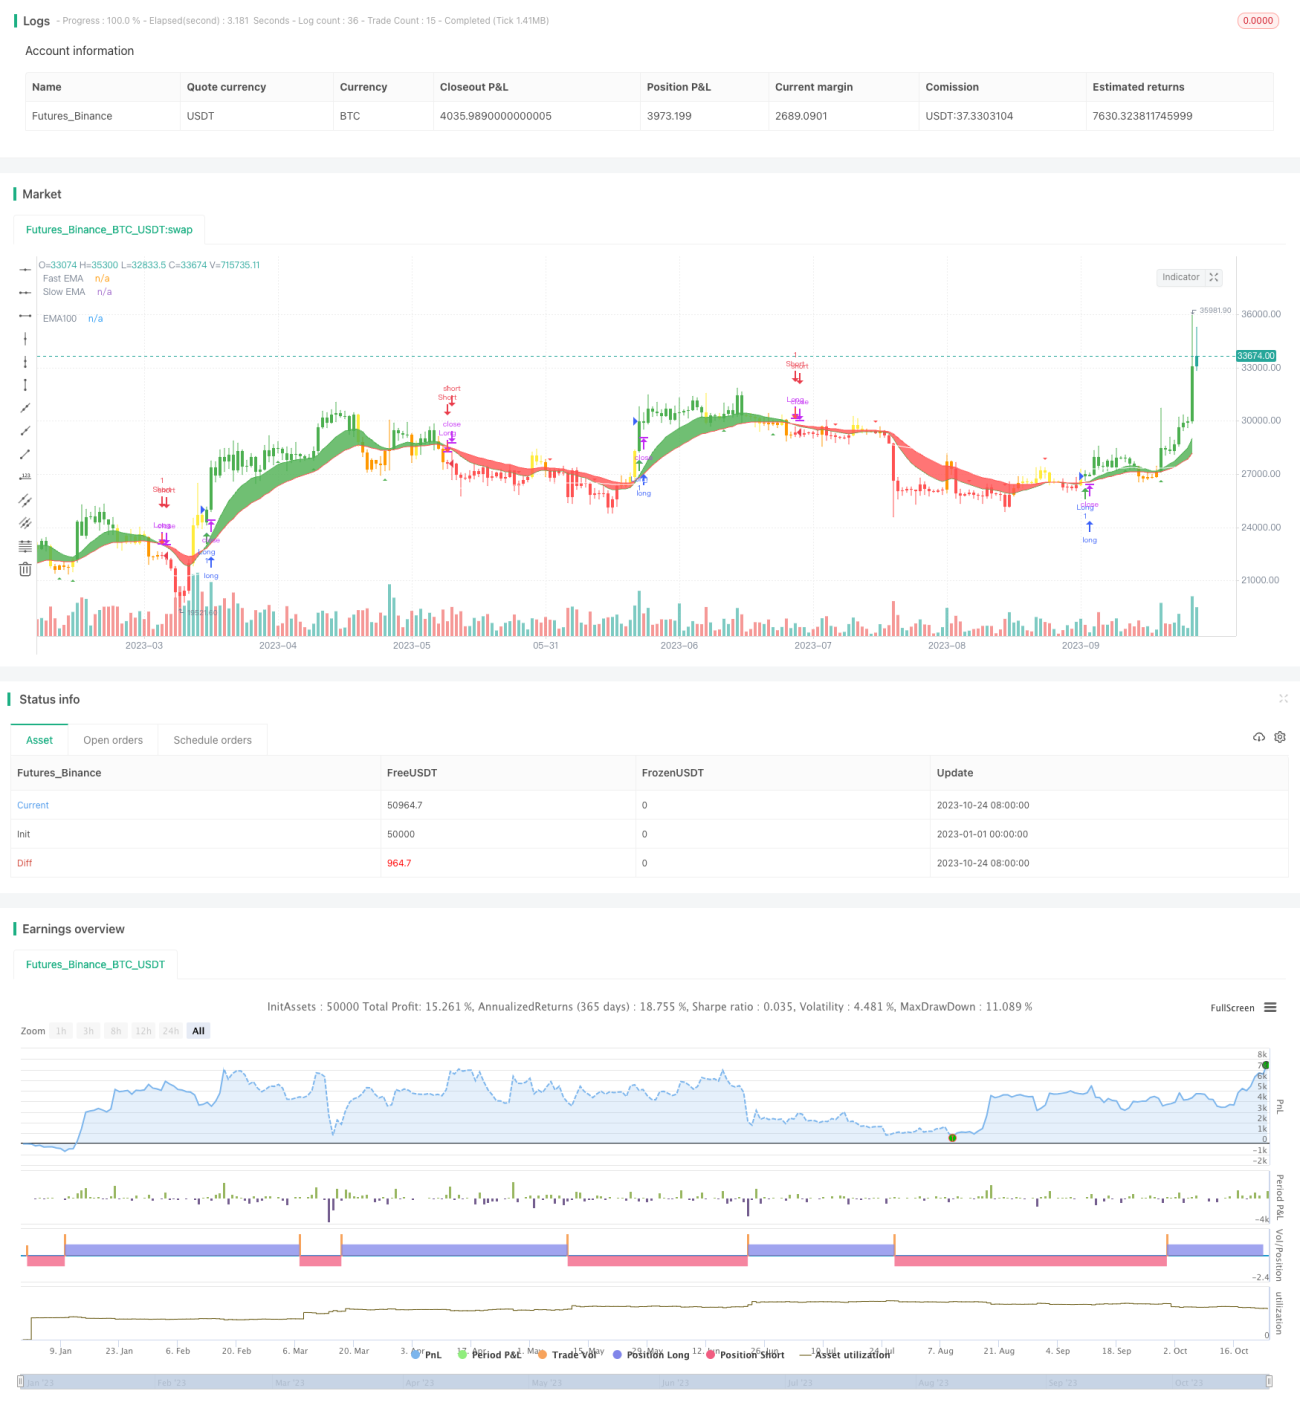
이중 EMA 황록 거래 시스템은 이중 EMA 평평선 비교를 기반으로 한 트렌드 추적 거래 시스템이다. 그것은 서로 다른 거래 지역을 구분하고, 가격과 EMA 평평선 관계에 따라 트렌드 방향을 판단하고 거래 신호를 생성하며, 논리적으로 명확하고, 쉽게 구현할 수 있는 트렌드 추적 시스템이다. 이 전략은 효과적으로 트렌드를 포착하고, 거래 규칙은 간단하고 직관적이지만, 위험도 존재한다. 보조 지표, 동적 최적화 파라미터 설정, 중지 손실 및 최적화 자금 관리 등의 방법을 도입함으로써 위험을 줄이고 시스템의 안정성과 수익성을 더욱 향상시킬 수 있다.
/*backtest
start: 2023-01-01 00:00:00
end: 2023-10-25 00:00:00
period: 1d
basePeriod: 1h
exchanges: [{"eid":"Futures_Binance","currency":"BTC_USDT"}]
*/
// This source code is subject to the terms of the Mozilla Public License 2.0 at https://mozilla.org/MPL/2.0/
// © Vvaz_
//base-on CDC ActionZone By Piriya a simple 2EMA and is most suitable for use with medium volatility market
//@version=4
strategy(title="Vin's Playzone" ,shorttitle="VPz", overlay=true, margin_long=4, margin_short=2)
//variable
srcf = input(title="Source",type=input.source,defval=close)
tffix = input(title="Fixed Timeframe",type=input.bool,defval=true)
tfn = input(title="Timeframe in",type=input.resolution,defval="D")
ema1 = input(title="Fast EMA",type=input.integer,defval=12)
ema2 = input(title="Slow EMA",type=input.integer,defval=26)
ema3 = input(title="EMA 100",type=input.bool,defval=true)
smooter =input(title="Smoothing period (1 = no smoothing)",type=input.integer,defval=2)
fillbar =input(title="Fill Bar Color",type=input.bool,defval=true)
emasw = input(title="Show EMA",type=input.bool,defval=true)
bssw = input(title="Show Buy-Sell signal",type=input.bool,defval=true)
plotmm = input(title="Show Buy-Sell Momentum",type=input.bool,defval=true)
plotmmsm = input(title="RSI Smoothing",type=input.integer,defval=0,minval=0,maxval=2)
//math
xcross =ema(srcf,smooter)
efast = tffix ? ema(security(syminfo.tickerid,tfn,ema(srcf,ema1), gaps = barmerge.gaps_off,lookahead = barmerge.lookahead_on),smooter) :ema(xcross,ema1)
eslow = tffix ? ema(security(syminfo.tickerid,tfn,ema(srcf,ema2), gaps = barmerge.gaps_off,lookahead = barmerge.lookahead_on),smooter) :ema(xcross,ema2)
ema3x = ema(xcross,100)
//Zone
Bull = efast > eslow
Bear = efast < eslow
G1 = Bull and xcross > efast //buy
G2 = Bear and xcross > efast and xcross > eslow //pre-buy1
G3 = Bear and xcross > efast and xcross < eslow //pre-buy2
R1 = Bear and xcross < efast //sell
R2 = Bull and xcross < efast and xcross < eslow //pre-sell1
R3 = Bull and xcross < efast and xcross > eslow //pre-sell2
//color
bcl = G1 ? color.green : G2 ? color.yellow : G3 ? color.orange :R1 ? color.red :R2 ? color.orange : R3 ? color.yellow : color.black
barcolor(color=fillbar ? bcl : na )
//plots
line1 = plot(ema3 ? ema3x : na ,"EMA100",color=color.white)
line2 = plot(emasw ? efast : na ,"Fast EMA",color=color.green)
line3 = plot(emasw ? eslow : na ,"Slow EMA",color=color.red)
fillcl = Bull ? color.green : Bear ? color.red : color.black
fill(line2,line3,fillcl)
//actions
buywhen = G1 and G1[1]==0
sellwhen = R1 and R1[1]==0
bullish = barssince(buywhen) < barssince(sellwhen)
bearish = barssince(sellwhen) < barssince(buywhen)
buy = bearish[1] and buywhen
sell = bullish[1] and sellwhen
bullbearcl = bullish ? color.green : bearish ? color.red : color.black
//plot trend
plotshape(bssw ? buy : na ,style=shape.arrowup,title="BUY",location=location.belowbar,color=color.green)
plotshape( bssw ? sell : na ,style=shape.arrowdown ,title="Sell",location=location.abovebar,color=color.red)
// Momentum Signal using StochRSI
smoothK = input(5,"StochRSI smooth K",type=input.integer,minval=1)
smoothD = input(4,"StochRSI smooth D",type=input.integer,minval=1)
RSIlen = input(14,"RSI length",type=input.integer,minval=1)
STOlen = input(14,"Stochastic length",type=input.integer,minval=1)
SRsrc = input(close,"Source for StochasticRSI",type=input.source)
OSlel = input(20,"Oversold Threshold",type=input.float,minval=0.00)
OBlel = input(80,"Oversold Threshold",type=input.float,minval=0.00)
rsil = rsi(SRsrc,RSIlen)
K = sma(stoch(rsil,rsil,rsil,STOlen),smoothK)
D = sma(K,smoothD)
buymore = iff( bullish ,iff(D < OSlel and crossover(K,D), 2, iff(D > OSlel and crossover(K,D), 1,0)),0)
sellmore = iff( bearish,iff(D > OBlel and crossunder(K,D), 2, iff(D < OBlel and crossunder(K,D), 1,0)),0)
//plot momentum
plotshape(plotmm ? buymore > plotmmsm ? buymore : na : na ,"Buy More!" ,style=shape.triangleup,location=location.belowbar,color=color.green)
plotshape(plotmm ? sellmore > plotmmsm ? sellmore : na : na ,"Sell More!" ,style=shape.triangledown,location=location.abovebar,color=color.red)
// === INPUT BACKTEST RANGE ===
FromYear = input(defval = 2009, title = "From Year", minval = 2009)
FromMonth = input(defval = 1, title = "From Month", minval = 1, maxval = 12)
FromDay = input(defval = 1, title = "From Day", minval = 1, maxval = 31)
ToYear = input(defval = 9999, title = "To Year", minval = 2009)
ToMonth = input(defval = 12, title = "To Month", minval = 1, maxval = 12)
ToDay = input(defval = 31, title = "To Day", minval = 1, maxval = 31)
// === FUNCTION EXAMPLE ===
start = timestamp(FromYear, FromMonth, FromDay, 00, 00) // backtest start window
finish = timestamp(ToYear, ToMonth, ToDay, 23, 59) // backtest finish window
window() => time >= start and time <= finish ? true : false // create function "within window of time"
//stratgy excuter
strategy.entry("Long",true,when=window() and buy or buymore)
strategy.close("Long",when=window() and sell or sellmore,comment="TP Long")
strategy.entry("Short",false,when=window() and sell or sellmore)
strategy.close("Short",when=window() and buy or buymore,comment="TP Short")