다양한 지표를 기반으로 한 비트코인 ​​일일 거래 전략


생성 날짜: 2023-10-30 10:37:58 마지막으로 수정됨: 2023-10-30 10:37:58
복사: 0 클릭수: 728
avatar of ChaoZhang ChaoZhang
1
집중하다
1617
수행원

다양한 지표를 기반으로 한 비트코인 ​​일일 거래 전략

개요

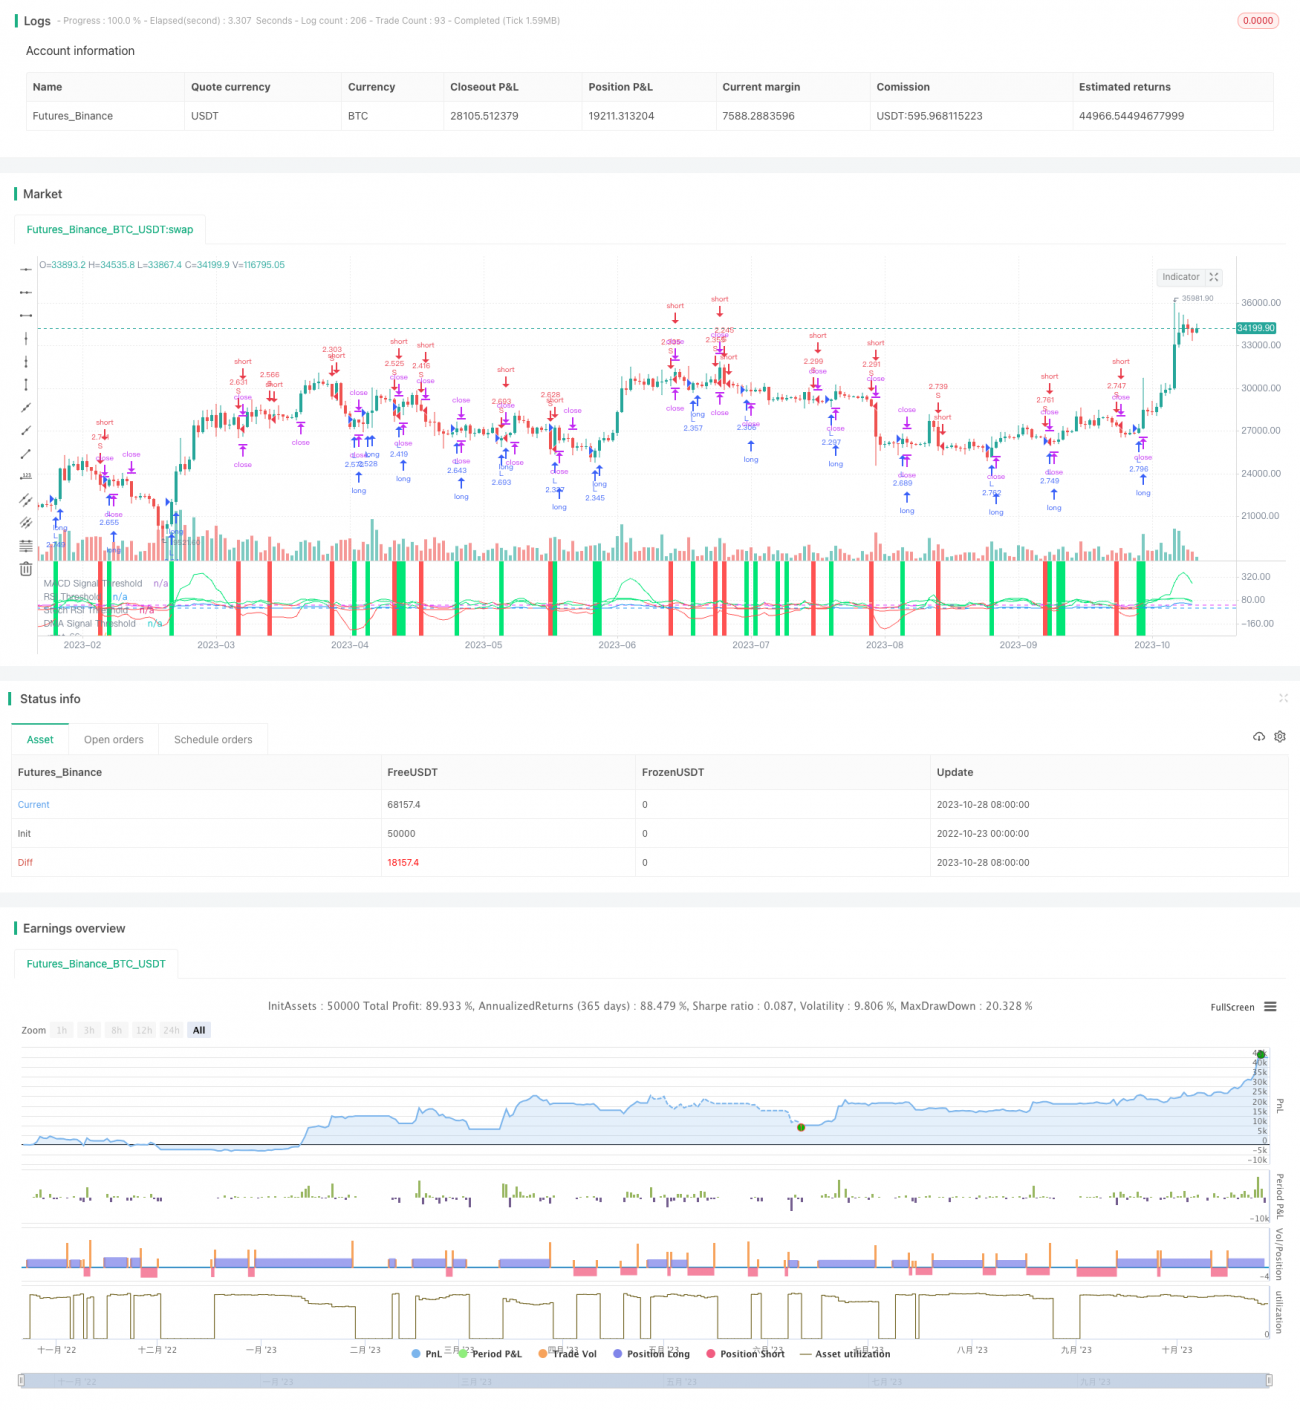
이 전략은 다수의 지표 포트폴리오를 기반으로 비트코인의 일계 시간대에 거래 기회를 찾습니다. MACD, RSI, Stoch RSI와 같은 지표가 주로 사용되며, 평행선의 방향과 결합하여 현재 트렌드 방향을 판단하여 구매 및 판매 신호를 발송합니다.

전략 원칙

이 전략은 다음과 같은 지표들을 주로 활용합니다.

  1. MACD (快线-慢线)그 신호선. MACD 위 신호선을 통과할 때 구매 신호로, 아래 0을 통과할 때 판매 신호로.

  2. RSI는 상대적으로 강하고 약한 지수이다. RSI가 설정된 경계를 넘어서면 구매 신호이다.

  3. 스토치 RSI。 스토치 RSI 지표는 RSI의 과매매 상황을 반영한다。 스토치 RSI가 설정된 경량보다 낮으면 구매 신호로, 설정된 경량보다 높으면 판매 신호로 사용한다。

  4. 평균선 방향 △ 닫기 가격 아래에서 평균선을 통과할 때 팔기 신호 △

이 지표에 따르면, 이 전략의 거래 신호는 다음과 같습니다.

구매 신호“그때”(Stoch RSI < 设定阈值) 且 (MACD上穿阈值 或 RSI上穿阈值)

신호를 팔아“그때”(MACD下穿0) 且 (收盘价下穿均线 或 Stoch RSI > 设定阈值)

여러 지표를 조합하여 현재의 트렌드 방향을 더 정확하게 판단하고 트렌드 전환점에 거래 신호를 발산 할 수 있습니다.

전략적 이점

  1. 복합적으로 여러 지표를 사용하면 판단의 정확도를 높이고, 단일 지표로 인한 잘못된 신호를 피할 수 있다.

  2. MACD 지표는 현재의 트렌드 방향과 강도를 판단할 수 있다. RSI 지표는 오버 바이 오버 소드를 반영한다. 스토크 RSI는 RSI의 오버 바이 오버 소드를 판단한다. 평행은 현재의 트렌드 방향을 판단한다.

  3. 구매 및 판매 신호는 여러 지표의 조합 조건을 설정하여 가짜 신호를 필터링하여 불필요한 거래를 방지합니다.

  4. 이 전략은 2017년 1월 1일부터 시작하여 2017년 말 비트코인이 크게 상승한 상황을 포함하고 있으며, 전략의 실적을 확인할 수 있다.

  5. 전략에는 단편 거래의 손실을 제어할 수 있는 중지 손실 설정이 포함되어 있습니다.

전략적 위험

  1. 여러 지표의 조합은 정확도를 높일 수 있지만, 지표들 사이에 불일치가 발생할 수 있으며, 이는 잘못된 판단의 위험을 초래한다.

  2. 전략 최적화 스톱 손실 수준은 상황에 따라 조정될 수 있습니다. 스톱 손실이 너무 넓으면 단편 손실이 증가하고, 스톱 손실이 너무 좁으면 스톱 손실이 제거됩니다.

  3. 일선 수준의 전략, 더 짧은 시간 범위에서 세부적인 작업을 할 수 없습니다. 갑작스러운 사건이 단기간에 큰 변동을 일으킨다면 대응할 수 없습니다.

  4. 이 전략은 일부의 역사적인 사례만을 반영하고 있으며, 과도한 적합성의 위험이 있을 수 있습니다. 전략의 효과를 확인하기 위해서는 더 긴 시간 범위와 더 많은 시장에서 테스트가 필요합니다.

최적화 방향

  1. 더 많은 조합을 테스트하여 더 나은 다중 조합 전략을 찾습니다.

  2. 지표 변수를 최적화하여 더 적합한 변수 값을 찾습니다.

  3. 다양한 Stop Loss 레벨을 테스트하고, Stop Loss과 Stop Stop 비율의 최적의 조합을 찾습니다.

  4. 더 긴 역사 속에서 재검토를 하고 지나치게 잘 어울리지 않도록 한다.

  5. 더 높은 시간대에 이 전략을 적용해서 더 자주 거래하는 것을 시도하세요.

요약하다

이 전략은 MACD, RSI, Stoch RSI와 같은 여러 지표를 조합하여 현재 비트코인 일일 라인 레벨의 트렌드 방향을 판단하여 트렌드 전환점에서 거래 신호를 발산한다. 이 전략은 거래 위험을 제어하기 위해 손실을 설정합니다.

전략 소스 코드
/*backtest
start: 2022-10-23 00:00:00
end: 2023-10-29 00:00:00
period: 1d
basePeriod: 1h
exchanges: [{"eid":"Futures_Binance","currency":"BTC_USDT"}]
*/

//@version=4
// Original code is from CredibleHulk and modified by bennef
strategy("BTC Daily Strategy BF", overlay=false, initial_capital=10000, default_qty_type=strategy.percent_of_equity, default_qty_value=100, commission_type=strategy.commission.percent, commission_value=0.075)

/////////////// Time Frame ///////////////
testStartYear = input(2017, "Backtest Start Year") 
testStartMonth = input(1, "Backtest Start Month")
testStartDay = input(1, "Backtest Start Day")
testPeriodStart = timestamp(testStartYear,testStartMonth,testStartDay, 0, 0)

testStopYear = input(2019, "Backtest Stop Year")
testStopMonth = input(12, "Backtest Stop Month")
testStopDay = input(31, "Backtest Stop Day")
testPeriodStop = timestamp(testStopYear,testStopMonth,testStopDay, 0, 0)

testPeriod() => true

/////////////// Input Params /////////////// 
rsi_threshold = input(30)
rsi_length = input(4)
srsi_length = input(8)
srsi_smooth = input(4)
srsi_sell_threshold = input(57)
length = input(14)
dma_signal_threshold = input(-1)
fastLength = input(11)
slowlength = input(18)
MACDLength = input(6)
MACD_signal_threshold = input(-2)
short_loss_tol = input(5)
long_loss_tol = input(5)

stop_level_long = strategy.position_avg_price * (1 - long_loss_tol / 100.0)
stop_level_short = strategy.position_avg_price * (1 + short_loss_tol / 100.0)
    
///////////////  Signal generation ///////////////
// MACD 
MACD = ema(close, fastLength) - ema(close, slowlength)
aMACD = ema(MACD, MACDLength)
delta = MACD - aMACD

// RSI and Stochastic RSI 
rs = rsi(close, rsi_length)
k = sma(stoch(rs, rs, rs, srsi_length), srsi_smooth)

// SMA 
norm = sma(ohlc4, length)
threshold = close - norm   

/////////////// Strategy ///////////////
long = ((crossover(delta, MACD_signal_threshold) or crossover(rs, rsi_threshold)) and k < srsi_sell_threshold)
short = (crossunder(delta, 0) or (crossunder(threshold, dma_signal_threshold) and k > srsi_sell_threshold))

if testPeriod()
    strategy.entry("L", strategy.long, when = long)
    strategy.entry("S", strategy.short, when = short)
    strategy.exit("stop loss L", from_entry = "L", stop = stop_level_long)
    strategy.exit("stop loss S", from_entry = "S", stop = stop_level_short)

/////////////// Plotting ///////////////
// MACD
plot(delta, color = delta > MACD_signal_threshold ? color.lime : delta < 0 ? color.red : color.yellow)
MACD_signal_threshold_line = hline(MACD_signal_threshold, color = color.yellow, title = "MACD Signal Threshold")

// RSI
plot(rs, color = rs > rsi_threshold ? color.lime : color.fuchsia)
rsi_threshold_line = hline(rsi_threshold, color = color.fuchsia, title = "RSI Threshold")

// Stochastic RSI 
plot(k, color = k > srsi_sell_threshold ? color.lime : color.red)
srsi_sell_threshold_line = hline(srsi_sell_threshold, color = color.white, title = "Stoch RSI Threshold")

// SMA
plot(threshold / 100, color = threshold < dma_signal_threshold ? color.red : color.blue)
dma_signal_threshold_line = hline (dma_signal_threshold, color = color.blue, title = "DMA Signal Threshold")

bgcolor(long ? color.lime : short ? color.red : na, transp=50)